Estimation of Formation Enthalpies of Organic Pollutants from a New Structural Group Contribution Method*
2013-06-07MehdiBagheriAfshinBakhtiariandMasoumeJaberi
Mehdi Bagheri**, Afshin Bakhtiariand Masoume Jaberi
1Young Researchers Club, Islamic Azad University, Science and Research Branch, Tehran 1477893855, Iran
2Tehran Naftoon Arya Eng. Co., Jahanmehr St., Fatemi Sq., Tehran 1581768516, Iran
3Department of Chemical Engineering, University of Tehran, Tehran 1136514563, Iran
Estimation of Formation Enthalpies of Organic Pollutants from a New Structural Group Contribution Method*
Mehdi Bagheri1,**, Afshin Bakhtiari2and Masoume Jaberi3
1Young Researchers Club, Islamic Azad University, Science and Research Branch, Tehran 1477893855, Iran
2Tehran Naftoon Arya Eng. Co., Jahanmehr St., Fatemi Sq., Tehran 1581768516, Iran
3Department of Chemical Engineering, University of Tehran, Tehran 1136514563, Iran


1 INTRODUCTION
Nowadays, controlling environmental pollution is one the most interests of scientists and researchers. One of the key properties affecting the fates of organic pollutants in environment is the standard state enthalpies of formation [1]. This property is foremost and critical in chemical stability analyses [1], determining enthalpies of reaction [2], investigating bond and resonance energies [3, 4], and so forth [5]. To the engineers, the accuracy of energy balance calculations is greatly dependent on the formation enthalpy values [6]. Besides, the studies on chemical and biochemical reaction require accurate formation enthalpies for the calculation of reaction equilibrium constants [7, 8].

Class 1 includes the quantum chemistry technique which entails a high computational cost and results in lower accuracies for large and medium-sized molecules [16, 17]. This method seems more reliable and applicable for organic and light hydrocarbon chemicals with the least comprehensiveness.

Class 3 called structural group contribution methods (SGCs) is based on the basic idea that the thermophysical behavior of molecules can be attributed to some decomposing structural group functions [22-25]. Due to simplicity and accuracy of SGCs, many commercial applications that can provide estimation for the properties of pure components are currently being marketed [26, 27]. In this sense, numbers of occurrences of several functional groups are used to estimate various physicochemical properties.
One of the better known group contribution (GC) based models was developed by Constantinou and Gani [17] for the estimation of thermodynamic and physical properties of pure compounds. The method used information on the molecular structure of a compound to estimate its properties at two levels. The basic level was from first-order functional groups, such as those applied in many previous methods. The second level used a set of second-order groups, which distinguished alternative collections of first-order groups as suggested by the conjugation concept [17, 18]. In this way, the method allowed for both first-order estimation and a more accurate second-order approximation. The method was quite successfully applied to the estimation of eight physical and thermodynamic properties of pure compounds including normal boiling and melting points, critical pressure, temperature and volumes, standard enthalpies of vaporization and formation at 298 K, and standard Gibbs energy [17, 18]. Many well-known process simulators and property packages currently used this method for their calculations [26, 27].
In this study, a new comprehensive model is presented to estimate standard state heat of formation of frequently used organic pollutants based on a new practical collection of structural functional groups.
2 MODEL DEVELOPMENT
2.1 Data set
2.2 Providing the new collection of chemical groups
In this step, based on the complete collection of chemical structural groups presented by Todeschini and Consonni [28], 92 functional groups were collected after removing the near zero functional groups for our present dataset. These functional groups were used as input parameters for our model. For a complete list of these functional groups and similar successful SGC studies based on them can refer to elsewhere [29-31].
To find the most important functional groups on the determination of standard heat of formation of organic pollutants, a forward stepwise regression was performed by the SPSS software package [32]. The details of the stepwise regressions can be found [28, 33]. In this sense, it should be noted that the application of complicated and non-practical computational tools as neural network, which needs tremendous calculations and specialized software, will make the model less convenient in many demanding fields. In majority of cases, developing complicated non-linear models are unreasonable unless more significant accuracies can be obtained compared to the simple practical linear multivariate models. This case may be attributed to the nonlinear nature of the property of interest or the unsuitable (non-effective) selection of relevant structural functional groups [11-15, 21].


To accomplish above procedure, the main data set should be divided into two new data sets. These two data sets include a training set and test set. By means of the training set, the best model is found, and then the prediction power is checked by test set as an external data set. Further step is to randomly select 15% (267 pure compounds) of the main database for test set and 85% (1427 pure compounds) for training set. A test dataset is formed from the available data and excluded from involvement in model training. This dataset is not used for model development and only used to determine the predictive capabilities of built models [11-15, 35-36].
3 RESUL TS AND DISCUSSION
3.1 Model presentation and validation
By presented procedure, the best multivariate linear equation was obtained. To do this, firstly, the best one-parameter model, and then the best two-parametermodel (based on two group structures) were obtained. This procedure was repeated to obtain the best model with three, four, five group structures, and so on. In this work, the best obtained model had twelve parameters, because further increase in number of group structures did not have any considerable effect on the accuracy of model. For more description on this strategy our previous works can be referred [11-15, 21, 35, 36]. The final obtained model by this procedure is presented as follows (Eq. 3):


Table 1 List and definition of each used chemical functional along with their contributions in the proposed SGC-based model (Eq. 3)


Figure 1 Predicted values ofof studied organic contaminates by Eq. (3) for train and test sets in comparison with the experimental data○ training set; □ test set; bisect

Table 2 Statistical parameters of the SGC based molecular model (Eq. 3)
In Table 2, the statistical parameters of Eq. (3) are given. As can be seen from Table 2, the resulting average absolute error (δAAE) of both training and external prediction sets are within the experimental error of formation enthalpy. More impotently, the δAAEvalues are similar for both the training and test sets, which suggests that the proposed model has both predictive ability (low values) and generalization performance (similar values) [28-31, 37]. From statistical point of view, when the δAAEis at the minimum and R2is high, (R2≥0.8), a model can be judged as very good [38].


The new criteria for an external validation were checked as recommended by Golbraikh and Tropsha [39] for test set. These authors suggested that in addition to a high value of cross validation, the correlation coefficient, R, between the predicted and observed activities of compounds from an external test set should be close to 1. Furthermore, at least the slope of one regression line (k or k′) through the origin should be close to 1. Models were considered acceptable, if they satisfied these conditions. Recently, Roy [40] introduced a confirmation indicator of the external predictability of QSPR/QSAR models, as Rmwhich was satisfied when the value was larger than 0.5. All the used parameters, their definitions, constraints and corresponding values for the proposed model are presented in Table 3.

3.2 Model pr ediction ca pabilities f or differ ent chemical classes
Generally, in the case of large dataset statistical studies, investigation and classification of the model predictions on the basis of relative error distribution analysis is strongly recommended by many researches [11-15, 25, 31, 41, 42]. The most meaningful categorization is typically based on molecular structural similarities. In this work, the 1694 organic pollutants of the DIPPR dataset were categorized into 77 different material classes on the basis of structural similarity. To accomplish a comprehensive error distribution investigation, the absolute relative error (δARE) percentage and average absolute relative error (δAARE) for each individual chemical material classes are calculated based on Eqs. (4) and (5).

Table 3 Parameters and their values used in the external test method by Golbraikh and Tropsha [39]

Table 4 List of 1694 DIPPR organic pollutants based on 77 chemical material classes and their distributions in each δARE(%) range for the proposed model in accompany with the average δARE(%) for the entire dataset and test set

Table 4(Continued)

Figure 2 Fractional percentage of organic pollutants belong to each error intervals

As can be observed in Table 4 from the total number of 1694 investigated organic pollutants, δAREof 800 components are lower than 10% (the first error range), 357 are present in the second error range between 10%-25%, 192 in 25%-50%, 96 in 50%-75% and 54 in 75%-100%. Finally, the left which comprise 195 components are shown to have more than 100% δARE. The total percentage fraction of each specified error range of the proposed SGC-based model can be visualized in Fig. 2.
Based on the δAREerror distributions and the δAAREinvestigation, the model is strongly recommended when the δAAREis lower than 25% and a high fraction of components can be found in the first two error ranges. In the case of classes with an δAAREpercentage of lower than 50%, the application of the suggested model is reliable with an acceptable accuracy. However, more caution should be attained for the chemical classes with a minority of chemicals in the last error interval. In the case of these chemical classes denoted with a star in Table 4, more accurate experimental data are needed to firmly judge the model ability and validity for the entire chemical class. Generally, when a minority of chemicals from a chemical class display significantly larger model prediction errors as compared to other members of the same class, these errors may be attributed to inaccurate experimental data rather than the group structural based prediction [11-15, 29-31]. In this manner, the seven chemical classes of C3 & higher aliphatic chlorides, cycloalkanes; cycloalkenes, sulfides/thiophenes, other hydrocarbon rings, nitriles and polyfunctional C, H, O, N are categorized with single stared sign in Table 4.
Ultimately, the presence of a higher fraction of chemicals in the last two error ranges leads to a larger δAAREpercentage and unacceptable model predictions. These classes denoted with double stars in Table 4 exhibit structural dissimilarities with other chemical classes.
Consequently, the proposed model applicability for other amines, imines, polyfunctional C, H, N, halide, (O), aromatic chlorides, alkynes, aromatic amines, dialkenes, aromatic chlorides, C, H, NO2compounds, isocyanates/diisocyanates, and terpenes classes must be done with high uncertainty and hesitation. This final category may reveal completely different parameters responsible for the heat of formation prediction. In this case, the application of the proposed model is not recommended and individual quantitative structure property relationship (QSPR) study of these classes seems to be of high importance [18-21, 35-37].
Of particular note, the obtained results may be improved by robust nonlinear modeling tools such as of Artificial Neural Networks (ANN), Adaptive Neuro-Fuzzy Intelligence Systems (ANFIS), BayesianNetworks and Support Vector Machines (SVM). However, these methods can be burdensome to implement and can be time consuming due to computational complexity [11-14, 29-31].
3.3 Comparison to previous models
To best of our knowledge no similar SGC-based study has been reported specifically for the estimation of standard state heat of formation for a wide range of pure components. In this sense, statistics of the most recent published quantitative structural based study by Vatani et al. [18] is compared to the statistics of the present study in Table 5. Although the QSPR approach shows comparable results to the SGC-based model (Eq. 3), calculation of its relevant molecular descriptors requires special knowledge or software. Thus, its implementation is more complicated and time-consuming compared to the SGC approach by this work. Also, as can be seen in Table 5, the number of used components in this study is about one third more than the one used [18], which can expand the generalizability of the proposed model.
3.4 Mode l estimation for missing experimental formation enthalpies

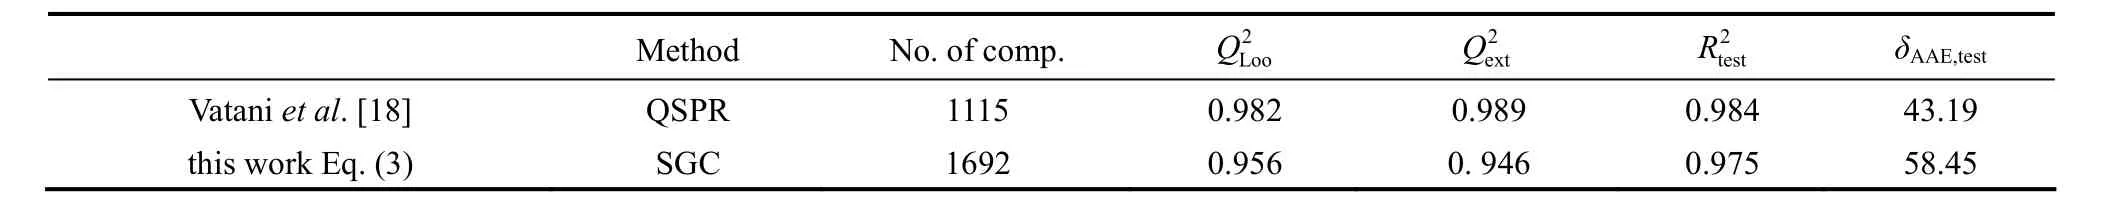
Table 5 Comparison of QSPR and SGC models
Table 6 Model prediction for 27 DIPPR missingdata of DIIPR dataset
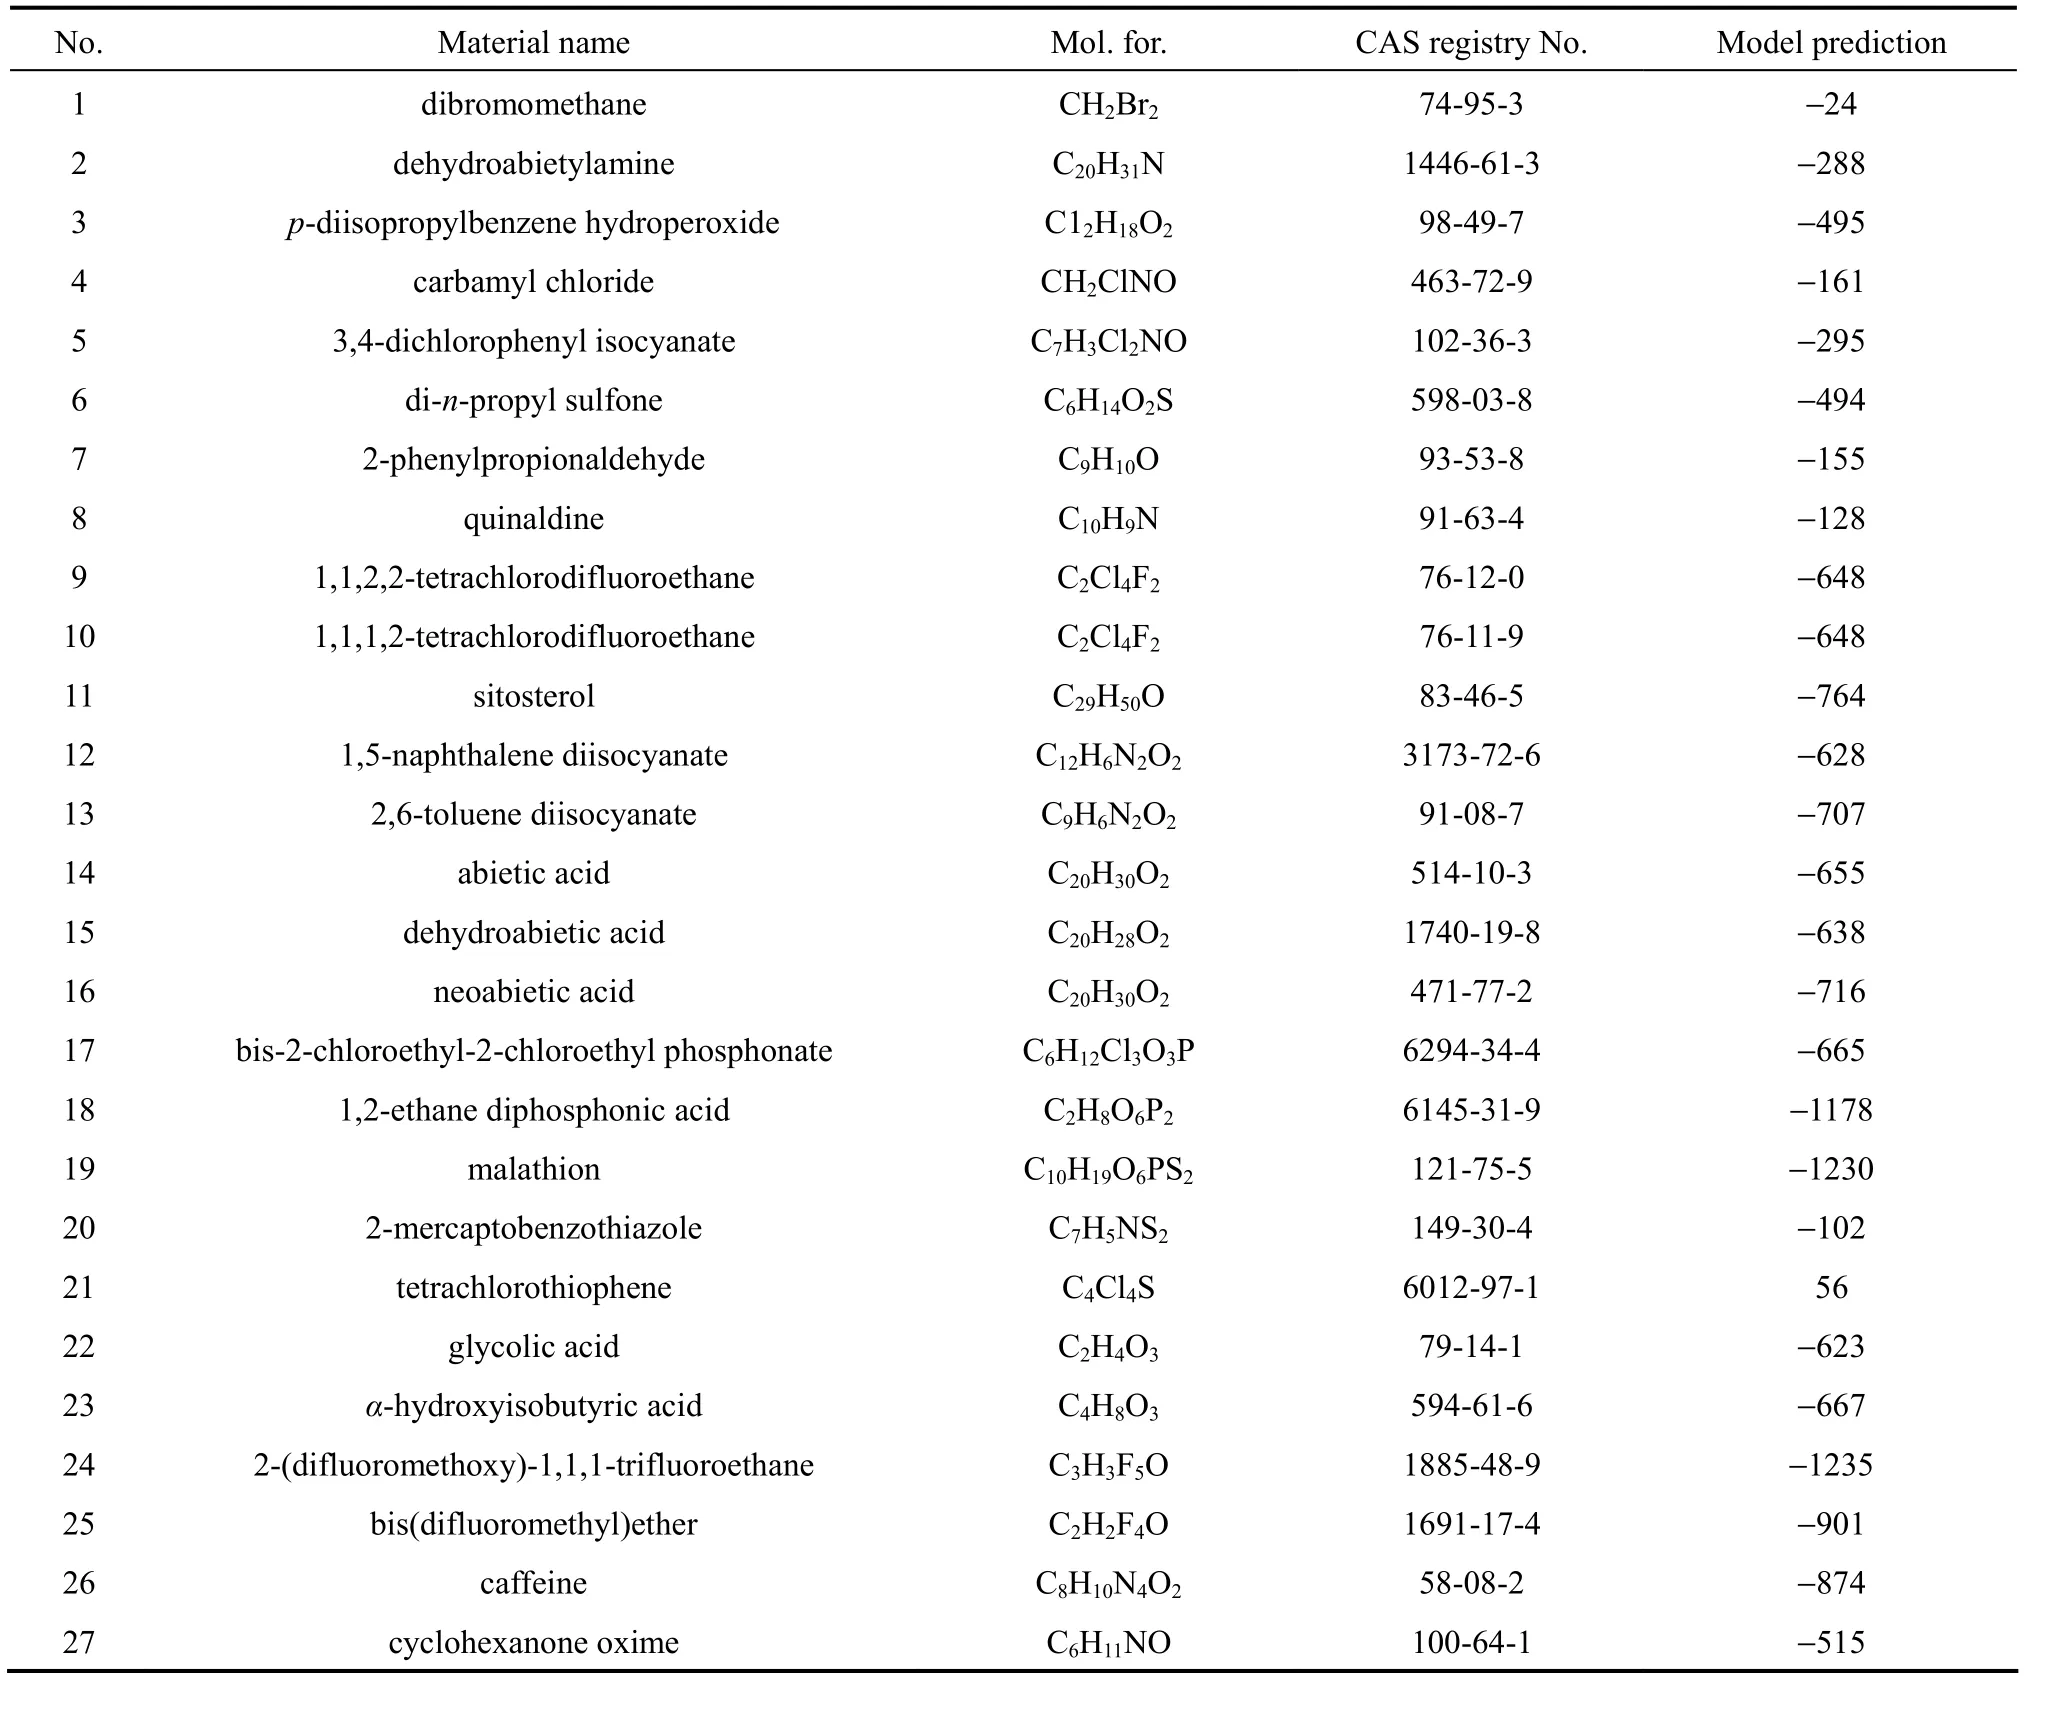
Table 6 Model prediction for 27 DIPPR missingdata of DIIPR dataset
No. Material name Mol. for. CAS registry No. Model prediction 1 dibromomethane CH2Br274-95-3 −24 2 dehydroabietylamine C20H31N 1446-61-3 −288 3 p-diisopropylbenzene hydroperoxide C12H18O298-49-7 −495 4 carbamyl chloride CH2ClNO 463-72-9 −161 5 3,4-dichlorophenyl isocyanate C7H3Cl2NO 102-36-3 −295 6 di-n-propyl sulfone C6H14O2S 598-03-8 −494 7 2-phenylpropionaldehyde C9H10O 93-53-8 −155 8 quinaldine C10H9N 91-63-4 −128 9 1,1,2,2-tetrachlorodifluoroethane C2Cl4F276-12-0 −648 10 1,1,1,2-tetrachlorodifluoroethane C2Cl4F276-11-9 −648 11 sitosterol C29H50O 83-46-5 −764 12 1,5-naphthalene diisocyanate C12H6N2O23173-72-6 −628 13 2,6-toluene diisocyanate C9H6N2O291-08-7 −707 14 abietic acid C20H30O2514-10-3 −655 15 dehydroabietic acid C20H28O21740-19-8 −638 16 neoabietic acid C20H30O2471-77-2 −716 17 bis-2-chloroethyl-2-chloroethyl phosphonate C6H12Cl3O3P 6294-34-4 −665 18 1,2-ethane diphosphonic acid C2H8O6P26145-31-9 −1178 19 malathion C10H19O6PS2121-75-5 −1230 20 2-mercaptobenzothiazole C7H5NS2149-30-4 −102 21 tetrachlorothiophene C4Cl4S 6012-97-1 56 22 glycolic acid C2H4O379-14-1 −623 23 α-hydroxyisobutyric acid C4H8O3594-61-6 −667 24 2-(difluoromethoxy)-1,1,1-trifluoroethane C3H3F5O 1885-48-9 −1235 25 bis(difluoromethyl)ether C2H2F4O 1691-17-4 −901 26 caffeine C8H10N4O258-08-2 −874 27 cyclohexanone oxime C6H11NO 100-64-1 −515
4 CONCLU SIONS
ACKNOWLEDGEMENTS
We wish to express our thanks to the anonymous reviewers and the editorial team for their constructive comments. Also, we are grateful to Ms. Mahshid Ghazanfari Nejad for the language editing.
REFERENCES
1 Wang, X.B., Tian, D.C., Wang. L.L., “The electronic structure and chemical stability of the AlB2-type transition-metal diborides”, J. Phys.: Condens. Matter., 6, 10185-10192 (1994).
2 Nahas, A.M.E., Navarro, M.V., Simmie, J.M., Bozzelli, J.W., Curran, H.J., Dooley, S., Metcalfe, W., “Enthalpies of formation, bond dissociation energies and reaction paths for the decomposition of model biofuels: Ethyl propanoate and methyl butanoate”, J. Phys. Chem. A, 111, 3727-3739 (2007).
3 Franklin, J.L., Field, F.H., “The resonance energies of certain organic free radicals and ions”, J. Am. Chem. Soc., 75, 2819-2821(1953).
4 Holdiness, M.R., “Heats of atomization and resonance energy of some ortho-substituted benzoic acids”, Thermochim. Acta., 71, 257-263 (1983).
5 Gutowski, K.E., Rogers, R.D., Dixon, D.A., “Accurate thermochemical properties for energetic materials applications. I. Heats of formation of nitrogen-containing heterocycles and energetic precursor molecules from electronic structure theory”, J. Phys. Chem. A, 110, 11890-11897 (2006).
6 Himmelblau, D.M., Riggs, J. B., Basic Principles and Calculations in Chemical Engineering, Prentice-Hall, New Jersey (2003).
7 Gans, P., Sabatini, A., Vacca, A., “Simultaneous calculation of equilibrium constants and standard formation enthalpies from calorimetric data for systems with multiple equilibria in solution”, J. Solution Chem., 37, 467-476 (2008).
8 Andersen, K., “Practical calculation of the equilibrium constant and the enthalpy of reaction at different temperatures”, J. Chem. Educ., 71, 474-479 (1994).
9 Brigham Young University, Design Institute for Physical Properties (DIPPR®801), AIChE, Provo (2010).
10 Goodwin, A.R.H., Marsh, K.N., Wakeham, W.A., Measurement of the Thermodynamic Properties of Single Phases, Elsevier, Netherland (2003).
11 Gharagheizi, F., Bagheri, M., “A simple QSPR model for prediction of flash point temperature of pure organic compounds”, In: Proceedings of Third International Conference on Thermal Engineering, Amman, Jordan (2007).
12 Bagheri, M., Bagheri, M., Heidaria, F., Fazeli, A., “Nonlinear molecular based modeling of the flash point for application in inherently safer design”, J. Loss Prev. Process Ind., 25, 40-51 (2012).
13 Bagheri, M., Rajabi, M. Mirbagheria, M., Amin, M., “BPSO-MLR and ANFIS based modeling of lower flammability limit”, J. Loss Prev. Process Ind., 25, 373-382 (2012).
14 Bagheri, M., Golbraikh, A.“Rank based ant system method for nonlinear QSAR studies: QSAR study of the Solubility Parameters”SAR QSAR Environ. Res., 23, 59-86 (2012).
15 Fazeli, A., Bagheri, M., Ghaniyari-Benis, S., Aslebagh, R., Kamaloo, E., “Prediction of absolute entropy of ideal gas at 298 K of pure chemicals through GAMLR and FFNN”, Energ. Convers. Manage., 52, 630-634 (2011).
16 Brothers, E.N., Izmaylov, A.F., Rusakov, A.A., Scuseria, G.E., “On calculating a polymer’s enthalpy of formation with quantum chemical methods”, J. Phys. Chem. B, 111, 13869-13872 (2007).
17 Dixon, D.A., Peterson, K.A., “Heats of formation of CCl and CCl2from ab initio quantum chemistry”, J. Chem. Phys., 115, 6327-6329 (2001).
18 Vatani, A., Mehrpooya, M., Gharagheizi, F., “Prediction of standard enthalpy of formation by a QSPR model”, Int. J. Mol. Sci., 8, 407-432 (2007).
19 Castro, E.A., Fernandez, F.M., Duchowicz, P.R., “QSPR modeling of the enthalpy of formation based on partial order ranking”, J. Math. Chem., 37, 433-441 (2005).
20 Jover, J., Bosque, R., Simões, J.A.M., Sales, J., “Estimation of enthalpies of formation of organometallic compounds from their molecular structures”, J. Org. Chem., 693, 1261-1268 (2008).
21 Bagheri, M., Yerramsetty, K.M., Neely, B.J., Gasem, K.A.M., “Theory-based quantitative structure-property relationship models for standard heat of formation predictions”, In: Proceedings of AIChE Annual Meeting, UT (2010).
22 Constantinou, L., Gani, R., “New group contribution method for estimating properties of pure compound”, AIChE J., 40, 1697-1710 (1994).
23 Marrero, J., Gani, R., “Group-contribution based estimation of pure component properties”, Fluid Phase Equilib., 183/184, 183-208 (2001).
24 Qiang, W., Peisheng, M., Shifeng, N., “Position group contribution method for estimation of melting point of organic compounds”, Chin. J. Chem. Eng., 17, 468-472 (2009).
25 Lazzús, J.A., “Prediction of flash point temperature of organic compounds using a hybrid method of group contribution + neural network + particle swarm optimization”, Chin. J. Chem. Eng., 18, 817-823 (2010).
26 ASPEN PLUS Reference Manual, 2001. Part Number: Aspen Physical Property System 11.1, Aspen Technology, Cambridge, MA.
27 Satyro, M.A., “Thermodynamics and the simulation engineer”, Chem. Prod. Process Model., 3, 1-41 (2008).
28 Todeschini, R., Consonni, V., Molecular Descriptors for Chemoinformatics, Wiley, Germany 2009.
29 Gharagheizi, F., Alamdari, R. F., Angaji, M. T., “A new neural network-group contribution method for estimation of flash point”, Energy Fuels., 22, 1628-1635 (2008).
30 Gharagheizi, F., “A new group contribution-based method for estimation of lower flammability limit of pure compounds”, J. Hazard Mater., 170, 595-604 (2009).
31 Gharagheizi, F., Abbasi, R., Tirandazi, B., “Prediction of Henry’s law constant of organic compounds in water from a new group-contributionbased model”, Ind. Eng. Chem. Res., 49, 10149-10152 (2010).
32 SPSS Inc., PASW Statistics for Windows, 18th edition, SPPSS Inc., Chicago (2009).
33 Anderson, T., An Introduction to Multivariate Statistical Analysis, 3rd Ed., Wiley, New York, 2003.
34 Bagheri, M., Nejad Ghaffar Borhani, T., Zahedi, G.,“Estimation of flash point and autoignition temperature of organic sulfur chemicals”, Energy Convers. Manage., 58, 185-196 (2012).
35 Bagheri, M., Bagheri, M., Gandomi, A.H, Golbraikh, A., “Simple yet accurate prediction method for sublimation enthalpies of organic contaminants”, Thermochim. Acta., 543, 96-106 (2012).
36 Bagheri, M., Yerramsetty, K.M., Neely, B.J., Gasem, K.A.M., “Molecular modeling of the standard state heat of formation”, Energy Convers. Manage., 65, 587-596 (2013)
37 Bagheri, M., Bagheri, M., Gandomi, A. H., Shahbaznezhad, M.,“Multi expression programming based model for prediction of formation enthalpies of nitro-energetic materials”, Expert Systems, 30, 66-78 (2012).
38 Kasabov, N.K., Foundations of Neural Networks Fuzzy Systems and Knowledge Engineering, MIT Press, Cambridge (1998).
39 Golbraikh, A., Tropsha, A., “Beware of q2!”, J. Molecul. Graph. Model., 20, 269-276 (2002).
40 Roy, P.P., Roy, K., “On some aspects of variable selection for partial least squares regression models”, QSAR Comb. Sci., 27, 302-313 (2008).
41 Bagheri, M., Yerramsetty, K.M., Neely, B.J., Gasem, K.A.M., “A new auto-ignition temperature model for pure hydrocarbons”, In: Proceedings of AIChE Annual Meeting, Minneapolis, MN (2011).
42 Bagheri, M., Yerramsetty, K.M., Neely, B.J., Gasem, K.A.M., “Improved nonlinear models for the refractive index (RI) of organic and inorganic materials”, In: Proceedings of AIChE Annual Meeting, Minneapolis, MN (2011).
2012-04-30, accepted 2012-12-07.
* Supported by the “Tehran Naftoon Arya Eng. Co.” research committee of Iran.
** To whom correspondence should be addressed. E-mail: Mbagheri@chbe.ubc.ca
杂志排行

Chinese Journal of Chemical Engineering的其它文章
- Preparation of Mesoporous Carbons from Acrylonitrile-methyl Methacrylate Copolymer/Silica Nanocomposites Synthesized by in-situ Emulsion Polymerization*
- Immobilization of Papain in Biosilica Matrix and Its Catalytic Property*
- Comparison on Thermal Conductivity and Permeability of Granular and Consolidated Activated Carbon for Refrigeration*
- Effect of Hydrogen Reduction of Silver Ions on the Performance and Structure of New Solid Polymer Electrolyte PEI/Pebax2533/AgBF4Composite Membranes*
- Synthesis of 2-Methyl-4-methoxyaniline from o-Nitrotoluene Using Pt/C and Acidic Ionic Liquid as Catalyst System*
- Adsorption and Desorption Behavior of Tannic Acid in Aqueous Solution on Polyaniline Adsorbent*