Statistical Monitoring of Chemical Processes Based on Sensitive Kernel Principal Components*
2013-06-07JIANGQingchao姜庆超andYANXuefeng颜学峰
JIANG Qingchao (姜庆超) and YAN Xuefeng (颜学峰)**
Key Laboratory of Advanced Control and Optimization for Chemical Processes of Ministry of Education, East China University of Science and Technology, Shanghai 200237, China
Statistical Monitoring of Chemical Processes Based on Sensitive Kernel Principal Components*
JIANG Qingchao (姜庆超) and YAN Xuefeng (颜学峰)**
Key Laboratory of Advanced Control and Optimization for Chemical Processes of Ministry of Education, East China University of Science and Technology, Shanghai 200237, China
The kernel principal component analysis (KPCA) method employs the first several kernel principal components (KPCs), which indicate the most variance information of normal observations for process monitoring, but may not reflect the fault information. In this study, sensitive kernel principal component analysis (SKPCA) is proposed to improve process monitoring performance, i.e., to deal with the discordance of T2statistic and squared prediction error δSPEstatistic and reduce missed detection rates. T2statistic can be used to measure the variation directly along each KPC and analyze the detection performance as well as capture the most useful information in a process. With the calculation of the change rate of T2statistic along each KPC, SKPCA selects the sensitive kernel principal components for process monitoring. A simulated simple system and Tennessee Eastman process are employed to demonstrate the efficiency of SKPCA on online monitoring. The results indicate that the monitoring performance is improved significantly.
statistical process monitoring, kernel principal component analysis, sensitive kernel principal component, Tennessee Eastman process
1 INTRODUCTION
As production equipment in modern chemical industry becomes larger, speed-higher, more complex and more intelligent, fault detection and diagnosis in chemical processes are more important for safety and improvement of productivity. Recently, multivariate statistical process monitoring (MSPM) methods, which identify linear relationships between the recorded process variables and generate reduced sets of scores, have great progress because of the development of equipment for measurement, data storage and computation [1-5]. Principal component analysis (PCA) is the most widely used method because it can effectively deal with high-dimensional, noisy and highly correlated data by projecting the data onto a lower-dimensional space that contains most variance information of data [6-8].
To deal with the problem from nonlinear data, Kramer developed a nonlinear PCA method based on auto-associative neural networks [9], but it is difficult for the network to be trained because it has five layers and to determine the number of nodes in each layer. Dong and McAvoy [6] developed a nonlinear PCA approach based on principal curves and neural networks, with the assumption that the nonlinear function can be approximated by a linear combination of several univariate functions so that it can be expressed as a sum of functions of individual variables. Such mappings can be made only for a limited class of nonlinear models and the application of the principal curve algorithm is restricted to the identification of structures that exhibit additive-type behavior [10, 11]. Many extensional methods of PCA,such as kernel PCA (KPCA), dynamic PCA (DPCA) [12-15], probabilistic PCA (PPCA) [16, 17] and multiway PCA (MPCA) [18, 19], have been proposed to improve process monitoring performance, among which KPCA, as a new nonlinear PCA technique, progresses fast as a promising method for tackling nonlinear systems [20-22]. KPCA first maps the input space into a feature space via nonlinear mapping and then computes the principal components (PCs) in the high-dimensional feature space. Compared to other nonlinear methods, the main advantage of KPCA is that it does not involve nonlinear optimization.
In KPCA monitoring, the first several kernel principal components (KPCs) corresponding to the largest eigenvalues based on normal observations are selected, without considering the information of process fault. However, the number of components in highdimensional space is large, and the sensitivities of principal components to faults are not the same and nor in the order of eigenvalue decrease. Process monitoring based on KPCA has a problem, i.e., T2statistic and squared prediction error (δSPE) statistic do not give the same result and miss detection when a fault occurs, which are mostly due to missing fault information in process data compressing, so only the first several KPCs are employed for process monitoring. Hence, sensitive kernel principal components that represent the character information of the fault are expected to be found and can be used to monitor the process for good monitoring performance.
In this article, a novel fault detection method based on sensitive kernel principal component analysis (SKPCA) is proposed to improve process monitoring performance. The definition of sensitive kernelprincipal component (SKPC) is introduced and the change rate of T2statistic is defined to determine SKPCs of some fault due to the ability of T2statistic to measure the variation directly along each kernel principal component. These SKPCs contain large amount of information for fault detection and diagnosis, which is illustrated by observing the monitoring behavior of T2statistics along each KPC on a simulated simple process. The case studies on the simulated process and Tennessee Eastman (TE) process demonstrate the performance of the SKPCA model on online monitoring.
2 PROCESS M ONITORING B ASED O N KE RNEL PCA
2.1 Kernel principal component analysis
In KPCA, observations are nonlinearly mapped into a high-dimensional space, referred to as feature space F. In the feature space, the linear PCA is employed to extract the nonlinear correlation relationship between the variables. According to Cover’s theorem, the nonlinear data structure in the input space is more likely to be linear after high-dimensional nonlinear mapping [23]. KPCA finds a computationally tractable solution through a simple kernel function that intrinsically constructs a nonlinear mapping from the input space to the feature space [24, 25].


where λ andvdenote eigenvalue and eigenvector of covariance matrixCF, respectively, and 〈x,y〉 denotes the dot product betweenxandy. This implies that all solutionsvwith λ≠0 must lie in the span ofΦ(x1),…,Φ(xN). Then λv=CFvis equivalent to


Combining Eqs. (3) and (4), we obtain


and the right-hand side of Eq. (5) can be expressed as

Equation (7) becomes2(1/)NKα. Combining Eqs. (6) and (7), we obtain


for nonzero eigenvalues. Now, performing PCA in F is equivalent to resolving the eigenvalue-problem of Eq. (9). This yields eigenvectorsα1,α2,…,αNwith eigenvalues λ1≥λ2≥,…,≥λN. The dimensionality of the problem can be reduced by retaining only the first p eigenvectors using the cumulative contribution rate rCCRmethod.

We normalizeα1,α2,…,αpby requiring that the corresponding vectors in F be normalized, i.e.


There exist a number of kernel functions and in this work the radial basis kernel function is used, which is

where c is specified a priori by the user.
Before applying KPCA, mean centering in the high-dimensional space should be performed. This can be done by substituting the kernel matrixKwith

2.2 T2statistic and δSPEstatistic
T2statistic and δSPEstatistic are constructed and monitored in KPCA based on the assumption that training data are multivariate normal in the feature space [10, 24]. T2statistic is the sum of the normalized squared scores and is defined as

wherekt is obtained from Eq. (12) and1−Λis the diagonal matrix of the inverse of the eigenvalues with the retained PCs. The confidence limit for T2is obtained using the F-distribution

where N is the number of samples in the model, p is the number of PCs, and γ is the level of significance.
In KPCA model, the δSPEstatistic is obtained using the equations
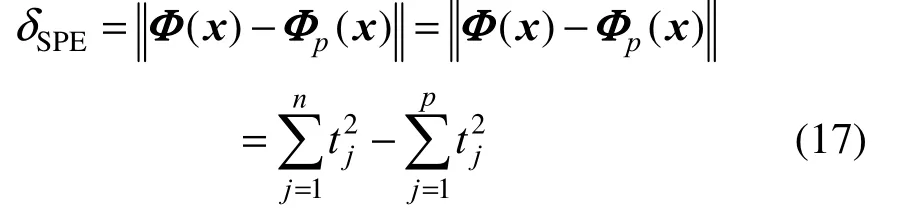
where n is the number of nonzero eigenvalues generated from Eq. (9) among the total N eigenvalues. The confidence limit for the δSPEcan be computed from its approximate distribution

where g is a weighting parameter to account for the magnitude of the δSPE,2χ is the chi-square distribution and h accounts for the degree of freedom. More details on the two statistic parameters are represented in [10, 24].
2.3 Process monitoring based on KPCA
The following simulations are in Matlab 7.12.0 (2011a) environment. Consider the following simple system with three variables but only one factor, originally suggested by Dong and McAvoy [6, 24].

where e1, e2 and e3 are independent noise variables N(0,0.01), and t∈[0.01,2]. Normal data comprising 100 samples are generated according to these equations. Two sets of test data comprising 300 samples each are also generated. The following two disturbances are applied separately during generation of the test data sets.
Disturbance 1: a step change of x2by −0.4 is introduced starting from sample 101.
Disturbance 2: x1is linearly increased from sample 101 to 270 by adding 0.01×(s−100) to the x1value of each sample in this range, where s is the sample number.
Monitoring performance of KPCA is shown in Fig. 1, in which the first 3 kernel principal components occupying 85% cumulative contribution rate are retained. For Disturbance 1 in this simple system, the disturbance ca2n be detected successfully by δSPEstatistic, while T statistic2does not behave very well. For Disturbance 2, both T statistic and δSPEstatistic detect the disturbance successfully.


Figure 1 Online monitoring of Disturbance 1 (a) and Disturbance 2 (b) using KPCA model

Figure 2of each kernel principal component
3 PR OCESS MONITORING BASED ON SKPCA
3.1 Sensitive kernel principal components


where x is the data point under consideration, xiis an observation value from the data set, c is the window width (also known as the smoothing parameter), N is the number of observations, and K is the kernel function. The kernel function K determines the shape of the smooth curve and satisfies the condition


3.2 Process monit oring using sensitive kernel principal components

Off line modeling:


Online monitoring:
(1) Normalize the current sample data using mean values and variance of the training data.


3.3 Simulations and application
3.3.1Application in the simple system


3.3.2Application in TE process
TE process is a benchmark problem in chemical process engineering. Downs and Vogel presented this particular process at an AIChE meeting in 1990s as a plant-wide control problem [28]. This simulator of Tennessee Eastman process consists of five major unit operations: a reactor, a product condenser, a vaporliquid separator, a recycle compressor and a product stripper. Two products are produced by two simultaneous gas-liquid exothermic reactions, and a byproduct is from two additional exothermic reactions. The process has 12 manipulated variables, 22 continuous process measurements and 19 compositions. The simulator can generate 21 types of different faults. All the process measurements include Gaussian noise. Once the fault enters the process, it affects almost all state variables in the process [29, 30]. The control scheme for the Tennessee Eastman process is shown in Fig. 6.


Figure 3 Cumulative probability density ofof the simple system (b)
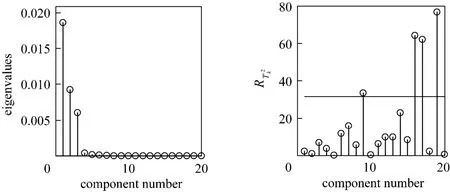
Figure 4 Eigenvalues of normal sample andof Disturbance 2

Figure 5 Monitoring performance of Disturbances 1 (a) and 2 (b) using SKPCA

Figure 6 Control scheme for the Tennessee Eastman processCWS: cooling water suck; CWR: cooling water return; A-E: components

Figure 7 Sensitive kernel principal components of Faults 11 and 14

Figure 8 Monitoring performance of Faults 11 (a) and 14 (b) using KPCA and SKPCA models
Figure 8 presents the monitoring performance based on KPCA and SKPCA models and reveals that the T2statistic of the sensitive kernel principal components can detect the faults successfully and timely. When Fault 11 occurs, T2with SKPC presents a large jump and is more than the threshold. The result indicates that there is a fault in process. When Fault 14 occurs, both SKPC T2statistic and SKPC δSPEstatistic can detect the fault successfully, showing better monitoring performance than that in KPCA model.
T2statistic is an important statistic when making a judgment for the process state. Process monitoring based on SKPCA takes the information of fault into account timely and can catch the largest variation inprocess, improving the fault detection performance of T2statistic significantly. Once a fault is detected, the next step is to determine the cause of the out-of-control status. The task of fault diagnosis is rather challenging when the number of process variables is large and the process is highly integrated. The sensitive kernel principal components contain a large amount of information of the coming fault, providing a novel approach for fault diagnosis, though more work is needed.
4 CONCLU SIONS
Since KPCA model can not detect some faults efficiently, the behavior of T2statistic and the monitoring performance are analyzed to find the cause. In order to improve the online monitoring performance, process monitoring based on sensitive kernel principal components is proposed. SKPCA examines T2statistic of each kernel principal component and searches the most sensitive kernel principal components of fault in feature space, which is applied to determine whether there is a fault in process or not. The novel modeling method is applied to online monitoring of a simple process and TE process. Compared with the classical KPCA models, the monitoring performance of SKPCA is improved. Future work will be focused on fault diagnosis based on SKPCA. The sensitive kernel principal components contain more information of some faults, may represent the fault character and provide significant information to facilitate process fault diagnosis.
NOMENCLATURE
CFcovariance matrix in feature space
c smoothing parameter
e1, e2 and e3 independent noise variables
g weighting parameter
h degree of freedom
K kernel function
K kernel matrix

m number of variables
n number of observations
p number of principal components retained
q number of sensitive kernel principal components
rCCRcumulative contribution rate
s sample number in the simple process
t principal component
v eigenvector of covariance matrix
α eigenvector of kernel matrix
γ level of significance
Λ−1diagonal matrix of the inverse of eigenvalues
λ eigenvalue of covariance matrix
Φ(·) nonlinear mapping function
X process sample set
REFERENCES
1 Lee, J., Kang, B., Kang, S.H., “Integrating independent component analysis and local outlier factor for plant-wide process monitoring”, J. Process Control, 21 (7), 1011-1021 (2011).
2 Li, Y.F., Wang, Z.F., Yuan, J.Q., “On-line fault detection using SVM-based dynamic MPLS for batch processes”, Chin. J. Chem. Eng., 14 (6), 754-758 (2006).
3 Liu, X.Q., Xie, L., Kruger, U., Littler, T., Wang, S.Q., “Statistical-based monitoring of multivariate non-Gaussian systems”, AIChE J., 54 (9), 2379-2391 (2008).
4 MacGregor, J., Kourti, T., “Statistical process control of multivariate processes”, Control Eng. Pract., 3 (3), 403-414 (1995).
5 Zhang, G.X., An Introduction to The New Multivariate Diagnosis Theory with Two Kinds of Quality, Science Press, Bei Jing, China (2001).
6 Dong, D., McAvoy, T.J., “Nonlinear principal component analysis-based on principal curves and neural networks”, Comput. Chem. Eng., 20 (1), 65-78 (1996).
7 Kresta, J.V., Macgregor, J.F., Marlin, T.E., “Multivariate statistical monitoring of process operating performance”, Can. J. Chem. Eng., 69 (1), 35-47 (2009).
8 Wachs, A., Lewin, D.R., “Improved PCA methods for process disturbance and failure identification”, AIChE J., 45 (8), 1688-1700 (2004).
9 Kramer, M.A., “Nonlinear principal component analysis using autoassociative neural networks”, AIChE J., 37 (2), 233-243 (1991).
10 Cui, P., Li, J., Wang, G., “Improved kernel principal component analysis for fault detection”, Expert Syst. Appl., 34 (2), 1210-1219 (2008).
11 Jia, F., Martin, E., Morris, A., “Non-linear principal components analysis with application to process fault detection”, Int. J. Sys. Sci., 31 (11), 1473-1487 (2000).
12 Jia, M., Chu, F., Wang, F., Wang, W., “On-line batch process monitoring using batch dynamic kernel principal component analysis”, Chemom. Intell. Lab. Syst., 101 (2), 110-122 (2010).
13 Ku, W., Storer, R.H., Georgakis, C., “Disturbance detection and isolation by dynamic principal component analysis”, Chemom. Intell. Lab. Syst., 30 (1), 179-196 (1995).
14 Li, R., Rong, G., “Fault isolation by partial dynamic principal component analysis in dynamic process”, Chin. J. Chem. Eng., 14 (4), 486-493 (2006).
15 Xie, L., Zhang, J., Wang, S., “Investigation of dynamic multivariate chemical process monitoring”, Chin. J. Chem. Eng., 14 (5), 559-568 (2006).
16 Chen, T., Martin, E., Montague, G., “Robust probabilistic PCA with missing data and contribution analysis for outlier detection”, Comput. Stat. Data An., 53 (10), 3706-3716 (2009).
17 Kim, D., Lee, I.B., “Process monitoring based on probabilistic PCA”,Chemom. Intell. Lab. Syst., 67 (2), 109-123 (2003).
18 Lee, J.M., Yoo, C.K., Lee, I.B., “Fault detection of batch processes using multiway kernel principal component analysis”, Comput. Chem. Eng., 28 (9), 1837-1847 (2004).
19 Wang, Z.F., Yuan, J.Q., “Online supervision of penicillin cultivations based on rolling MPCA”, Chin. J. Chem. Eng., 15 (1), 92-96 (2007).
20 Choi, S.W., Lee, C., Lee, J.M., Park, J.H., Lee, I.B., “Fault detection and identification of nonlinear processes based on kernel PCA”, Chemom. Intell. Lab. Syst., 75 (1), 55-67 (2005).
21 Nguyen, V.H., Golinval, J.C., “Fault detection based on Kernel principal component analysis”, Eng. Struct., 32 (11), 3683-3691 (2010).
22 Schölkopf, B., Smola, A., Müller, K.R., “Nonlinear component analysis as a kernel eigenvalue problem”, Neural comput., 10 (5), 1299-1319 (1998).
23 Haykin, S., Neural Networks., Practice-Hall Press, New Jersey, U.S.A. (1999).
24 Lee, J.M., Yoo, C.K., Choi, S.W., Vanrolleghem, P.A., Lee, I.B.,“Nonlinear process monitoring using kernel principal component analysis”, Chem. Eng. Sci., 59 (1), 223-234 (2004).
25 Romdhani, S., Gong, S., Psarrou, A., “A multi-view nonlinear active shape model using kernel PCA”, In: British Machine Vision Conference, Nottingham, U.K. (1999).
26 Webb, A.R., Statistical Pattern Recognition, Oxford University Press, New York, U.S.A. (1999).
27 Read, C.B., Kotz, S., Johnson, N.L., Encyclopedia of Statistical Sciences, Wiley, Germany (1988).
28 Downs, J.J., Vogel, E.F., “A plant-wide industrial process control problem”, Comput. Chem. Eng., 17 (3), 245-255 (1993).
29 Lyman, P.R., Georgakis, C., “Plant-wide control of the Tennessee Eastman problem”, Comput. Chem. Eng., 19 (3), 321-331 (1995).
30 McAvoy, T., Ye, N., “Base control for the Tennessee Eastman problem”, Comput. Chem. Eng., 18 (5), 383-413 (1994).
2011-11-29, accepted 2012-08-30.
* Supported by the 973 project of China (2013CB733600), the National Natural Science Foundation (21176073), the Doctoral Fund of Ministry of Education (20090074110005), the New Century Excellent Talents in University (NCET-09-0346), “Shu Guang”project (09SG29) and the Fundamental Research Funds for the Central Universities.
** To whom correspondence should be addressed. E-mail: xfyan@ecust.edu.cn
杂志排行

Chinese Journal of Chemical Engineering的其它文章
- Preparation of Mesoporous Carbons from Acrylonitrile-methyl Methacrylate Copolymer/Silica Nanocomposites Synthesized by in-situ Emulsion Polymerization*
- Immobilization of Papain in Biosilica Matrix and Its Catalytic Property*
- Comparison on Thermal Conductivity and Permeability of Granular and Consolidated Activated Carbon for Refrigeration*
- Effect of Hydrogen Reduction of Silver Ions on the Performance and Structure of New Solid Polymer Electrolyte PEI/Pebax2533/AgBF4Composite Membranes*
- Synthesis of 2-Methyl-4-methoxyaniline from o-Nitrotoluene Using Pt/C and Acidic Ionic Liquid as Catalyst System*
- Adsorption and Desorption Behavior of Tannic Acid in Aqueous Solution on Polyaniline Adsorbent*