Modelling-based Optimisation of the Direct Synthesis of Dimethyl Ether from Syngas in a Commercial Slurry Reactor
2013-06-07SadeghPapariMohammadKazemeiniandMoslemFattahi
Sadegh Papari, Mohammad Kazemeini* and Moslem Fattahi
Department of Chemical and Petroleum Engineering, Sharif University of Technology, Azadi Avenue 11365-9465, Tehran, Iran
Modelling-based Optimisation of the Direct Synthesis of Dimethyl Ether from Syngas in a Commercial Slurry Reactor
Sadegh Papari, Mohammad Kazemeini* and Moslem Fattahi
Department of Chemical and Petroleum Engineering, Sharif University of Technology, Azadi Avenue 11365-9465, Tehran, Iran
In the present study, we developed a multi-component one-dimensional mathematical model for simulation and optimisation of a commercial catalytic slurry reactor for the direct synthesis of dimethyl ether (DME) from syngas and CO2, operating in a churn-turbulent regime. DME productivity and CO conversion were optimised by tuning operating conditions, such as superficial gas velocity, catalyst concentration, catalyst mass over molar gas flow rate (W/F), syngas composition, pressure and temperature. Reactor modelling was accomplished utilising mass balance, global kinetic models and heterogeneous hydrodynamics. In the heterogeneous flow regime, gas was distributed into two bubble phases: small and large. Simulation results were validated using data obtained from a pilot plant. The developed model is also applicable for the design of large-scale slurry reactors.
modelling, slurry bubble column, optimisation, dimethyl ether synthesis, two-bubble phases
1 INTRODUCTION
Dimethyl ether (DME) has been called a “green fuel” for the twenty-first century, and is a new liquid fuel which contains 34.78% oxygenates. Currently, production of liquid fuel from coal and natural gas is becoming increasingly important, because of environmental and energy supply problems. DME is used by the petrochemical industry in the production of methyl sulphate and methyl acetate, and as an intermediate in the production of light olefins, such as propylene and ethylene [1-4]. In addition, DME has been suggested as a replacement for chloroform in sprays, which has been associated with environmental problems, such as ozone layer destruction [5]. DME has a wide-range of applications, including as liquefied petroleum gas (LPG) substitute, transportation fuel, propellant, chemical feedstock and fuel cell fuel [6]. Power generation by 1.25 m3of DME is equivalent to that obtained from 1 m3of LPG or diesel fuel [7].
DME is commonly synthesised using one of two methods: indirect DME synthesis (double-stage process) or the single-stage method. In indirect DME synthesis, methanol is produced first and then converted to DME. In the newer single-stage method, DME is synthesised via direct syngas conversion using a bi-functional catalyst. The main advantage of the single-stage method over the double-stage process is that the CO transformation rate is higher, due to the use of simultaneous reactions. Reactions associated with the single-stage process for DME production may be divided into the following steps:
(1) Methanol synthesis:

(2) Methanol dehydration:

(3) Water gas-shift:

(4) Carbon dioxide hydrogenation:

Syngas to DME conversion is easier and more efficient in a simple slurry reactor, which enables: (1) maintenance of a uniform temperature throughout the reactor, which is important for highly exothermic reactions; (2) easy addition and removal of catalyst to the reaction medium; and (3) good temperature control, which prevents catalyst sintering [8]. Although a 100 t·d−1slurry pilot plant was built in Japan in 2007, no commercial-scale syngas to DME conversion has been reported to date [9]. Therefore, modeling of bubble column slurry reactors to be utilized as a design tool towards performing such a goal might be very important.
Currently, DME is commercially prepared by dehydration of methanol using acidic porous catalysts, such as zeolite, silica-alumina and alumina. Recently, a technique known as the synthesis gas to dimethyl ether (STD) process was developed for the direct synthesis of DME from synthesis gas, using a single reactor over a bi-functional catalyst [10]. The most commonly reported bi-functional catalysts for the STD process are mixtures of methanol synthesis catalyst and solid acid catalyst [11]. In particular, H-ZSM-5 and γ-Al2O3catalysts have been extensively studied for both academic and commercial purposes [12]. In fact, H-ZSM-5 iscurrently the best available methanol dehydration catalyst for the STD process, because of its large number of moderate strength Brønsted acid sites [13-15].
In 1966, Lee presented a general solution for solving nonlinear partial differential equations in packed bed reactors for isothermal and adiabatic operations, using Newton-Raphson numerical techniques [16]. Subsequently, Cresswell and Paterson developed a one-dimensional (1D) model for a gas-solid reaction system, and succeeded in obtaining an analytical solution [17]. Using these early works as a foundation, Eslamloueyan et al. simulated the methanol fixed-bed reactor as heterogeneous 1D and 2D systems [18] and Balakotaiah et al. investigated the temperature and concentration gradients in axial and radial directions for an adiabatic packed bed reactor [19]. More recently, Shahrokhi et al. simulated the dynamic behaviour of a fixed-bed reactor for methanol production, and proposed that the system could be optimised by maximising the production rate [20]. However, to date, no industrialscale DME direct synthesis reactor has been tested. Thus, the literature on the simulation and design of industrial DME synthesis reactors is very limited.
Therefore, in the present study, we developed a mathematical model utilising mass conservation, global kinetic models and two-class gas bubble hydrodynamics, for a large-scale slurry reactor. Using this model, optimum values of superficial gas velocity, catalyst mass over molar gas flow rate (W/F), syngas composition, catalyst concentration, temperature and pressure were obtained.
Ultimately, a well-mixed model developed in a previous study done by Chen et al. [8] for direct synthesis of the DME employed considerably fewer details than the present study. This made the former investigation somewhat vague from the industrial point of view. From this angle, the present model of the two bubble classes for gas phase (i.e., small and large bubble flows) might be considered as a more precise work including dynamic details of the system undertaken. In this sense, the current modeling and analysis of commercial slurry bubble column reactors for the DME synthesis is worthwhile. The major goal of the current work was to develop a mathematical model which had more accuracy for behavioural prediction of large scale industrial reactors. Moreover, some details, including (1) dividing the gas into two classes of bubble phases and (2) reduction in the gas volume fraction along the reactor due to its consumption, were accounted for on industrial scale in this study. The effect of operating parameters [e.g., temperature, pressure, superficial gas velocity, catalyst concentration, feed gas concentration and weight hourly space velocity (WHSV)], known as the key factors in design of an industrial plant, were considered.
2 REACT OR MODELLING
2.1 Hydrodynamics
In the homogeneous flow regime, gas was purged into the slurry phase of the column through a gas distributer, resulting in the formation of small bubbles (1-7 mm in diameter). With increasing gas velocity, the small bubbles combined to form larger bubbles (20-70 mm in diameter) resulting in a heterogeneous regime. Previous research showed that these larger bubbles tend to climb up and carry the slurry mixture to the centre of the reactor [21]. At the top of the column, the bubbles exit the reactor and the slurry phase is then re-circulated. Krishna et al. [22] suggested that for a large-scale slurry reactor with axial dispersion coefficient DAX=10 m2·s−1(D=7 m and U=0.35 m·s−1), small bubbles with slurry may be considered to be a single, well-mixed phase. A schematic representation of a slurry bubble column reactor, which is divided into three separate phases, is shown in Fig. 1. As can be seen, superficial gas velocity from the bottom of the reactor to the top is not constant, because reactants and gaseous products continuously transfer between the gas stream and the slurry phase. By defining a gas volume contraction factor and overall syngas conversion, the superficial gas velocity can be calculated along the column as follows:

where αCis the gas volume contraction factor. Although αCshould be calculated from experimental data, it may also be obtained from reference values published by Krishna and Sie [22] and Levenspiel [23]. For the present study, a constant value, αC=−0.525, was assumed.
2.2 Mathematical modelling
In order to model large-scale bubble column slurry reactors, three phases were considered: large bubbles, small bubbles and the slurry phase. As indicated in Fig. 1, the large bubbles passed from near the centre of the column were considered to be in the plug flow, whereas the slurry phase, including the liquid paraffin, suspended catalyst and the entrained small bubbles, were assumed to be in the perfectly mixed region. In the present study, energy balance was ignored because the temperature of the slurry reactor (which utilises cooling water tubes) was postulated to be constant. This assumption is in agreement with experimental data reported for a pilot plant by Yagi et al. [24] and Ogawa et al [25]. The fundamental equations and simplifying assumptions utilised in the present model were derived based upon the mass balance made over an elemental volume. In developed equations of this model yLB, ySBand xLwere taken to be functions of z and τ while uLBwas only thought to be a function of z.
Mass balance for each phase is as follows:
Large bubbles:


Small bubbles:

Slurry phase:

based upon the following dimensionless parameters:

The boundary conditions at z=0 include:


and the initial conditions at t=0, and all 0<z<L were as follows:

Gas hold-up and volumetric mass transfer coefficients were similar to those reported in Refs. [22, 26]. The void fractions in two zones were taken to be functions of z because the gas volume decreased with z while the gas density was taken to be a function of z calculated as follows:

For small bubbles, the gas hold-up is given by


Since the total gas flow is split into two streams (large and small bubbles), the summation of QLBand QSBequals to Qgas, and the cross sectional areas for both large and small bubbles do not change, the following equation might be obtained:

This assumption is also found in other papers available in the open literature [22]
Ultimately, the total gas holdup can be calculated from

Volumetric mass transfer coefficients for large and small bubbles were as follows [27]:

where Dref=2×10⁻⁹m2·s−1and the diffusion coefficient Djcan be calculated from Ref. [28].
2.3 Kinetics
Reaction rates for one-stage DME synthesis using commercial Cu-based methanol synthesis C301 and a γ-alumina catalyst were taken from Guo et al [29]. In their study, CO hydrogenation, water gas shift reaction and methanol dehydration were chosen as the main reactions, and online gas chromatography analysis showed that water content in the exit stream was very low. Therefore, based on these results, water gas shift reaction was assumed to have reached equilibrium. In addition, water partial pressure can be obtained from the following equation:

The reaction rate for methanol synthesis can be calculated by

and the reaction rate of methanol dehydration was

where ki=k0exp(−E0/RT ) and k0(Arrhenius constant) and E0(activation energy) are listed in Table 1.
The catalyst of Ref. [29], whose kinetics was utilized in the present study, was also a mixture of the Cu-based C301 and gamma-alumina, whereas the catalysts utilized in the industrial plant are usually a physical mixture of CuO, ZnO and Al2O3. The Guo et al.’s [29] kinetic model was found in the best agreement with experimental data from the literature when used in the present study, in particular as Refs. [24, 25] didn’t disclose the used catalyst and relevant kinetics.

Table 1 Arrhenius constant and activation energy of the global kinetic model [29]
2.4 Gas solubility
The solubility of syngas, CO2, methanol, water and dimethyl ether in the liquid phase were obtainedusing Henry’s law [30, 31]:

Values for constants a and b for each component are listed in Table 2. The value of Hjfor prediction ofjP∗was as follows:

Table 2 Parameters for Henry’s constant
3 RESUL TS AND DISCUSSION
3.1 Numerical methods and validation
All differential equations based upon material balances, hydrodynamics and kinetics for all components were solved numerically using MATLAB software 2010a. The resulting equations were solved numerically by a partial substitution finite difference method using appropriate initial and boundary conditions. The consequent model was solved by an in house developed numerical code in the MATLAB software. The summary of solution flowchart was presented in Fig. 2. The time-dependent solution of Eqs. (6)-(8) was achieved numerically till the steady state reached. It is noted that for each simulation job, several fixed dimensional and dimensionless parameters including, yLB0, ySB0, xL0, uL0, uSB0, uLB0, (kla)SB,j, (kla)LB,jand H were specified beforehand through Eqs. (20)-(25), (35), (36) and (40) respectively; other variable parameters used in the model were indicated in the captions of figures to be discussed later.
Operating conditions for the simulation are listed in Table 3. For model validation, simulation results were compared with previously published experimental data of pilot plant [24, 25] (see Table 4). The catalyst with the size of 10 μm was utilized. It was a physically mixed catalyst containing CuO, ZnO and Al2O3[24]. Moreover, three reactor scenarios (denoted by A, B and C) were simulated in this research. Major parameters of the simulated pilot plant A [24], reactor B [25] and key parameters of the simulated pilot plant of the current work (denoted by C) were included in Table 3. The confirmation and validation of the simulation results obtained presently were checked against experimental data of reactors A and B. The predictions of concentration simulation profiles, however, were based upon the scenario for the commercial reactor C. As indicated, the slurry reactor C was discretized into 500 elemental control volumes with axial length of 10 cm and a time step of 1.2 s.
Based upon Ref. [25], a commercial scale production of 3000 t·d−1might have been realized by a single reactor with diameter of 7 m and height of 50 m. In the Scenario C of the present study, this single rector was simulated re-confirming applicability of this simulation for an industrial pilot plant.
The gas feed was split into small and large bubbles based upon gas hold up empirical correlation provided by Krishna and Sie [22]. The best and most famous correlations for the mass transfer coefficient as well as gas volume fraction were all chosen from this reference. Moreover, it was previously demonstrated how effects of the gas bubble diameters were incorporated into the equations.
From the theoretical point of view, the tiny bubbles were usually formed at the reactor entrance region. With increasing the gas velocity, such bubbles coalesced with each other to form larger ones. The amounts and distributions of small and large bubbles were based upon the overall gas hold up of bubbles formed along the reactor and determined through Eqs. (30) and (31).

Table 3 Operating conditions

Figure 2 Flowchart diagram of solution
For modeling of the slurry reactors the semi-batch and continuous approaches are commonly used. In this study the former approach was undertaken. In this regard, the gas phase considered continuous passing through the slurry which in turn considered as a batch phase. As such, the liquid velocity and composition were set equal to zero, as in the pilot tests reported in Refs. [24, 25]. The reactor effluent contained DME, CO2as well as the unreacted synthesis gas, all in gaseous state, at the reactor outlet and separated easily from the slurry phase.
To test the suitability of the grid for numerical solution, originally the commercial reactor length was divided into 500 control volumes, each of which was 10 cm long. Then, the simulation was repeated utilizing smaller control volumes of 2 cm length. However, no changes in accuracy of results were observed. This meant that the simulations performed with 500 control volumes were grid-independent. It is worth mentioning that a similar approach for validation of grid independencies in A and B scenarios were also utilized. Nonetheless, to provide a more precise confirmationof the present simulation with experimental data, the parity plot of Fig. 3 was provided. It is observed that the average relative deviations (ARD) between the theoretical and experimental data were 8.5% and 7.0% for CO conversion and DME production; respectively.

Figure 3 A comparison between two-bubble classes with the experimental pilot plant A data(conditions: D=2.3 m, L=22 m, T=260 °C, P=5.0 MPa, εS=0.3)
It is noteworthy that in general, diameter or height change results in that of catalyst weight, and subsequently in that of the DME production and CO conversion. However, in the present study the catalyst weight was kept constant while the reactor aspect (i.e., height/diameter known as H/D) ratio was changed. Thus, the H/D ratio imposed no significant effect upon the aforementioned outlet values, especially for a one-dimensional model.
3.2 Superficial gas velocity along the reactor
In the rest of the paper, the validated numerical program is utilized to simulate a commercial scale reactor C and analyze the operation details. After validation, the model was used to optimise the effective parameters of DME production and CO conversion, including: superficial gas velocity, W/F, catalyst concentration, inlet syngas ratio, temperature and pressure.
Figure 4 shows the variation in superficial gas velocity, which is a linear function of the overall syngas conversion along the reactor height. The reason for the apparent decrease in superficial gas velocity is the negative volume contraction factor, which results in a decrease in the volume of gas as it passes through the slurry phase. αCis a feed concentration dependent parameter, and for different inlet syngas ratios was assumed to be between −0.4 to −0.6.
In addition, to give a more complete picture of the solution, the component concentrations profiles as a function of the reactor height were presented in Fig. 5. It is observed that the conversions of CO and H2are incomplete. The conversion for the syngas in one pass for the initial gas velocities of 0.3, 0.25 and 0.2 m·s−1, were determined to be 60.32%, 64.76 and 66.67 respectively by the present model.

Figure 4 Reduction of superficial gas velocity as a function of reactor height(conditions: reactor C, D=7 m, L=50 m, T=260 °C, P=5.0 MPa, εS=0.3, f=1.75)Ug0=0.3; Ug0=0.25; Ug0=0.20

Figure 5 The mole fraction profiles of components(conditions: reactor C, D=7 m, L=50 m, T=260 °C, P=5.0 MPa, εS=0.3, Ug0=0.2 m·s−1, f=1.75) yco;2Hy; yMeOH; yDME
3.3 Effect of reaction temperature and pressures
The variation of CO conversion and DME productivity as a function of temperature and pressure is illustrated in Fig. 6. As can be seen, CO conversion and DME productivity increases with increasing temperature, in agreement with data available in the literature [32]. In addition, increased temperature has a positive effect on syngas solubility in liquid paraffin, and improves the volumetric mass transfer coefficient [33], while accelerating methanol synthesis and dehydration rates. However, the apparent improvements associated with increased temperature had certain limitations. For example, at temperature above 280 °C,sintering phenomenon occurs, resulting in reduced catalyst activity [29]. Moreover, methanol synthesis and dehydration reactions are exothermic. Therefore, the optimum temperature for single-stage DME synthesis was found to be 260 °C. As can be seen in Fig. 6, increased pressure also strongly affects CO conversion and DME productivity, again in agreement with the literature [34]. Specifically, at a constant temperature of 260 °C, increasing the pressure from 4.0 to 6.0 MPa resulted in an increase in CO conversion from 61.17% to 82.83%, and an increase in DME productivity from 2879.8 to 3910.9 t·d−1. This may be due to the fact that methanol synthesis is the rate limiting step (RLS) in the overall reaction, was observed previously [35]. Because the stoichiometry of methanol synthesis is mole-number reducing, water gas shift and methanol dehydration have the same number of moles on both sides of the reaction. Thus, increasing pressure had no affect on these reactions. However, increasing pressure did lead to an increased volumetric mass transfer coefficient as the bubble size would decrease, and consequently mass transfer resistance in the slurry phase is reduced [33]. Although increased pressure was associated with increased CO conversion and DME productivity, reactions at high pressures is limited by high operating costs. Therefore, a pressure of 5.0 MPa is recommended as the operating pressure for DME synthesis.

Figure 6 Effect of temperature and pressure on CO conversion and DME productivity(conditions: reactor C, D=7 m, L=50 m, Ug0=0.2 m·s−1, UL0=0 m·s−1, εS=0.3, f=1.75)P=4.0 MPa; P=5.0 MPa; P=6.0 MPa
3.4 Effect of superficial gas ve locity and catalyst concentration
CO conversion and DME productivity as a function of superficial gas velocity for different catalyst concentrations (i.e., mass fraction of catalyst in a gas free slurry volume) is shown in Fig. 7. Since increased superficial gas velocity led to decreased mass transfer and mean residence time, the simulation results indicate that the influence of mean residence time on CO conversion and DME production is greater than that of the mass transfer coefficient. At higher gas velocities, CO conversion was reduced, because there was not enough time for syngas to diffuse into the slurry phase and reach the catalyst surface. In contrary, DME production increased with increasing superficial velocity at higher catalyst concentration, due to the enhanced flow rate of the entering syngas to the column. DME productivity decreased at higher velocity due to the decrease in CO conversion in low catalyst concentration. Taking both of these effects into consideration, the optimum superficial gas velocity was found to be 0.2 m·s−1, which led to acceptable CO conversion and DME product yield. Upon further examination of Fig. 6, it can be seen that at low gas velocities, CO conversion and DME productivity converge to a specific value for different catalyst concentrations. This may be due to the high residence time of gas at the low superficial velocities at which the CO conversion reached equilibrium.

Figure 7 Effect of superficial gas velocity and catalyst concentration on CO conversion and DME productivity(conditions: reactor C, D=7 m, L=50 m, T=260 °C, P=5.0 MPa, f=1.75) εS=0.3; εS=0.2; εS=0.4
3.5 Effect of feed gas composition and W/F ratio
The optimum f=(H2−CO2)/(CO+CO2) ratios for different W/F (the ratio of the catalyst mass to inlet mass flow rate) ratios are shown in Fig. 8. Guo et al. demonstrated experimentally that high CO2content in the inlet syngas feed has an unfavourable effect on COconversion [29]. Specifically, CO2molecules were adsorbed on the methanol synthesis catalyst and occupied its active sites quicker than CO and H2, resulting in reduced methanol production. In addition, because of the increased water partial pressure during the water gas shift equilibrium reaction, CO2content should be kept at a minimum. In turn, higher water partial pressures decrease DME production, because it is strongly adsorbed by the γ-alumina catalyst [29]. Taking the above into consideration, the inlet CO2composition was held constant at approximately 1.5% (by mole). Using this value, H2and CO inlet compositions were varied to obtain the best syngas ratio, which should be a number between 1 and 2. At syngas ratios below 1, by-products such as CO2and hydrocarbons form, and DME selectivity is reduced. On the other hand, if the syngas ratio exceeds 2, coke deposition on the catalyst surface occurs, possibly leading to catalyst deactivation [36]. CO conversion is enhanced at f=1.75, while DME productivity remains constant. Therefore, the optimum ratio for f was selected to be 1.75. Using these conditions, coupled with a catalyst concentration of 0.4% (by mass), column pressure of 5.0 MPa and reactor temperature of 260 °C, a CO conversion of 69.8% and DME productivity of 5.338×10⁶kg·d−1is predicted. Based on these results the optimum ratio for the mass of catalyst to inlet molar flow rate (W/F) was determined to be 5. W/F ratios lower than 5 were associated with higher superficial gas velocities, and thus lower contact times between the reactants and catalyst, resulting in decreased reaction conversion. Furthermore, although W/F ratios greater than 5 resulted in improved reaction conversion, DME productivity decreased due to the low inlet syngas flow rate.
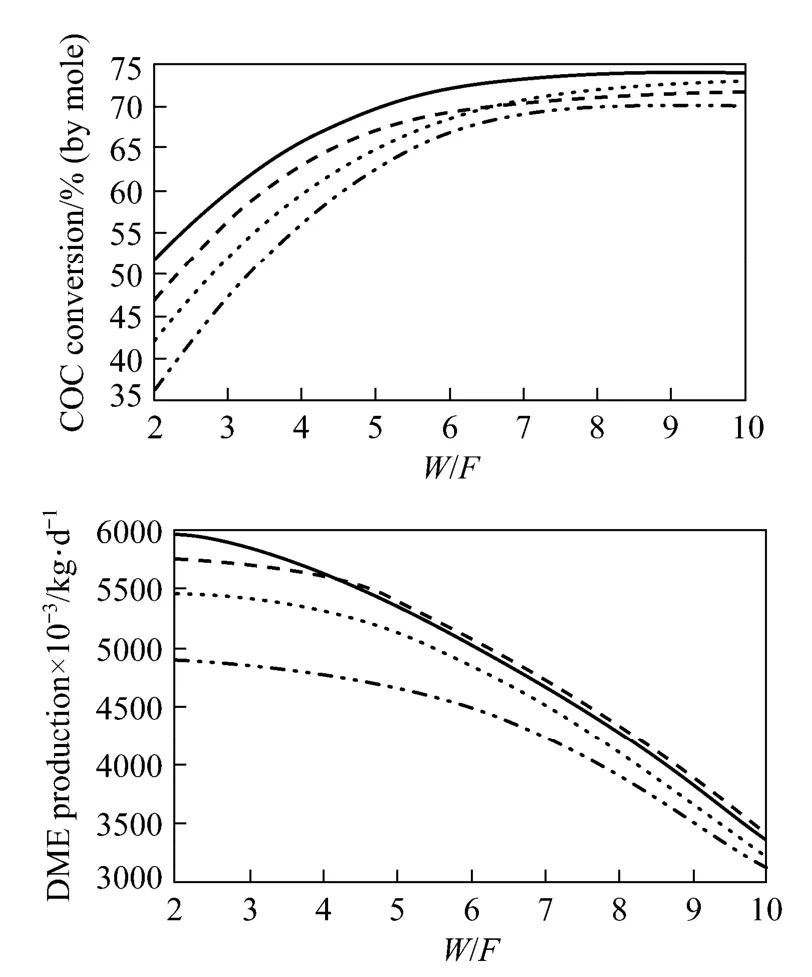
Figure 8 Effect of syngas composition and W/F on CO conversion and DM E pr oductivity(conditions: reactor C, D=7 m, L=50 m, T=260 °C, P=5.0 MPa, εS=0.4)f=1.25; f=1.5; f=1.75; f=2
4 CONCLU SIONS
In the present study, a mathematical model was adopted for simulation of DME synthesis in a commercial-scale slurry bubble column reactor. Methanol synthesis, water gas shift and methanol dehydration were included as the principle reactions. The reactor was operated under a churn-turbulent flow regime, including small and large bubble flow. The proposed model predicted CO conversion and DME productivity for a commercial-scale slurry reactor as a function of operating parameters. In this study, the parameters required for optimisation and prediction of DME bubble column reactors were determined. Results obtained for the conversion of syngas to DME indicated that space velocity was the most significant parameter in the slurry bubble column reactor. It is a foregone conclusion that the present model provided more dynamic details so that the present numerical results would help in the design of large-scale bubble column slurry reactors for the DME synthesis. Ultimately, this model might have paved down the road for up-scaling of such processes.
NOMENCLATURE
CLB,jmolar concentration of j component in large bubble phase, mol·m−3
Cj,Nmolar concentration of j component in Nth iteration, mol·m−3
CSB,jmolar concentration of j component in small bubble phase, mol·m−3
D reactor diameter, m
Djdiffusion coefficient, m2·s−1
f feed composition molar ratio
H Henry’s coefficient, Pa·m3·mol−1
(kla)LBvolumetric mass transfer coefficient for large bubble, s−1
(kla)SBvolumetric mass transfer coefficient for small bubble, s−1
k1rate constant of methanol synthesis
k2rate constant of methanol dehydration
KCO2adsorption constant of CO2on the methanol synthesis catalyst
Kmadsorption constant of methanol on the methanol dehydration catalyst
KP,WGSequilibrium constant of water-gas shift reaction
KWadsorption constant of water on the methanol dehydration catalyst
L reactor height, m
mjdimensionless Henry’s coefficient
MCat.mass of catalyst, kg
Mwmolecular weight, g·mol−1
Nrnumber of involved reactions
PCOpartial pressure of CO, MPa
PH2partial pressure of H2, MPa
PCO2partial pressure of CO2, MPa
PMpartial pressure of methanol, MPa
PWpartial pressure of water, MPa
P operating pressure, MPa
rirate of reaction, mmol·g−1·h−1
r1methanol productivity, mmol·g−1·h−1
r2DME productivity, mmol·g−1·h−1
R gas constant, J·mol−1·K−1
(St)LB,jStanton number in large bubbles
(St)SB,jStanton number in small bubbles
T reaction temperature, K
t time, s
u dimensionless superficial velocity
ULBsuperficial velocity of large bubbles phase, m·s−1
ULB0inlet superficial velocity of large bubble phase, m·s−1
USBsuperficial velocity of small bubbles phase, m·s−1
USB0inlet superficial velocity of small bubble phase, m·s−1
Ugsuperficial gas velocity, m·s−1
Ug0inlet superficial gas velocity, m·s−1
ULsuperficial liquid velocity, m·s−1
UL0inlet superficial liquid velocity, m·s−1
Vrefrise velocity of the small bubbles at 0 solid concentration,
SB
m·s−1
W/F catalyst mass over molar gas flow rate, g·h·mol−1
XCO+H2overall syngas conversion
xL∗
Bequilibrium molar composition in liquid large bubbles
yL∗
Bequilibrium molar composition in large bubbles
yLB,jmolar composition in large bubbles
yS∗B equilibrium molar composition in small bubbles
ySB,jmolar composition in small bubbles
Z axial coordinate, m
αCgas volume contraction factor
εrefgas hold-up of the “dense phase” at 0 solids concentration
df
εGtotal gas holdup
εLBlarge bubbles gas holdup
εSsolid concentration
εSBsmall bubbles gas holdup
ρggas phase density, kg·m−3
υijstoichiometric coefficient of component j involved in chemical reaction i
τ residence time
Superscript
∗ indicate equilibrium value
Subscript
0 indicate initial value
g gas phase
L liquid phase
LB large bubble
SB small bubble
t indicate the time
REFERENCES
1 Ge, Q.J., Huang, Y.M., Qiu, F.Y., Li, S.B., “Bifunctional catalysts for conversion of synthesis gas to dimethyl ether”, Appl. Catal. A Gen., 167, 23-30 (1998).
2 Han, Y.Y., Zhang, H.T., Ying, W.Y., Fang, D.Y., “Modeling and simulation of production process on dimethyl ether synthesized from coal-based syngas by one-step method”, Chin. J. Chem. Eng., 17 (1), 108-112 (2009).
3 Khandan, N., Kazemeini, M., Aghaziarati, M., “Determining an optimum catalyst for liquid-phase dehydration of methanol to dimethyl ether”, Appl. Catal. A Gen., 349, 6-12 (2008).
4 Khandan, N., Kazemeini, M., Aghaziarati, M., “Synthesis of dimethyl ether over modified h-mordenite zeolites and bifunctional catalysts composed of Cu/ZnO/ZrO2and modified h-mordenite zeolite in slurry phase”, Catal. Lett., 129, 111-118 (2009).
5 Kang, S.H., Bae, J.W., Jun, K.W., Potdar, H.S., “Dimethyl ether synthesis from syngas over the composite catalysts of Cu-ZnO-Al2O3/ Zr-modified zeolites”, Catal. Commun., 9, 2035-2039 (2008).
6 Farsi, M., Eslamloueyan, R., Jahanmiri, A., “Modeling, simulation and control of dimethyl ether synthesis in an industrial fixed-bed reactor”, Chem. Eng. Process., 50, 85-94 (2011).
7 Varisli, D., Dogu, T., “Production of clean transportation fuel dimethyl ether by dehydration of methanol over Nafion catalyst”, G.U. J. Sci., 21, 37-41 (2008).
8 Chen, Z., Zhang, H.T., Ying, W.Y., Fang, D.Y., “Study on direct alcohol/ether fuel synthesis process in bubble column slurry reactor”, Front. Chem. Eng. Chin., 4, 461-471 (2010).
9 Liu, D.H., Hua, X., Fang, D.Y., “Mathematical simulation and design of three-phase bubble column reactor for direct synthesis of dimethyl ether from syngas”, J. Nat. Gas Chem., 16, 193-199 (2007).
10 Brown, D.M., Bhatt, B.L., Hsiung, T.H., Lewnard, J.J., Waller, F.J.,“Novel technology for the synthesis of dimethyl ether from syngas”, Catal. Today, 8, 279-304 (1991).
11 Xia, J.C., Mao, D.S., Zhang, B., Chen, Q.L., Tang, Y., “One-step synthesis of dimethyl ether from syngas with Fe-modified zeolite ZSM-5 as dehydration catalyst”, Catal. Lett., 98, 235-240 (2004).
12 Fu, Y.C., Hong, T., Chen, J.P., Auroux, A., Shen, J.Y., “Surface acidity and the dehydration of methanol to dimethyl ether”, Thermochim. Acta, 434, 22-26 (2005).
13 Takeguchi, T., Yanagisawa, K.i., Inui, T., Inoue, M., “Effect of the property of solid acid upon syngas-to-dimethyl ether conversion on the hybrid catalysts composed of Cu-Zn-Ga and solid acids”, Appl. Catal. A Gen., 192, 201-209 (2000).
14 Yaripour, F., Baghaei, F., Schmidt, I., Perregaard, J., “Catalytic dehydration of methanol to dimethyl ether (DME) over solid-acid catalysts”, Catal. Commun., 6, 147-152 (2005).
15 Moradi, G.R., Ghanei, R., Yaripour, F., “Determination of the optimum operating conditions for direct synthesis of dimethyl ether from syngas”, Int. J. Chem. Reactor Eng., 5, A14 (2007).
16 Lee, E.S., “A generalized Newton-Raphson method for nonlinear partial differential equations-packed-bed reactors with axial mixing”, Chem. Eng. Sci., 21, 143-157 (1966).
17 Cresswell, D.L., Paterson, W.R., “Mathematical modelling of the exothermic packed bed reactor: Application to o-xylene partial oxidation”, Chem. Eng. Sci., 25, 1405-1414 (1970).
18 Jahanmiri, A., Eslamloueyan, R., “Optimal temperature profile in methanol synthesis reactor”, Chem. Eng. Commun., 189, 713-741 (2002).
19 Balakotaiah, V., Christoforatou, E.L., West, D.H., “Transverse concentration and temperature nonuniformities in adiabatic packed-bed catalytic reactors”, Chem. Eng. Sci., 54, 1725-1734 (1999).
20 Shahrokhi, M., Baghmisheh, G.R., “Modeling, simulation and control of a methanol synthesis fixed-bed reactor”, Chem. Eng. Sci., 60, 4275-4286 (2005).
21 Krishna, R., Ellenberger, J., “Gas holdup in bubble column reactors operating in the churn-turbulent flow regime”, AIChE J., 42, 2627-2634 (1996).
22 Krishna, R., Sie, S.T., “Design and scale-up of the Fischer-Tropsch bubble column slurry reactor”, Fuel Process. Technol., 64, 73-105 (2000).
23 Levenspiel, O., Chemical Reaction Engineering, 3rd edition, Wiley, Germany, 447-472 (1998).
24 Yagi, H., Ohno, Y., Inoue, N., Okuyama, K., Aoki, S., “Slurry phase reactor technology for DME direct synthesis”, Int. J. Chem. Reactor Eng., 8, A109 (2010).
25 Ogawa, T., Inoue, N., Shikada, T., Ohno, Y., “Direct dimethyl ether synthesis”, J. Nat. Gas Chem., 12, 219-227 (2003).
26 Maretto, C., Krishna, R., “Design and optimisation of a multi-stage bubble column slurry reactor for Fischer-Tropsch synthesis”, Catal. Today, 66, 241-248 (2001).
27 Vermeer, D.J., Krishna, R., “Hydrodynamics and mass transfer in bubble columns operating in the churn-turbulent regime”, Ind. Eng. Chem. Process Des. Dev., 20, 475-482 (1981).
28 Erkey, C., Rodden, J.B., Akgerman, A., “A correlation for predicting diffusion coefficients in alkanes”, Can. J. Chem. Eng., 68, 661-665 (1990).
29 Guo, J.W., Niu, Y.Q., Zhang, B.J., “Global kinetics study of LPDME process from syngas”, J. Nat. Gas Chem., 9, 331-342 (2000).
30 Setinc, M., Levec, J., “On the kinetics of liquid-phase methanol synthesis over commercial Cu/ZnO/Al2O3catalyst”, Chem. Eng. Sci., 54, 3577-3586 (1999).
31 Song, H.J., Zhang H.T., Ying W.Y., “Investigation on solubility and volumetric mass transfer coefficient of H2, N2, CO and CO2in liquid paraffin”, J. East Chin. Univ. Sci. Technol., 30 (5), 498-518 (2004). (in Chinese)
32 Zhao, Y.Q., Chen, J.X., Zhang, J.Y., “Effects of ZrO2on the Performance of CuO-ZnO-Al2O3/HZSM-5 Catalyst for Dimethyl Ether Synthesis from CO2Hydrogenation”, J. Nat. Gas Chem., 16, 389-392 (2007).
33 Wang, T.F., Wang, J.F., “Numerical simulations of gas-liquid mass transfer in bubble columns with a CFD-PBM coupled model”, Chem. Eng. Sci., 62, 7107-7118 (2007).
34 Nie, Z.G., Liu, H.W., Liu, D.H, Ying, W.Y., Fang, D.Y., “Intrinsic kinetics of dimethyl ether synthesis from syngas”, J. Nat. Gas Chem., 14, 22-28 (2005).
35 Moradi, G.R., Ahmadpour, J., Yaripour, F., “Intrinsic kinetics study of LPDME process from syngas over bi-functional catalyst”, Chem. Eng. J., 144, 88-95 (2008).
36 Zhu, Y.Y., Wang, S.R., Ge, X.L., Liu, Q., Luo, Z.Y., Cen, K.F., “Experimental study of improved two step synthesis for DME production”, Fuel Process. Technol., 91, 424-429 (2010).
2011-10-11, accepted 2012-06-09.
* To whom correspondence should be addressed. E-mail: kazemini@sharif.ir
杂志排行

Chinese Journal of Chemical Engineering的其它文章
- Preparation of Mesoporous Carbons from Acrylonitrile-methyl Methacrylate Copolymer/Silica Nanocomposites Synthesized by in-situ Emulsion Polymerization*
- Immobilization of Papain in Biosilica Matrix and Its Catalytic Property*
- Comparison on Thermal Conductivity and Permeability of Granular and Consolidated Activated Carbon for Refrigeration*
- Effect of Hydrogen Reduction of Silver Ions on the Performance and Structure of New Solid Polymer Electrolyte PEI/Pebax2533/AgBF4Composite Membranes*
- Synthesis of 2-Methyl-4-methoxyaniline from o-Nitrotoluene Using Pt/C and Acidic Ionic Liquid as Catalyst System*
- Adsorption and Desorption Behavior of Tannic Acid in Aqueous Solution on Polyaniline Adsorbent*