Measurement of particle size based on digital imaging technique*
2013-06-01CHENHong陈红TANGHongwu唐洪武LIUYun刘云WANGHao王浩LIUGuiping刘贵平
CHEN Hong (陈红), TANG Hong-wu (唐洪武), LIU Yun (刘云), WANG Hao (王浩), LIU Gui-ping (刘贵平)
State Key Laboratory of Hydrology-Water Resources and Hydraulic Engineering, Hohai University, Nanjing 210098, China, E-mail: chh_hhu@hhu.edu.cn
Measurement of particle size based on digital imaging technique*
CHEN Hong (陈红), TANG Hong-wu (唐洪武), LIU Yun (刘云), WANG Hao (王浩), LIU Gui-ping (刘贵平)
State Key Laboratory of Hydrology-Water Resources and Hydraulic Engineering, Hohai University, Nanjing 210098, China, E-mail: chh_hhu@hhu.edu.cn
(Received May 23, 2012, Revised August 22, 2012)
To improve the analysis methods for the measurement of the sediment particle sizes with a wide distribution and of irregular shapes, a sediment particle image measurement, an analysis system, and an extraction algorithm of the optimal threshold based on the gray histogram peak values are proposed. Recording the pixels of the sediment particles by labeling them, the algorithm can effectively separate the sediment particle images from the background images using the equivalent pixel circles with the same diameters to represent the sediment particles. Compared with the laser analyzer for the case of blue plastic sands, the measurement results of the system are shown to be reasonably similar. The errors are mainly due to the small size of the particles and the limitation of the apparatus. The measurement accuracy can be improved by increasing the Charge-Coupled Devices (CCD) camera resolution. The analysis method of the sediment particle images can provide a technical support for the rapid measurement of the sediment particle size and its distribution.
particle size, extraction algorithm of optimal threshold, equivalent circle transformation
Introduction
Recently, many methods were developed to determine the sediment particle size, including the original manual method and the automated instrumental method. These methods can be classified as the sieving method, the sedimentation method, the resistance method, the microscope method, and the laser particle sizer method. The traditional analysis methods are usually characterized by the complex operations, the low automation levels, the time-consuming operations, and the low speed. On the other hand, the laser particle sizer method has a high degree of automation, but it is not suitable for a large-scale use because of its high price and the maintenance cost. The particle size should be confined within 2 mm, otherwise, the instrument would fail to work properly. The measuring ranges of these methods are all limited. Thus, a variety of methods are usually adopted jointly to analyze a wide-gradation sediment. Due to the differences of the measuring principles and the representations of different methods, there are certain link errors, and the grading curve is not smoothly continuous.
With the development of computer technologies, the chips, Charge-Coupled Devices (CCD), and especially, the image processing technologies are widely applied in the particle analysis fields, such as in the powder, mineral, chemical and medical industries. Misirli et al.[4]and Apostolopoulos et al.[5]used the image processing technology to identify cells, and put forward the “best rounding fitting” method to measure the cell size. Souza and Menegalli[6]used the digital image processing technology to measure the particle size, and analyzed the particle morphology charcteristics. Carter et al.[7,8]developed a set of particle size measurement devices, and realized the particle sizemeasurement in pipelines. The rapid development of image processing technologies improves the measurement of the particle size, the particle morphology, and other particle parameters. The commercial particle analysis systems were successfully applied to the particle analysis fields[9,10]..However, the image technology of the sediment particle is far behind other industries. Using the digital image processing technology, Li et al.[11]obtained the representative diameter, the flat index, the triaxial shape parameters, the roundness coefficient, and other geometric parameters of pebbles, and provided a new method for the study of the mechanism of the pebble movement. As a whole, the applications in this area are quite limited, and the main reasons are as follows: (1) The sediment involves a wide range of particle sizes, the poor uniformity of the particle distribution, and various morphologies of particles, which increases the difficulty in the image processing. (2) For the sediment, not only the morphological parameters of a single particle, but also the group characteristics are important. For the analysis of sediment particles, more samples are required, and the measured results should be representative. In general, it is difficult for particle analysis systems with microscope imaging to collect enough sediment samples for analysis of sediment gradation characteristics. (3) To meet the need of a wide gradation, neither the processing accuracy nor the system automation can be satisfactory. As a result, the integration level of the system is low and the operation is complex. These facts affect the development of image processing technologies in the sediment particle field. Liu[12]developed a simple sediment particle size analysis system, but the automation level and the measurement accuracy for a small-scale sediment remain to be improved.
This study focuses on how to obtain accurate image information of wide-gradation sediment particles and to accurately measure the particle size through integrating the image acquisition device, the image processing, and the fast statistics technologies of sediment particle pixels. Based on the existing particle analysis system, a suitable system for the sediment particle image analysis is developed. Through the image acquisition device with an optimal design, a high-quality and high-stability Light Emitting Diode (LED) light source array is built, to improve the accuracy of the sediment particle projection and to avoid the submerging small-scale sediment. Based on the peak value of the gray histogram, an optimal threshold extraction algorithm is designed to improve the extraction accuracy of the wide-gradation sediment particle. Through the labeling records and the statistics of the sediment particle pixels, the processing speed and the measurement accuracy of the system are improved, and the operation process is simplified.
1. Experimental devices
The system includes the measurement point locating device, a black and white CCD camera, LED light sources, computer, and the image processing device, as shown in Fig.1. The uniform sediment particles are scattered at the measurement positions under stable LED light sources. The sediment particle images are obtained by the digital CCD camera and sent to the computer. The image information is extracted through the image processing. Finally, the pixels of the sediment particle images are transformed to equivalent pixel circles with the same diameters.
With the black and white CCD camera adopted here, the amount of image data can effectively reduced and the processing speed is improved. The resolution of the CCD chip is 1 628 × 1 236. The pixel size is 4.4 µm × 4.4 µm. The data interface is set to be 1 394, and the output is an 8-bit grayscale image. A lens with a focal length of 16 mm is used. The measurement point locating device includes four LED light source linear arrays, each of which consists of five 2 W LED lights (the power could be changed by current). The LED lights are arranged at equal distances from each other to ensure the sediment particles under a uniform and relatively stable light intensity to obtain an accurate projection of the sediment particles.
The full dispersion of the sediment particles is under an accurate measurement condition. The large particles such as the pebbles can be dispersed easily, but it is difficult to disperse small particles, which are always dispersed by artificial means. This means that a particle lap would appear, and the lap image will be determined as a single particle in the image processing.
For dispersing the sediment, a special oscillator is designed as shown in Fig.1. This oscillator includes several oscillating plates, and they are divided into four groups, numbered as O1, O2, O3and O4. Every group has two oscillating plates. The oscillation frequency and amplitude can be adjusted according to the sediment particle sizes. For a particle size of lessthan 0.1 mm, the oscillation frequency can be set at 3 Hz to 5 Hz, and the amplitude can be set at 2 mm to 5 mm. Under the action of the oscillator, the sediment particles can be fully dispersed.

Fig.1 Structure of experimental devices
2. Information extraction of sediment particles
2.1 Sediment particle image acquisition
The sediment particle images are directly related to the measurement precision of the sediment particle diameter and the analysis of the group features. The number of the sediment particles in the conventional particle image analysis methods of microscope imaging is very small, and it is difficult to obtain the group characteristics of the sediment. The ordinary lighting is a solid light source, which emits light in all directions. When the number of the sediment particles is small, the light in different directions passes through the sediment, which greatly reduces the sediment projection resolution. Thence a high light intensity is required to cover up the tiny sediment particles, and clear sediment particle images can not be obtained by a light source of low intensity. Therefore, it is necessary to adjust the light intensity according to the light resistance characteristics of the sediment for the sediment particle image acquisition.
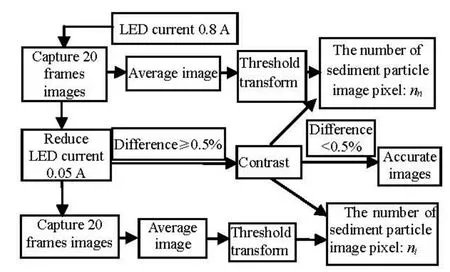
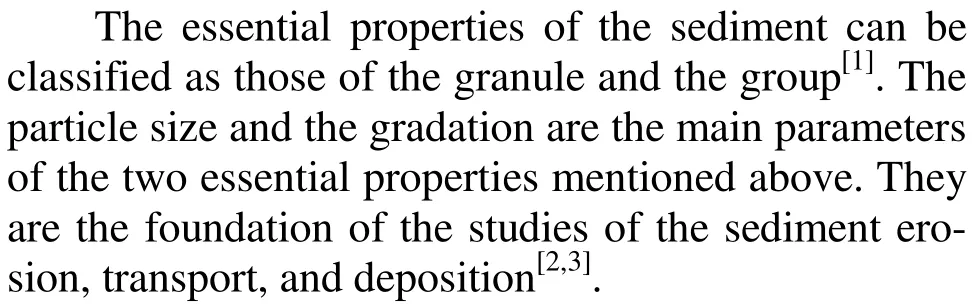
Fig.2 Image acquisition process
This experimental system chooses the LED as the light sources, with which, the light intensity can be adjusted by the current. To obtain accurate particle images, the image acquisition process as shown in Fig.2 is adopted. First, with the image acquisition, 20 frames of the sediment particle images are captured with the LED current of 0.8 A. Then the LED current is adjusted, and 20 frames are captured with the LED current of 0.75 A. These two sets of 20 frame images are processed image by image, respectively. Through the threshold transformation, the sediment particle image pixels are counted, and the results for the two sets are compared.n0is the number of sediment image pixels obtained with the LED current of 0.8 A, n1is the number of sediment image pixels obtained with the LED current of 0.75 A. When the difference between n0and n1is less than 0.5%, all sediment particles are considered to be counted. If it is more than 0.5%, some small particles might be submerged in the light. Thus, we should adjust the LED current to reduce the light intensity until the difference between ni-1and ni(iis the adjusting steps for the LED current) is less than 0.5%.
2.2 Optimal threshold algorithm
When the control parameters are kept constant, the image quality is relatively stable because of the low noise-signal ratio of the uniform light sources, and the camera and other devices in the closed measurement positions. The collected images are grayscale images with gray-scale values ranging from 0 to 255. The sediment particle images are separated from the background images by the threshold transform, which could be expressed as

whereT is the threshold value, and f( x, y)is the gray-scale value at the point(x, y)in the pixel lattice of images.Aand Bare the gray-scale values obtained by the threshold transform, which could be termed as the binarization transform when A =1and B=0.
Recently, the threshold transform is widely applied to the gray-scale distribution of images. The grayscale distribution diagrams, also named the histograms, have three types: the unimodal, the bimodal, and the multi-peak types. The unimodal histogram describes the non-uniform distribution of the background and the objects, with little to do with the gray-scale distribution, and partially shows the information of the objects. The bimodal histogram shows the existence of the gray level area of the objects and the background in the images, focusing on the difference between the objects and the background. The troughs of the gray values between two peaks are considered as the threshold. The threshold transform is used to separate the background from the objects. The multipeak histogram is a complicated image containing three or more peaks, with each peak corresponding to an object separated in each zone before the image is divided into zones.
The sediment particles are represented by different types of histograms according to different sizes and materials. The sediments with the uniform material and well-distributed sizes of particles are to be represented by unimodal histograms, while the sediments with the non-uniform material and a particle distri-bution are to be represented by multi-peak histograms. Thus, it is difficult to meet the actual needs just by adopting a single sediment segmentation.

Fig.3 Original image
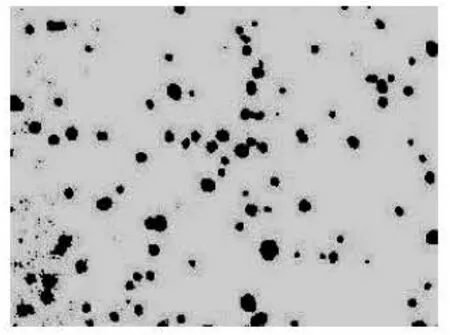
Fig.4 Result image with threshold of 190
Fig.5 Segmented image with threshold of 182
With the threshold segmentation as shown in Fig.3, the segmented images are obtained with the threshold values of 190 and 182, respectively. Compared with the image in Fig.4, the image in Fig.5 is shown to be better segmented, therefore, the separation result between the sediment particles and the background is directly affected by the threshold value. The experiments show that there exists a certain relationship between the optimal threshold value of the sediment and the peak value of the gray-scale, which may be expressed based on the statistics as follows

where Tbestis the optimal threshold value represented by an integer,G1is the peak value of the grayscale. The peak value in the gray histogram of the original image shown in Fig.3 is 223, and the optimal threshold value calculated by Eq.(2) is 182, as well consistent with the treatment effect. Using the extraction algorithm of the optimal threshold based on the peak value of the gray histogram, the dynamic threshold segmentation based on images of different sediment particles could be achieved, with results better and more flexible compared with the fixed threshold value.
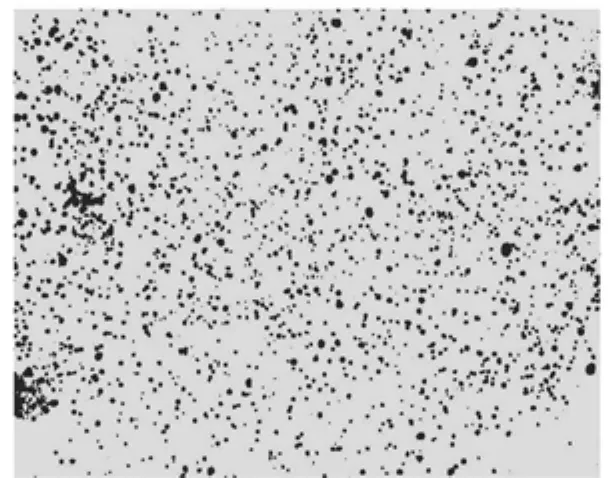
Fig.6 Single threshold value segmentation

Fig.7 Original image
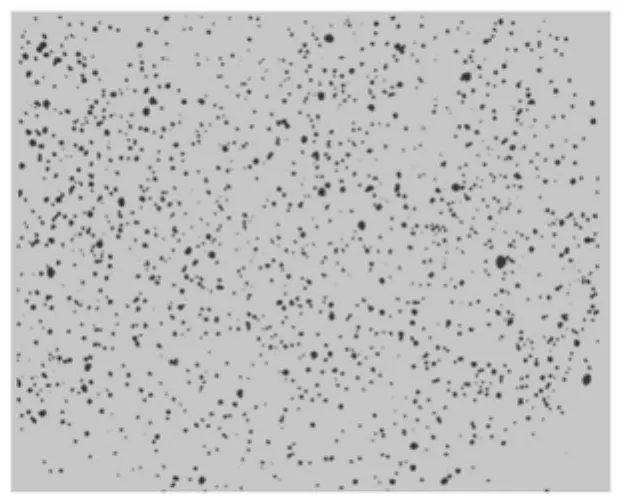
Fig.8 Partitioned threshold value segmentation
Although a homogeneous LED linear light source is used, it is still difficult to guarantee a consistent optical path for each sediment particle, especially, as it is affected by the reflection from the wall at the measurement positions in the area near the wall, resulting in differences in the light intensity received by different sediment particles. Under such a condition, the treatment is not very effective (Fig.6) in segmenting the particles from the background (Fig.7) with a single threshold value. Thus, the image should be divided into various regions according to the distribution of the gray histogram in each region, and thenthe threshold segmentation is conducted in each region of the image based on Eq.(2). The results of the treatment of the partitioned threshold segmentation are shown in Fig.8, which implies that the partitioned treatment is more efficient for the segmentation between the particles and the background. After the threshold segmentation, the gray value is 0 for the sediment particles and 255 for the background.
2.3 Fast pixel statistics of particle image
To calculate the area of the particle image, the pixels in the image should be counted. The labeling method is applied in this system to obtain the pixel statistics. The principle of the method is as follows: we mark the same label for the pixel points of the same target in the image while different labels are for different images, and the size of the target is obtained by using the statistics of the pixels with the same label.
The processing steps are as follows: (1) Determining the pixel characteristics of the sediment particles, setting the gray value 0 for the sediment particles, and 255 for the background, and making the pixel points of the same particle interconnected. (2) Determining the starting mark point and the initial tagged value, which are, in this system, respectively, the zero point of the image coordinate (0,0)and –1, indicating that the labeling has not started. (3) Determining the labeling principle that only the pixels of the sediment particles but not the background are labeled, with the interconnected pixels taking the same label. (4) Establishing three one-dimensional tag arrays, PX[ a],PY[ a]and PV[ a], for the x coordinate, the ycoordinate, and the corresponding tagged value of the pixels, respectively, and a is the total number of the pixels of the sediment particles. (5) Interpolating the gray values for each pixel along the row direction in turn, and recording the tagged value according to the sediment particle pixel points. The tagged value increases by 1 when a particle pixel point is shifted to a background one, while it keeps invariant when the background pixel point is shifted to a particle one or a particle pixel point is shifted to another. (6) Calculating the number of the pixels of the same tagged value in the tag array to obtain the sediment particle size.

Fig.9 Sketch of pixel statistics
Figure 9, as a processing example, shows the processing program: as f(0,0)=255, the pixel point (0, 0) will not be marked, and the tagged value keeps invariant,f(2,0)=0, so the pixel point (2, 0) is a sediment particle pixel point, and the tagged value should increase by 1 and be saved to the tag array: PX [1]=2,PY [1]=0and PV[1]=0, hence the number of pixels will be 1,f (3,0)=225, so the pixel point (3, 0) is not a particle pixel point with no mark, and the tagged value increases by 1; the points are analyzed in turns,f (8,0)=0,(8,0)is a sediment particle pixel point, hencePX [2]=8,PY[2]= 0,PV [2]=1.f(14,0)=0, (14, 0) is a sediment particle pixel point,PX [3]=14,PY [3]=0,PY [3]=2. f (15,0)=0, (15, 0) is a sediment particle pixel point, PX [4]=15,PY [4]=0,PV[4]=2. After analyzing the pixels in the first row, the second row will be considered, in whichf (2,1)=0, so (2,1)is a particle pixel point, now the distance between thePX[ a], PY[ a]of the first four pixel points and (2,1)could be calculated. If the distance is less than or equal to 1, it means that (2,1)is interconnected with this particle pixel and would take the same tagged value,PX[5]= 2,PY [5]=1and PV[4]=0. The other pixel points are analyzed similarly, and a value of 2 is marked, which means that there are three sediment particles in Fig.9. Statistics of the tagged values show that the three particles occupy 11, 12 and 15 pixel points, respectively.
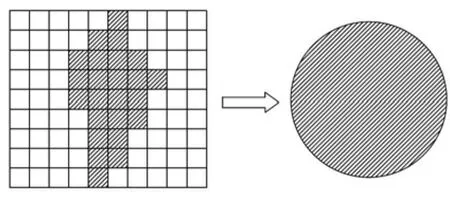
Fig.10 Equivalent area transformation
2.4 Equivalent transformation
The sediment particle images obtained through the image analysis are the largest cross-section projections with various shapes. Thus, it is necessary to establish a unified method for the sediment particle size calculation through an equivalent transformation between an image of the sediment particles and a circle with the same value of pixels and diameter as the sediment particles. The equivalent principle is shown in Fig.10, and the equivalent circle diameter is

where n is the number of pixels of the sediment par-ticle image,αis the pixel size, which is 4.4 µm for MVC1000MF black and white camera adopted in this system,Lis the vertical distance from the camera lens to the plane where the sediment particles are measured, andfis the focal length of the camera lens. The minimum size measured by this system is determined byLandα.Lis adjustable within the range from 100 mm to 400 mm, and the corresponding minimum diameter measurable ranges from 12.42 µm to 24.83 µm. The measurement of a smaller particle size is also possible by using a higher-resolution camera and a lens with a greater focal length. With the smaller sediment particle size, the camera range drops as well, resulting in the decrease in the number of sediment particles measurable simultaneously.Lshould be reasonably set according to the sediment sample to be measured in order to meet the measurement needs.
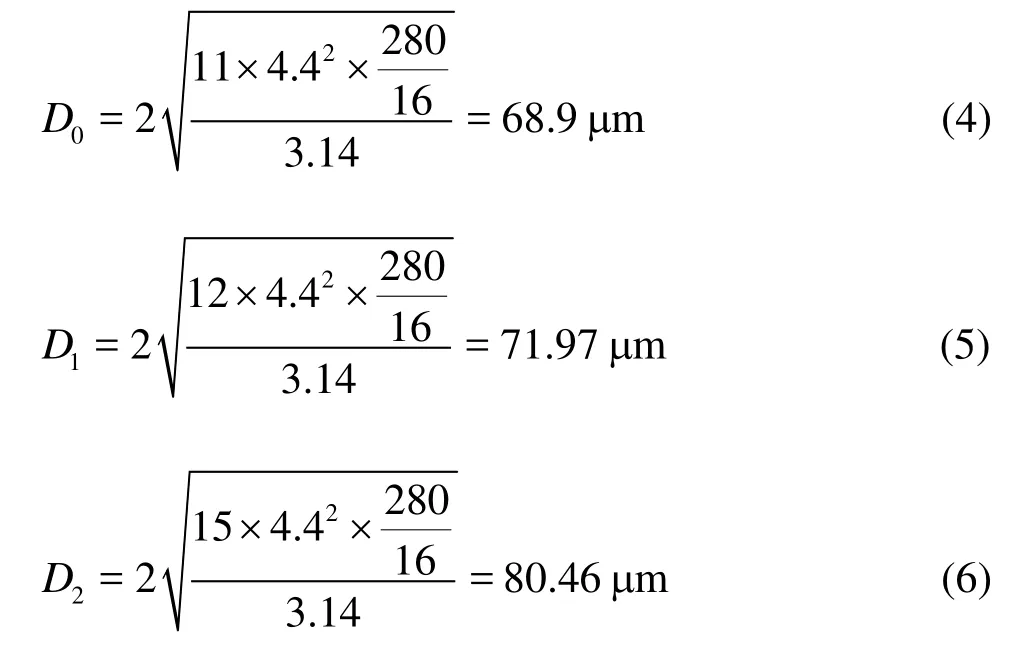
IfLandfare set at 280 mm and 16 mm, respectively, the equivalent circle diameters for the three sediment particles in Fig.4 will be as follows
3. Application and error analysis
The gradation curve is usually used to represent the sediment particle size information in the analysis of sediment particles, for the number of particles is huge, and the sediment usually moves as a group. The abscissa represents the particle size in a gradation curve, while the vertical axis represents the progressively accumulated percentage value of the quality of sediment particles of multi-size levels.
To test the measurement effect of this system, a comparison is made between the results of the Malvern laser particle size analyzer and the image analysis measurement by selecting spherical and irregularly shaped plastic sands as measurement objects, as shown in Fig.11. Where Cpis the cumulative percent andDis the partice size. It is shown that the shapes of gradation curves obtained by the two methods are similar. The median diameter of the laser particle method is 0.33 mm, while that of the image measurement method is 0.34 mm. The deviation of the results between the two methods mainly comes from small particles. The quality percentage of the sediment particles measured by the image measurement is 0 when the particle size is less than 0.04 mm, and the cumulative quality percentage by the image measurement method is smaller than that of the laser particle size analyzer when the particle size is less than 0.7 mm. The image measurement method is limitedly applicable to the minimum measurable size, and part of the small particles could not be correctly measured, so the quality percentage of large-size and mid-size particles are larger than the real ones.
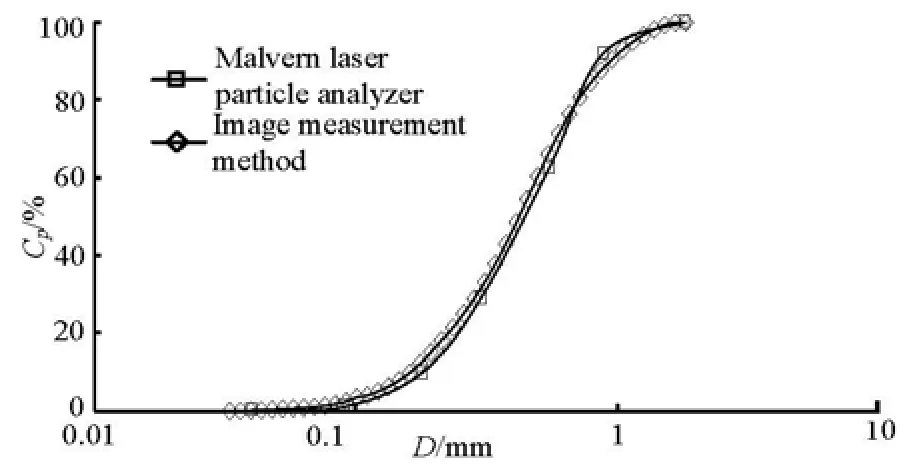
Fig.11 Comparison of results of spherical plastic sands obtained by Malvern laser particle size analyzer and image measurement method

Fig.12 Comparison of results of irregular shaped plastic sands obtained by Malvern laser particle size analyzer and image measurement method
The comparison of the results of irregular shaped plastic sands obtained by the Malvern laser particle size analyzer and the image analysis measurement method is shown in Fig.12. In order to reduce the impact of small particles on the measurement results, the particles with sizes less than 0.06 mm are left out by using a screen. The gradation curves of the two methods are reasonably similar in shape, and the median diameters are, respectively, 0.33 mm and 0.34 mm for the laser particle size method and the image measurement method. The measured quality percentage of particles obtained by the image measurement method is larger than that of the laser particle size method when the particle size is larger than 0.2 mm, mainly due to the irregular shape. The imagemeasurement mainly concerns with the cross-section projection information of the sediment particles, and the measured size is larger than the actual one for the largest cross-section projection of the particle.
For the laser particle size analyzer and the image analysis method, different definitions of equivalent diameter are used. For the former, the particle diameters are based on the scattering and diffraction theory[13-15], and the diameter is equivalent to the diameter of a ball with the same surface area as the sediment particles. For the latter, the diameter is equivalent to that of a circle with the same area as the maximal projection in the light propagation direction. Therefore, for irregular particles, the particle size measurement results show greater difference, while for spherical particles, the measurement results tend to be more consistent.
4. Conclusions
The grain size information is extracted by the threshold segmentation of the sediment particle images obtained by a camera. The pixels of each sediment particle are counted using the labeling method, and the diameter of a circle with an equivalent area of the sediment particle is calculated based on the equivalent area method. This system improves the sediment particle image segmentation by an extracting algorithm of the optimal threshold based on the gray histogram peak value, and makes the threshold transform more accurate. Theoretical calculations show that the minimum measurable size reaches 24.83 µm, enough to meet the requirement of the general sediment sample analysis, when the pixel size, the height of the camera, and the focal length are set at 4.4 µm, 400 mm, and 16 mm, respectively. This indicates that the sediment particle image analysis method is practical.
The grading form of the image analysis method is basically similar to but steeper than that of the laser particle sizer. This system is limited by the minimum measurable size, providing a larger median particle size, which means that the deviation would be a little bit larger for small sediment particles. To improve the measurement accuracy for small sediment particles, a high-resolution CCD camera should be used.
In the image measurements, only the particle information in the cross-section projection can be obtained, therefore, a multi-camera technology should be developed to reconstruct the three-dimensional shape of the sediment particles for further study of the physical properties of sediment particles.
[1] SHAO Xue-jun, WANG Xing-kui. Introduction to river mechanics[M]. Beijing: Tsinghua University Press, 2005(in Chinese).
[2] QIAN Ning, WAN Zhao-hui. Sediment dynamics[M]. Beijing, China: Science Press, 2003(in Chinese).
[3] QIAN Jin, ZHENG Sha-sha and WANG Pei-fang et al. Experimental study on sediment resuspension in Taihu Lake under different hydrodynamic disturbances[J]. Journal of Hydrodynamics, 2011, 23(6): 826-833.
[4] MISIRLI Z., ONER E. T. and KIRDAR B. Real imaging and size values of Saccharomyces cerevisiae cells with comparable contrast tuning to two environmental scanning electron microscopy modes[J]. Scanning, 2007, 29(1): 11-19.
[5] APOSTOLOPOULOS G., TSINOPOULOS S. and DERMATAS E. Estimation of human red blood cells size using light scattering images[J]. Journal of Computational Methods in Sciences and Engineering, 2009, 9(1-2): 19-30.
[6] SOUZA D. O. C., MENEGALLI F. C. Statistical study of particle size distribution and shape characterization[J]. Powder Technology, 2011, 214(1): 57-63
[7] CARTER R. M., YAN Y. Measurement of particle shape using digital imaging techniques[J]. Journal of Physics: Conference Series, 2005, 15: 177-182.
[8] CARTER R. M., YAN Y. and LEE P. On-line nonintrusive measurement of particle size distribution through digital imaging[J]. IEEE Transactions on Instrumentation and Measurement, 2006, 55(6): 2034-2038.
[9] TYSMANS D., CLAEYS P. and DERIEMAEKER L. et al. Size and shape analysis of sedimentary grains by automated dynamic image analysis[J]. Particle and Particle Systems Characterization, 2007, 23(5): 381-387.
[10] BOSCHETTO A., GIORDANO V. Powder sampling and characterization by digital image analysis[J]. Measurement: Journal of the International Measurement Confederation, 2012, 45(5): 1023-1038.
[11] LI Dan-xun, XU Si-tao and YU Ming-zhong et al. Application of image processing to the analysis of gravel shape in Jialing River[J]. Journal of Sediment Research, 2000, (6): 6-9(in Chinese).
[12] LIU Yun. Study on the sediment particle analysis system based on digital image process[D]. Doctoral Thesis, Nanjing, China: Hohai University, 2011(in Chinese).
[13] ZOBECK T. M. Rapid soil particle size analyses using laser diffraction[J]. Applied Engineering in Agriculture, 2004, 20(5): 633-639.
[14] VEIHELMANN B., KONERT M. and Van Der ZANDE W. J. Size distribution of mineral aerosol: Using lightscattering models in laser particle sizing[J]. Applied Optics, 2006, 45(23): 6022-6029.
[15] PIERI L., BITTELLI M. and PISA P. R. Laser diffraction, transmission electron microscopy and image analysis to evaluate a bimodal Gaussian model for particle size distribution in soils[J]. Geoderma, 2006, 135: 118-132.
10.1016/S1001-6058(13)60359-5
* Project supported by the National Key Basic Research and Development of China (973 Program, Grant No. 2011CB403303), the China National Funds for Distinguished Young Scientists (Grant No. 51125034) and the National Natural Science Foundation of China (Grant Nos. 50909036, 50879019).
Biography: CHEN Hong (1981-), Male, Ph. D. Candidate
TANG Hong-wu,
E-mail: hwtang@hhu.edu.cn
杂志排行
水动力学研究与进展 B辑的其它文章
- An experimental study on runup of two solitary waves on plane beaches*
- Electro-osmotic flow of a second-grade fluid in a porous microchannel subject to an AC electric field*
- Parametric instability of a liquid metal sessile drop under the action of low-frequency alternating magnetic fields*
- Influence of flow field on stability of throttled surge tanks with standpipe*
- Influence of emergent macrophyte (Phragmites australis) density on water turbulence and erosion of organic-rich sediment*
- Hydrodynamic performance of a vertical-axis tidal-current turbine with different preset angles of attack*