The Applications of the Least-Square Principle in the Security Quality Forecasts about Tunnel Project
2013-02-09OriginalAuthorXUXi
Original Author:XU Xi
From Application and Knowledge of Mathematics 2008(6)
(Mapping Department of Construction School of Chongqing Jiaotong University,Chongqing 400074)
Translator:DAI Qian
(Chongqing YUCAI Project Supervision Limited Company,Chongqing 400074)
In people’s lives,the variable research usually impacts them.In general,the variable research includes two types of relationship:function variable research and statistical variable research.The function variable relationship is certain one,one(or one group of)variable value is certain the only function value.The equation of variable is the accurate equation.Another relationship is an uncertain one.It means the independent variable and dependent variable influence each other strongly,but one dependent variable couldn’t ensure the only independent variable.The equation of this relationship is approximate equation[1].
A usual method of statistical relationship analysis is regression analysis method.The first step is building the approximate equation between dependent and independent variable based on observation data.It builds the fitting mathematical model.Then,checking effect and precision of model is necessary.If the model passes test,builders could forecast dependent values,confidence interval,etc by the model[2].
For avoiding fitting error when building model,the general equations include:


The Equation 3)is the least-square principle.Because its high sensitivity,it becomes the basic theory of the regression analysis.
Technically,the forecasting model,which is built by past variable rule,is the auto-regression model.Because the autoregression model is the summarize of past variable relationship,it should be efficient for future dependent and changing trend forecasting if other conditions no change.
1.Building modelby the leastsquare principle
Draw the curve graph(scatter diagram)by observation point.By the linear of curve,the builder should find possible model type(or types).With the possible type(or types),builders could fit the model.If the model is linearity,the way is finding regression coefficienta,bwith least-square and substituting them into the model;if the model isn’t linearity,builders need fit it to linearity firstly,then finding regression coefficient a,b with least-square and substituting them into the model.The final result is one or several primary model(or models).
Test is necessary for regression model.If there is only one primary model,the test only need check the significance of the model.If there are several models,the test would find the best significant one to preserve.
There are many methods for statistical test;the most common method is relativity test.
If the model isn’t linearity,the model need be translated to linearity model before relativity test.This job has finished when model built bya,b,so the relativity test is very simple.The relativity tests before or after linearity translations are the same.
Taking the data pointsxi,yi(i=1,2,3,…,n),the regression equation is:

1.1 The least-square forecasting for values of
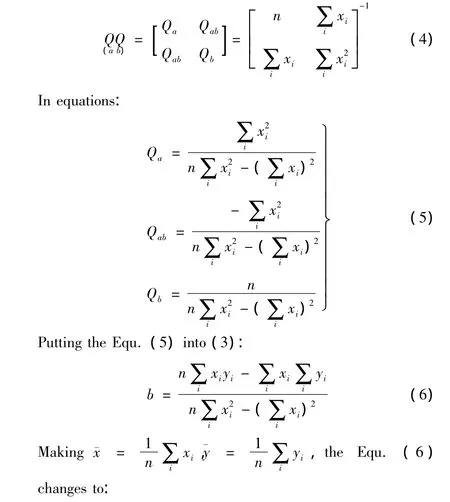
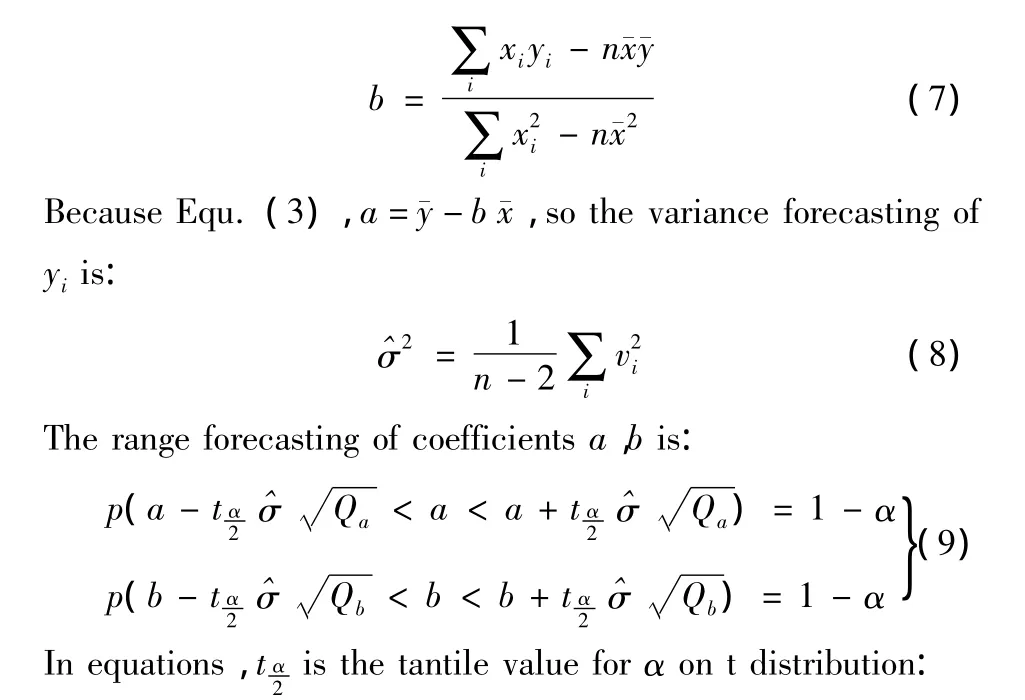
The coefficient inverse matrix is:
1.2 relativity test of regression model
Related coefficients ofxi,yiis:

The absolute value ofrreflects linear relativity between yandx,the range is[ -1,+1].The conclusion is following:
For keeping the minimum linear relativity for fitting model,themust be larger than related test requirement(critical value).
Making the significance to α,variance ton- 2 as argument,builders could find the critical value ofrαin related coefficient probability distribution table.If,the model have enough significance on level α;if not,the model is wrong[3].
2.The real example
During or after tunneling,the hole should deformate.The possible situation includes arch settlement,side-well contraction,tunnel bottom bulging,etc.All these situations could be described by mathematical models.
In this article,the author uses the side-well observation data of Shuifu Tunnel in Yunnan Shui-Ma Highway as the example to analyze the application of least-square regression analysis on tunnel construction safety and quality monitoring and forecasting.
Generally,the deformation extent and speed of tunnel are fast and terrible in early period.As time goes by,changing extent should be lease and changing speed would be slow until them end finally.By this situation,the main factor,which should influence the tunnel deformation(includes side-well contraction),is time,so possible model types are index and logarithmic functions.
In the Graph 1,the relative convergence valueu(difference of convergence observation between first day and every other observation day)is the vertical coordinate and timetis horizontal coordinate.The author built a regression model by observation curve(Line 1 in Graph 1),which draw by first seven days’convergence observation(t=1~7 in Table 1).
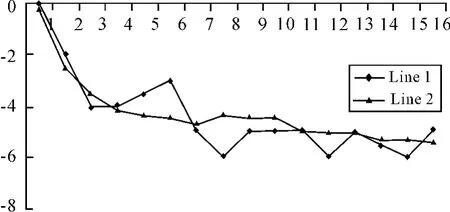
Graph 1 The convergence deformation analysis curve graph
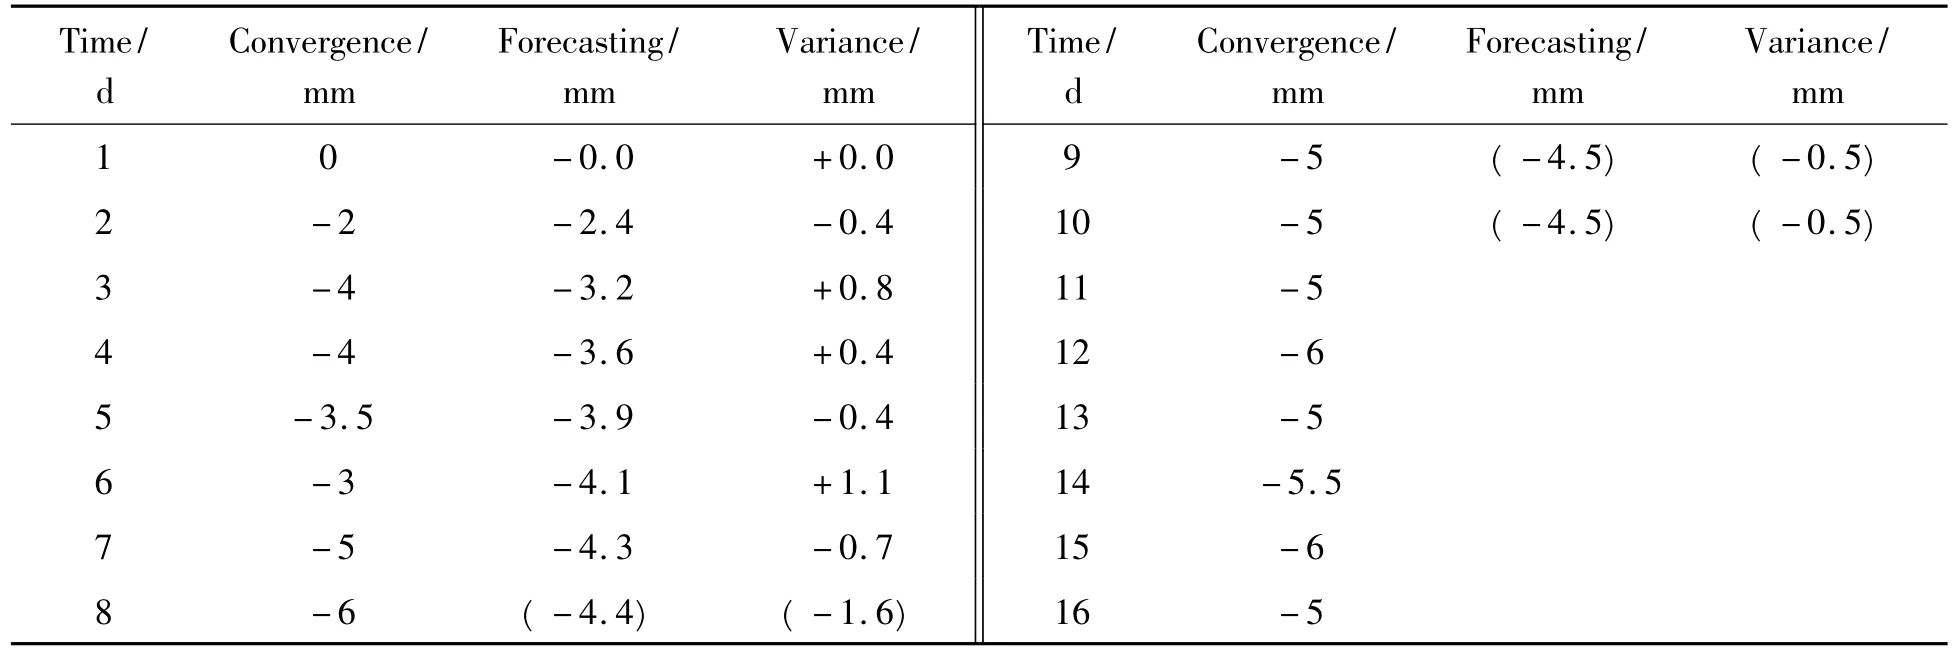
Table 1 Regression analysis table of 1stto 10thday
By linearity of Line 1,the author finds the equations:

The author uses these two equations to fit the model.
Making the logarithm change on both sides of Equ.(11),it is:

By Equ.(7),the author findsb= -5.439 8 and puts it into Equ.(13),the result isa= -1.717 6.Then,the author putsa、binto Equ.(11),the result is convergence index model:
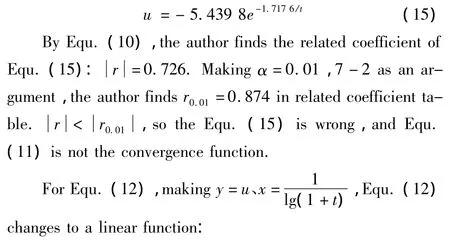

By the same way,the author finds observations of first seven days(t=1~7)and puts them into Equ.(7).The result isb=1.9128.Putting it into Equ.(14),the author findsa= -6.373 9.Puttinga、binto Equ.(12),the convergence model is:

Puttingt=1~7 into Equ.(17),the result is convergence function value(or forecasting value).Based on the information,the author draws the fitting curve(Line 2).Linearities of Line 1 and Line 2 is similar.
The difference between observation and function result is the regression variance(v).The author puts them into Table 1 for fitting degree:

σ is smaller than 1 mm(the critical precision),so the Equ.(17)is efficient.
The author checks Equ.(17)by curve linearity,fitting degree and related index,all results prove that the equation is efficient.
On the 7thday,the author putst=8、9、10 into Equ.(17)for forecasting value.Comparing forecasting values and observation values of 8th,9th,10thday,all variances are not over 3 mm(the safety value in〈Technical Specifications for construction of Highway tunnel〉),so the observing is efficient.
Regression analysis of 1stto 13th:as the same way,the author compares the function values and observation values of ten days(t=1~10)in Table 2.

The author calculates the variance values(v)and puts them into the Table 2.In Table 2,the author chooses forecasting value of 8th,9th,10thday to draw Line 2,the result prove that Equ.(19)is significant.Then,the author putst=11、12、13 to calculate forecasting value of these three days.Comparing with observation of these three days,the author gets the variance values and puts them into Table 2.The result proves that the observing is efficient.
Regression analysis of 1stto 16thtime period:By calculate values oft=1 ~13 in Table 3 and related observation values,the author fitted the model:

The author calculates the variance values(v)and puts them into the Table 3.By the forecasting value of 11th,12th,13thday,the author draws the curve of forecasting curve.It proves that the Equ.(20)is significant.Puttingt=14、15、16 into Equ.(20)to calculate forecasting value of these three days.Comparing with observation of these three days,the author gets the variance values and puts them into Table 3.The result proves that the observing is efficient,too.

Table 2 Regression analysis table of 1stto 13thday
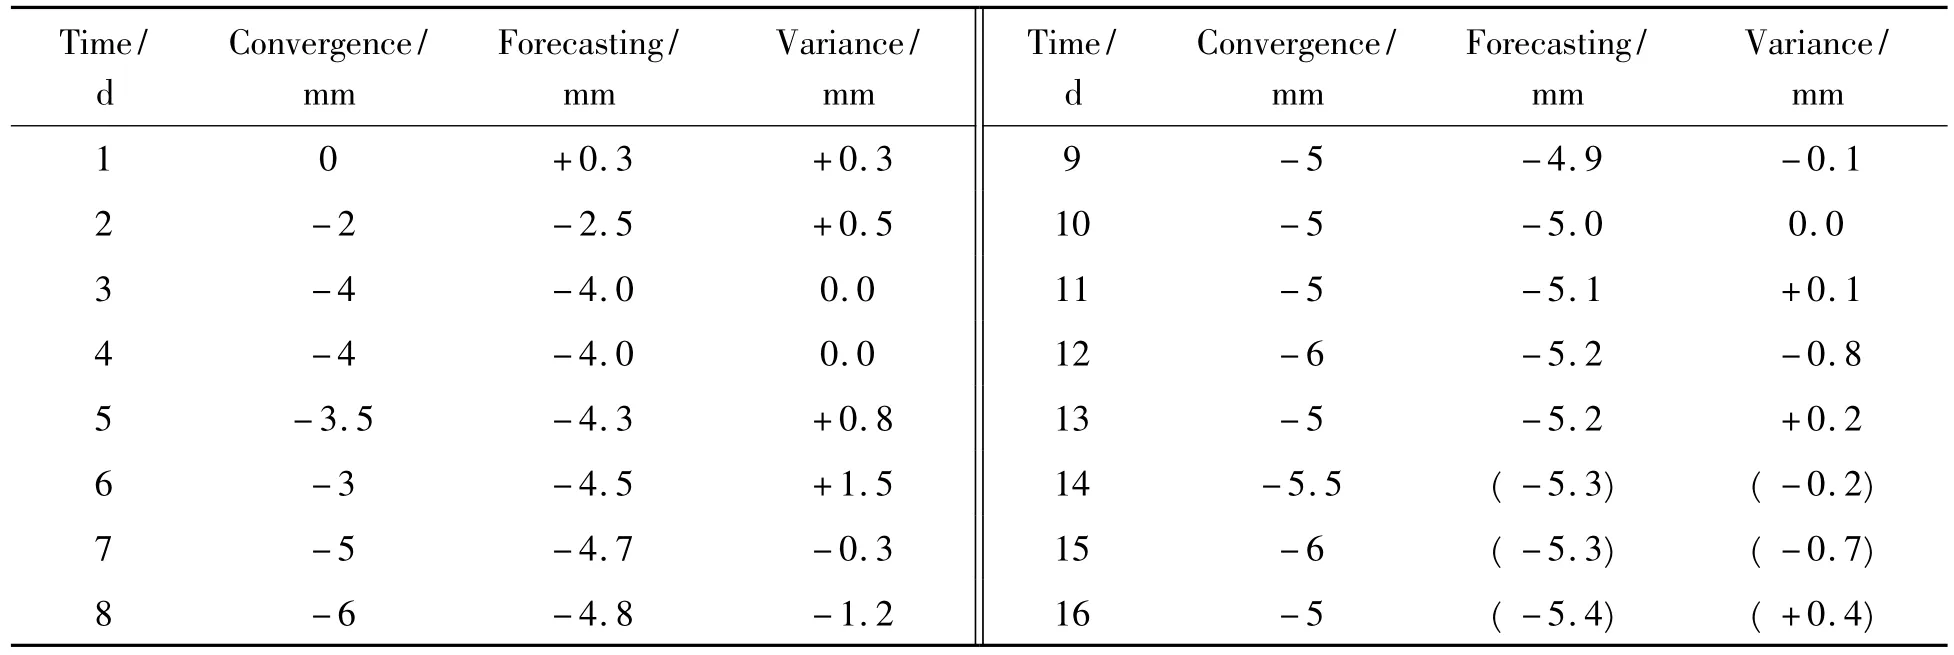
Table 3 Regression analysis table of 1stto 16thday
3.Conclusion
All above processes are the application of least-square regression analysis on tunnel construction safety and quality observing.It has advantages as rigorous logic,clear idea,distinct process and nice result.The forecasting rule and theory for mathematical model building are right,and the calculation process is un-complex.
The method in this article is not only useful for tunnel construction monitoring,but also suitable for bridge,highway construction safety and quality control.
Reference:
[1] Wang Xinzhou,Tao Benzao,Qiu Weining,et al.Advanced Surveying Adjustment[M].Beijing:Surveying and Mapping Press,2006.
[2] Bai Fengshan,Yao Huanmin,Li Chunling,et al.Mathematical Modelling[M].Harbin,Harbin Institute of Technology Press,2002.
[3] Wang Xuemin.Applied Probability and Satistics[M].Shanghai:Shanghai University of Finance and Economics Press,2005.
(责任编辑 魏艳君)
