二棕榈酰磷脂酰胆碱/豆固醇脂质体液态有序相的结构性质:同步辐射X光衍射研究
2012-12-12邬瑞光尉志武
邬瑞光 陈 琳 尉志武,*
(1清华大学化学系,生命有机磷化学与化学生物学教育部重点实验室,北京100084; 2北京中医药大学中药学院,北京100102)
1 Introduction
The cholesterol-rich domain structures in biological membranes of animals,namely rafts or detergent-resistant membrane fractions(DRMs),have been implicated in numerous cellular processes,including signal transduction,protein sorting, cellular entry by toxins and viruses,and viral budding.1-4Several pieces of evidence support the understanding that DRMs exist at liquid ordered(Lo)state.5-7The Lophase was first defined by Ipsen et al.8Generally speaking,this phase has properties that are intermediate between those of the gel and fluid phases. Like the gel phase,the Lophase is characterized by tight acyl-chain packing and relatively extended acyl chains.On the other hand,like lipids in the liquid crystal phase(Lα),lipids in the Lophase exhibit relatively rapid lateral mobility within the bilayer.6,8,9But there are few reports about the more detailed structural properties of the Lophase so far,especially the temperature and concentration dependence of the d-spacings of small-angle and wide-angle X-ray scattering(SAXS and WAXS)of Lophase.
As the major sterol presenting in mammalian cells,cholesterol has been regarded as a critical component of rafts in cells.10-12Thus investigations concerning the characters of Lophase were mainly focused on lipid mixtures containing cholesterol.Particular efforts have been put on binary mixtures of saturated phosphatidylcholines(or sphingomyelins)and cholesterol so far.
Not limited to animal cells,DRMs rich in sphingolipid/sterol have also been isolated from plant cells,where the dominant sterol is not cholesterol.13-16Particularly,stigmasterol has been identified as one of the predominant sterols in plant rafts such as in tobacco lipid rafts.14,17For reason that stigmasterol is among the major sterols in plant plasma membranes,18,19its role in the formation of Lophase has become an interesting topic recently.In a study of lipid mixtures containing natural sterols and sphingolipids using fluorescence quenching and detergent insolubility,Xu et al.20have shown that,like cholesterol,stigmasterol promoted the formation of tightly packed liquid ordered domains containing DPPC or sphingomyelin.And both cholesterol and stigmasterol promoted the insolubility of these domains.20There have also been reports on the effects of stigmasterol and other plant sterols on the phase behavior of DPPC multibilayers investigated by differential scanning calorimetry (DSC),X-ray diffraction(XRD),resonance energy transfer, Langmuir monolayer,and detergent-induced solubilization techniques.21-23
Phosphatidylcholines(PCs)are among the major phospholipids of plasma membranes.24Saturated PCs are known to have very similar physical properties to that of saturated-chain sphingolipids.25Thus DPPC/sterol mixtures have been selected by many research groups as simple model systems of Lophase. Therefore,it is of importance to explore the structural properties of Lophase by studying the stigmasterol-containing DPPC multibilayers.
We have constructed a partial phase diagram of DPPC/stigmasterol binary mixtures employing XRD,DSC,and freezefracture electron microscopy(FFEM)techniques,26as sketched in Fig.1.In the present paper we will report the structural characters of the concerned phases,particularly the Lophase,of the binary mixtures by analyzing the small-angle and wide-angle XRD patterns.
2 Materials and methods
2.1 Materials
DPPC was purchased from Sigma Chemicals(99%,St.Louis,MO,USA).Stigmasterol was from MP Biomedicals Inc. (95%,Aurora,OH,USA).They were used without further purification.DPPC/stigmasterol mixtures with designated mole ratios were dissolved in chloroform,dried under nitrogen,and then stored in vacuum overnight.The lipid films were hydrated with excess Tris-HCl buffers(50 mmol·L-1Tris-HCl,150 mmol·L-1NaCl,0.1 mmol·L-1CaCl2,pH=7.2)with repeated vortexing and heating-cooling between 60 and 20°C for at least three times and then stored at-20°C at least for 24 h before experiments.The mole fractions of stigmasterol in the binary mixtures were 1.25%,2.5%,4%,5%,7.5%,10%,15%, 20%,22.5%,25%,27.5%,30%,35%,40%,45%.
2.2 Experimental methods
Real-time synchrotron XRD experiments were performed at Station BL40B2 of SPring-8,Japan.The SAXS/WAXS data were recorded on-line with an image plate detector.The wavelength was 0.1 nm and camera length was about 400 mm.A standard sample silver behenate was used for calibration.A Linkam thermal stage was used in temperature control.To remove thermal history,all samples have been heated to 65°C and then cooled to 20°C at a rate of 0.5°C·min-1before measurement.The temperature scanning rate was 0.5°C·min-1during the measurement.Time for image exposure,data processing and dumping was 330 s.Electron density distributions across the unit cell of lamellar repeat of the DPPC codispersions containing different molar percentages of stigmasterol were calculated as follows.Integrated intensities I(h)for a range of diffraction orders(h)were obtained from low-angle scattering intensity profiles.Electron density profiles in a one-dimension space x,in arbitrary unit,were then expressed as27-29
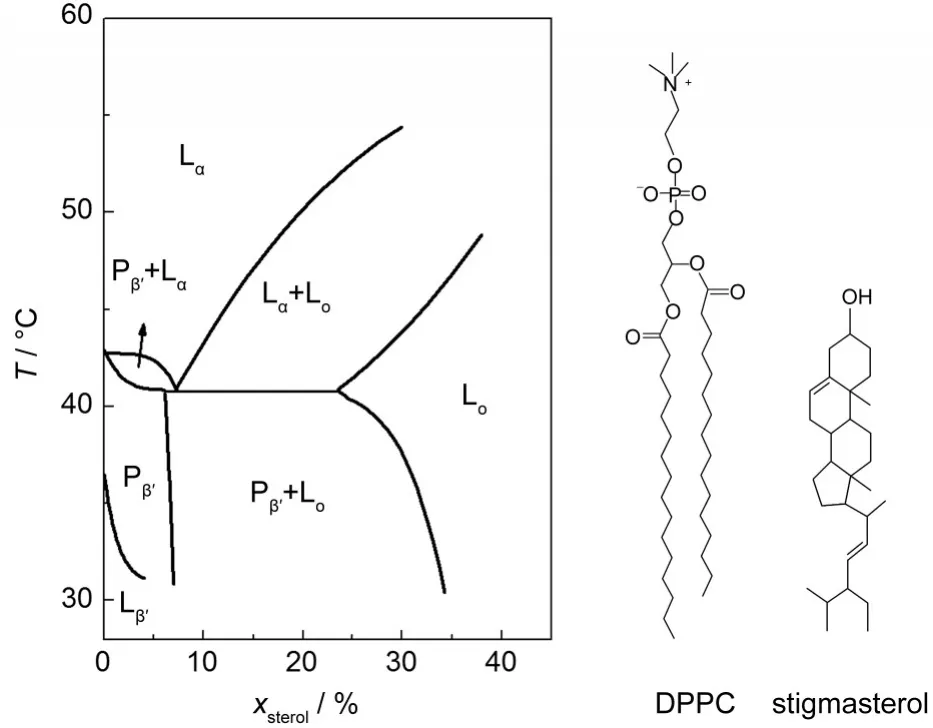
Fig.1 Phase diagram of stigmasterol/DPPC mixture dispersed in excess water(redrawn after Ref.26)and schematic representation of the molecular structures of DPPC and stigmasterol

where F(h)is the structure factor,g(h)is the phase of F(h)of the hth order diffraction,and d is the repeat spacing of the multibilayers.
The structure amplitude F(h)was set equal to[I(h)]1/2,where I(h)was obtained for each order h by measuring the area under the respective diffraction peak after normalization and background subtraction.27Error and trial method has been employed to solve the phase problem.All possible phase sets have been attempted,but only the phase set of“-,-,+,-,-”was reasonable.This phase combination has also been reported in similar systems including dimyristoylphosphatidylcholine(DMPC)/ cholesterol mixtures,30DPPC/dipalmitoylglycerol(DPG)mixtures,31and DPPC/dimethyl sulfoxide(DMSO)mixtures.32
Deconvolution of the multicomponent XRD spectra was carried out using PeakFit software(Aisn Software Inc.).The baseline was created by two-point linear method and peak type was Gauss+Lorentz for all the deconvolution treatments.
3 Results and discussion
SAXS and WAXS patterns can provide information on long range bilayer organisation and hydrocarbon chain packing of DPPC multibilayers,respectively.The d-spacing of SAXS represents repeat distance of DPPC multibilayers,including the thickness of the bilayer(i.e.,the distance between two phosphate groups)and that of the water layer.The d-spacing of WAXS represents in-plane packing of DPPC hydrocarbon chain in a quasi-hexagonal or hexagonal lattice.27,32
XRD patterns were recorded over the temperature range of 30 to 60°C at an interval of 2.75°C at a heating rate of 0.5°C· min-1.At least five orders of diffraction have been recorded in the small-angle region for each of the mixed lipid dispersions.
Representative SAXS and WAXS patterns for dispersions of DPPC containing 15%(x,molar fraction)and 30%(x)stigmasterol are presented in Fig.2.Five orders,including the overlapped fourth and fifth orders,diffractions in the smallangle region can be seen.Literature results have shown that, for DPPC dispersions containing certain amount of sterol, there are two domains coexist no matter below or above the main transition temperature,called sterol-poor and sterol-rich domains,respectively.8,22,26Accordingly,each peak of the five order diffractions was deconvoluted into two subpeaks.Fig.3 shows the deconvoluted results of five SAXS orders of a sample containing 30%(x)sterol at 30°C,including the overlapped 4th and 5th order peaks.The reciprocal spacings can be put into two groups:(0.13,0.26,0.41,0.55,and 0.66 nm-1)and (0.14,0.28,0.42,0.61,and 0.69 nm-1).They are in ratios of 1:2: 3:4:5.
Fig.4 shows the temperature-dependence of the d-spacings of WAXS of gel,Lo,and Lαphases formed by DPPC/stigmasterol mixtures.The concentrations of stigmasterol are 0 and 5%(x)for gel phase,0,5%,and 10%(x)for Lαphase,and 35%,40%,and 45%(x)for Lophase,respectively.According to Fig.1,these samples are all in single-phase region over a certain temperature range.As shown in Fig.4,the d-spacings of Lophase have a much broader range compared to those of gel phase and Lαphase.The d-spacings of the gel phase and Lαphase increase from 0.420 nm to 0.423 nm and from 0.456 nm to 0.459 nm with temperature,respectively.This corresponds to only about 0.7%in the temperature range.On the contrary, the d-spacings of Lophase show a strong temperature and concentration dependence,varying from 0.422 to 0.460 nm,contributing to about 9%increase.This is consistent with the literature33,34results.Gao and coworkers33also found that the d-spacings of Loof DPPC/stigmasterol mixtures showed a strong temperature dependence.In an experimental study on DPPC/cholesterol codispersions,Clarke and coworkers34also found that the d-spacings of WAXS of the single Lophase had a much wider range than those of gel and Lαphases,varying from 0.420 to 0.495 nm and showing a strong temperature and concentration dependence.Their and our experimental results all suggest such a conclusion:compared with gel and Lαphases, the Lophase has a more diverse range of d-spacings of WAXS. One possible reason that the d-spacing of WAXS of Lophase has marked temperature dependence is that the position of the sterol molecules in DPPC bilayers is temperature-dependent. In a molecular dynamics simulation study,Qin et al.35found that the position of α-tocopherol in phosphatidylcholine bilayers had a strong temperature dependence.The structural role of α-tocopherol and sterol in PC membrane is similar.35
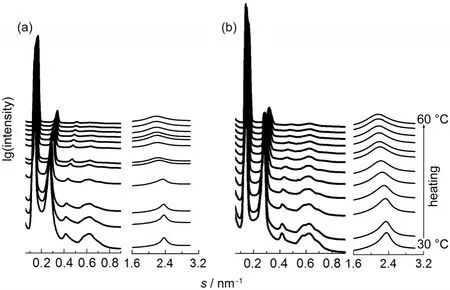
Fig.2 X-ray diffraction patterns recorded from stigmasterol/DPPC binary mixtures as a function of reciprocal spacing during heating scans at 0.5°C·min-1(a)15%(x,molar fraction)and(b)30%(x)stigmasterol.The temperature interval is 2.75°C.
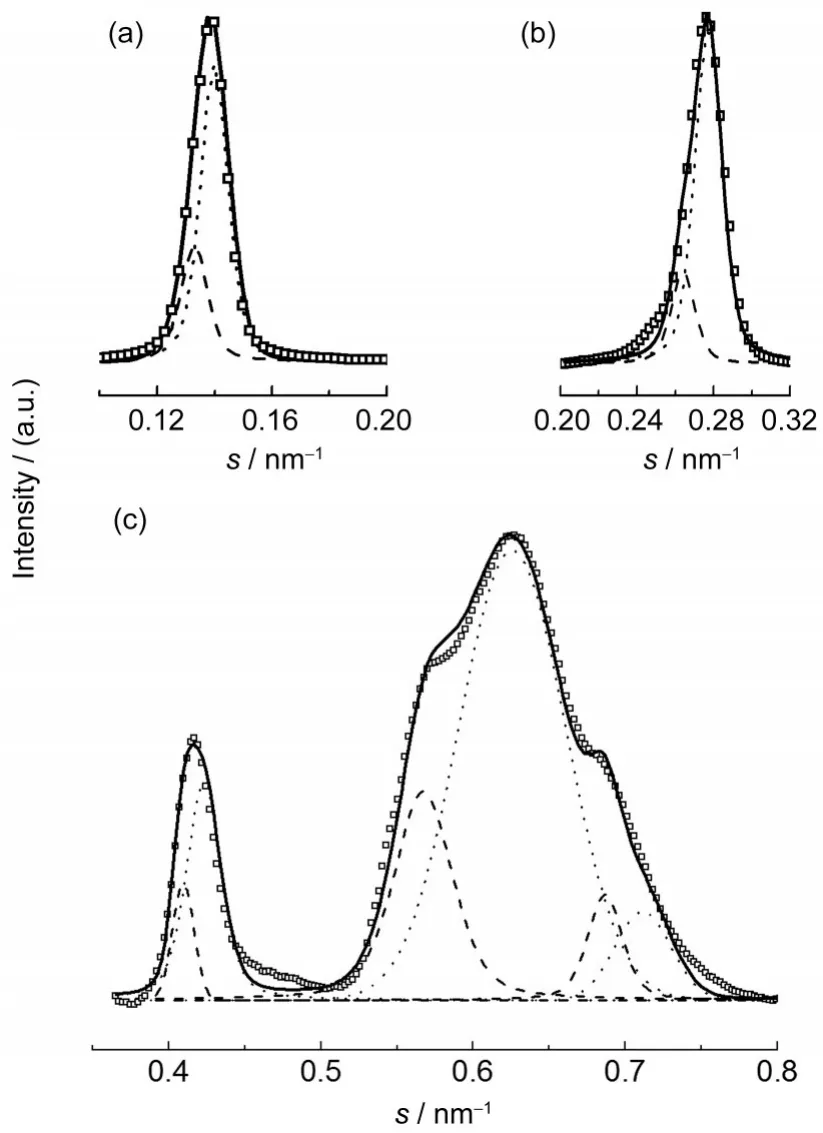
Fig.3 Deconvoluted results of all the five orders of the DPPC/ stigmasterol mixture containing 30%(x,molar fraction) sterol at 30°C(a)first order,(b)second order,(c)third,fourth,and fifth order.Open squares represent experimental data,solid lines represent overall fitting spectra,dash and dotted lines represent deconvoluted diffraction spectra of Pβʹand Lo domains,respectively.
It is well known that 0.42 and 0.46 nm are characteristic dspacings of WAXS of gel phase and Lαphase,respectively.32,34,36They reflect the repeat spacings of hexagonal or quasi-hexagonal arrangements of acyl chains as depicted in a previous publication.37The experimental results that the d-spacing of Lophase varies from 0.422 nm to 0.460 nm may imply that the Lophase owns both the character of gel phase and the character of Lαphase,depending on the composition of the binary mixture and temperature.This is consistent with the conclusion that the character of Lophase covers the characters of both gel phase and Lαphase.6
Fig.4 shows that the d-spacings of WAXS of Lophase formed by stigmasterol/DPPC mixtures are larger than that of Pβʹphase(the gel phase of Fig.4 includes Pβʹphase and Lβʹphase).This implies that the degree of chain order of Pβʹphase is higher than that of Lophase.This is consistent with our thermodynamic experimental results of stigmasterol/DPPC mixtures.In our earlier work,26the ratio ofwas found to be 1.2(1.2 was the value ofaccording to nonlinear least squares fitting when taking 1.1 as the initial value.andwere defined as the molar phase transition enthalpies of lipid mixtures from Pβʹto Lαand from Loto Lα,respectively).26As far as the ratio is concerned,though the concentration and the temperature of the two“Lα”phases are different,data in Fig.4 suggest that the d-spacings of Lαphase have little dependence on temperature and concentration.Thus it is reasonable to assume that the two“Lα”phases have almost the same degree of chain ordering.Thussuggests that it is an endothermal transition from Pβʹphase to Lophase.This implies that the alkyl chains of Lophase are more disordered than that of Pβʹphase.
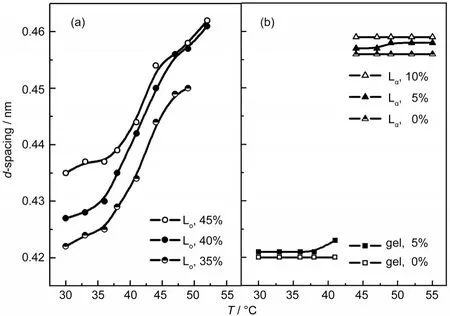
Fig.4 Dependence of d-spacings of WAXS of single Lophase(a),single gel phase(b),and single Lαphase(b)on temperature and stigmasterol concentration
Fig.5 shows the temperature-dependence of the d-spacings (SAX)of Lβʹ,Pβʹ,Lo,and Lαphases formed by DPPC/stigmasterol mixtures.The concentrations of stigmasterol are 0 for Lβʹphase,0 and 5%(x)for Pβʹphase,35%,40%,and 45%(x)for Lophase,and 0,5%,and 10%(x)for Lαphase.According to the phase diagram(Fig.1),these samples are all in single-phase region over a certain temperature range.Based on these data, two conclusions can be drawn.Firstly,the d-spacings of various phases of DPPC/stigmasterol multilamellar structures increase in the following sequential order:Lβʹ<Lα<Lo<Pβʹ.This d-spacing sequence is consistent with that of pure DPPC membranes(Lβʹ<Lα<Pβʹ).36Not surprisingly,ripple phase shows the longest repeat spacing among the four phases.Surprisingly,the repeat spacing of Lois greater than those of Lβʹand Lα.This is consistent with what Hui and He reported.38We will discuss this further after we have shown the electron density profiles. Secondly,similar to those of Lβʹphase and Lαphase,the d-spacings of Lophase change slightly with temperature and sterol concentration.As shown in Fig.5,the d-spacings of Lβʹ,Lα,and Lophases vary from 6.39 to 6.44 nm,6.60 to 6.82 nm,and 6.91 to 7.12 nm in the respective temperature range,increasing only 0.05,0.22,and 0.21 nm,respectively.Clarke and coworkers34reported that the d-spacings of Lophase formed by DPPC(or DMPC)and cholesterol were nearly a constant,varied by only 0.1 nm over the temperature range(5-65°C).Our experimental results are consistent with their conclusions.But the d-spacings of Pβʹphase vary from 7.16 to 8.97 nm,increasing 1.81 nm.Yu et al.32and Matuoka et al.39also reported that the d-spacings of Pβʹphase had a larger range than that of Lβʹphase. Furthermore,careful examination on the data of Lophase (Fig.5)shows that the dependence of d-spacing on stigmasterol concentration is not monotonic.This might have been caused by the sample containing 35%(x)stigmasterol.As shown in Fig.1,the right boundary of the two-phase region below 40°C is very close to 35%(x).Taking the error of the concentration of this sample and that of the boundary into account,the sample may not be a pure Lophase,but containing a small amount of ripple phase.This might have caused greater d-spacing values than they should be since the d-spacing of Pβʹphase is much larger than that of Lophase.
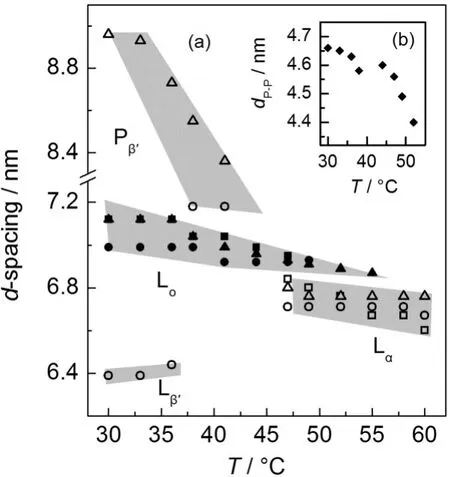
Fig.5 Temperature dependence of SAXS d-spacings of various DPPC/stigmasterol codispersions at different phase statesThe concentrations of stigmasterol are:0%(○),5%(Δ),10%(□),35%(■), 40%(●),and 45%(▲).Inset shows the temperature dependence of dP-Pof Lo phase which coexists with sterol-poor domains.
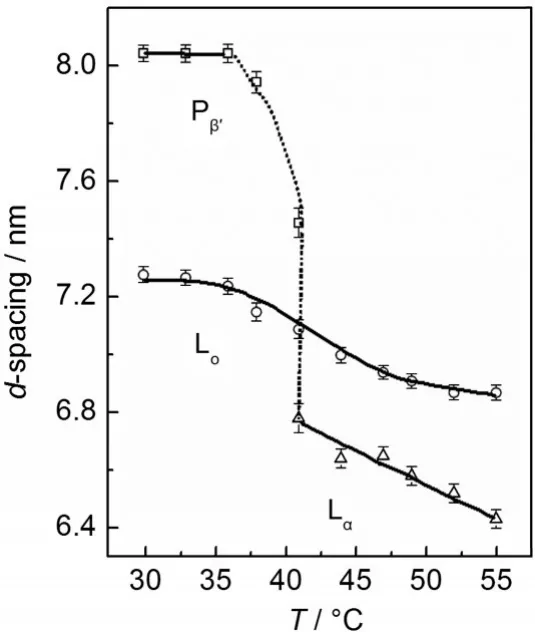
Fig.6 d-spacings of the Lophase(○)and coexisting Pβʹphase(□) or Lαphase(Δ)
As shown in Fig.1,the Lophase coexists with Pβʹphase below 40.8°C(the temperature of three-phase line)and coexists with Lαphase above 40.8°C.Thus the d-spacings of the two phases at the same temperature are almost fixed at a given temperature.We deconvoluted the second order of the SAXS patterns at a given temperature to deduce the d-spacings of Lophase and another coexisted phase.The results are summarized in Fig.6.The d-spacings of the two phases at each temperature represent the average of at least three sample concentrations. There are two obvious differences between the d-spacings of the Lophase and another coexisted phase.Firstly,the change of d-spacing of another coexisted phase is much larger than that of the Lophase.As shown in Fig.6,the d-spacing of another coexisted phase decreases from 8.05 to 6.43 nm,making a 20% decrease compared to only 6%decrease from 7.28 to 6.87 nm for Lophase.Secondly,the d-spacing of another coexisted phase decreases drastically at around 40°C while that of the Lophase decreases much gradually over the temperature range.
To estimate the thicknesses of the bilayer and the water layer,the relative electron density profiles of Loand Lαphases from 44 to 52°C have been calculated.Taking the DPPC/stigmasterol mixture containing 20%(x)sterol as an example, Fig.7 shows the representative electron density profiles of DPPC/stigmasterol mixtures containing 20%(x)sterol at 44°C. The top pattern is the electron density profile of Lophase and the bottom pattern,Lαphase.As shown in Fig.7,the thickness of the bilayer(i.e.,the distance between two phosphate groups) and that of the water layer are 4.38 and 2.23 nm for Lαphase, while 4.62 and 2.43 nm for Lophase,respectively.Though accurate estimation of electron density profiles of the ripple phase at temperature below 41°C was not possible due to the low resolution of the diffraction peaks of the ripple phase,reliable results of Lophase at temperature below 41°C can be obtained.All the derived thickness of the bilayer(dP-P)and thickness of water layer(dw)are summarized in Table 1.The dP-Pand dwat each temperature represent the average of at least three sample concentrations.
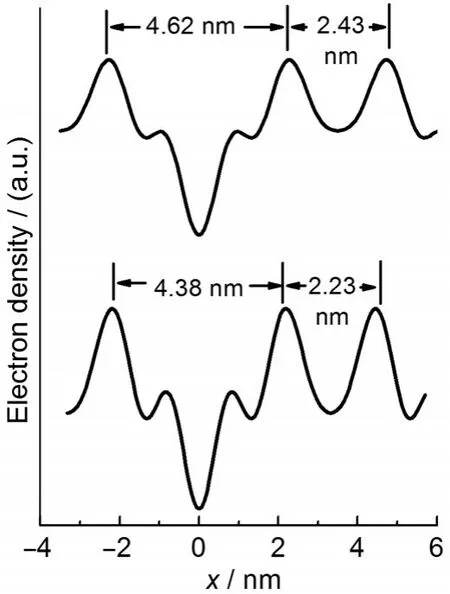
Fig.7 One-dimensional electron density profiles constructed from the XRD patterns for the sterol-poor(lower)and sterol-rich (upper)domains of DPPC codispersions containing 20%(x) stigmasterol at 44°C
Three conclusions concerning the Lophase can be drawn from the data in Table 1.Firstly,the bilayer thickness of Lophase is larger than that of Lαphase at all temperatures.This is consistent with the present understanding that the Lophase is characterized by tight acyl-chain packing and relatively extended acyl chains,while Lαphase is characterized by conformationally disordered acyl chains.6,8,40Atomic force microscopy (AFM)experiment also showed that the bilayer thickness of Lophase is larger than that of Lαphase.41
Secondly,the thickness of water layer of Lophase is larger than that of Lαphase at all temperatures.This is consistent with the published experimental results,which showed that the hydration degree of cholesterol-containing DPPC multibilayers was a little higher than that of pure DPPC.42Therefore,it is reasonable that Lophase has a larger thickness of water layer than Lαphase since the sterol concentration of Lophase is largerthan that of the coexisted Lαphase from 44 to 52°C
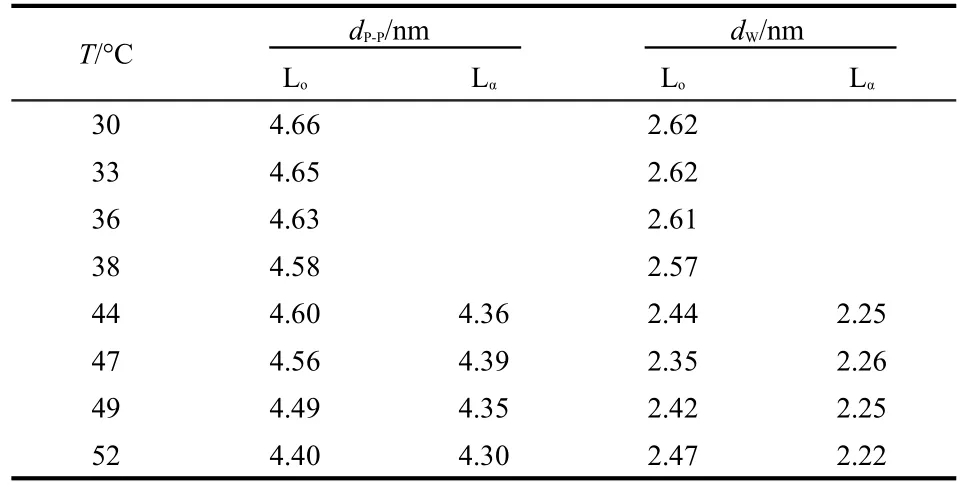
Table 1 dP-Pand dwof Loand Lαphases in the two-phase region at various temperatures
Thirdly,the thickness of bilayer of Lophase decreases slightly with increasing temperature,as shown in inset of Fig.5.Not only temperature,but also sterol concentration influences the bilayer thickness.Due to the fact that the compositions of the Lophase which coexists with a sterol-poor domain at different temperatures are different as defined by the right boundaries of the two-phase regions of Fig.1,the change in dP-Pis the result of changes in both temperature and concentration.According to Fig.4(a),the alkyl chains of Lophase become more disordered with increasing temperature or sterol concentration,so increasing temperature or concentration will decrease the dP-Pvalue.According to Fig.1,the sterol concentration of the right boundary line decreases with increasing temperature up to 40.8°C(the temperature of three-phase line),so the effects of temperature and concentraton on the dP-Pare contrary in this temperature range.The general trend of decreasing dP-Pwith increasing temperature indicates that temperature plays the dominating role.When temperature is above 40.8°C,the sterol concentration of the Lophase increases with increasing temperature,so the effects of temperature and concentraton on the dP-Pare consistent,thus the dP-Pdecreases with increasing temperature more drastically than below 40.8°C.
As shown in Table 1,both dP-Pand dwof Lophase decrease with increasing temperature below 44°C,thus the d-spacings decrease with increasing temperature below 44°C.Also shown in Table 1,though the dwof Lophase increases slightly with increasing temperature above 44°C,the dP-Pof Lophase decreases more drastically,thus the d-spacing decreases with increasing temperature above 44°C.
4 Conclusions
The characters of Lophase of DPPC/stigmasterol codispensions have been studied by XRD technique.The lamellar spacings of Lophase change slightly with the sterol concentration and temperature.Compared with gel and Lαphases,the d-spacings of WAXS of Lophase have a broader range,varying from 0.422 to 0.460 nm in the temperature range from 30 to 52°C, suggesting that Lophase has a diverse range of properties,covering possibly the characters of both gel phase and Lαphase. The electron density profiles show that both the thickness of bilayer and that of water layer of Lophase are larger than those of Lαphase.In addition,the thickness of bilayer of Lophase decreases with increasing temperature.
(1)Sun,R.G.;Zhang,J.;Hao,C.C.;Chen,Y.Y.;Yang,Q.Chem. J.Chin.Univ.2011,32,2062.[孙润广,张 静,郝长春,陈莹莹,杨 谦.高等学校化学学报,2011,32,2062.]
(2) Verma,S.P.Curr.Drug Targets 2009,10,51.doi:10.2174/ 138945009787122851
(3) Orlowski,S.;Coméra,C.;Tercé,F.;Collet,X.Eur.Biophys.J. 2006,36,869.
(4) Szabo,G.;Dolganiuc,A.;Dai,Q.J.Immunol.2007,178,1243.
(5) Schroeder,R.;London,E.;Brown,D.A.Proc.Nati.Acad.Sci. U.S.A.1994,91,12130.doi:10.1073/pnas.91.25.12130
(6) Sharmin,N.A.;Brown,D.A.;London,E.Biochemistry 1997, 36,10944.doi:10.1021/bi971167g
(7) Sinha,M.;Mishra,S.;Joshi,P.G.Eur.Biophys.J.2003,32, 381.doi:10.1007/s00249-003-0281-3
(8) Ipsen,J.H.;Karlstroem,G.;Mouritsen,O.G.;Wennerstroem, H.;Zuckermann,M.J.Biochim.Biophys.Acta 1987,905,162. doi:10.1016/0005-2736(87)90020-4
(9)Almeida,P.F.F.;Vaz,W.L.C.;Thompson,T.E.Biochemistry 1992,31,6739.doi:10.1021/bi00144a013
(10) Brown,D.A.;London,E.Annu.Rev.Cell Dev.Biol.1998,14, 111.doi:10.1146/annurev.cellbio.14.1.111
(11) Brown,D.A.;London,E.J.Membr.Biol.1998,164,103.doi: 10.1007/s002329900397
(12) Simons,K.;Toomre,D.Nat.Rev.Mol.Cell Biol.2000,1,31. doi:10.1038/35036052
(13) Peskan,T.;Westermann,M.;Oelmuller,R.Eur.J.Biochem. 2000,267,6989.doi:10.1046/j.1432-1327.2000.01776.x
(14) Mongrand,S.;Morel,J.;Laroche,J.;Claverol,S.;Carde,J.P. J.Biol.Chem.2004,279,36277.doi:10.1074/jbc.M403440200
(15) Borner,G.H.H.;Sherrier,D.J.;Weimar,T.;Michaelson,L.V.; Hawkins,N.D.Plant Physiol.2005,137,104.doi:10.1104/ pp.104.053041
(16) Dufourc,E.J.J.Chem.Biol.2008,1,63.doi:10.1007/s12154-008-0010-6
(17) Martin,S.W.;Glover,B.J.;Davies,J.M.Trends Plant Sci. 2005,10,263.doi:10.1016/j.tplants.2005.04.004
(18) Demel,R.A.;Kruyff,B.D.Biochim.Biophys.Acta 1976,457, 109.
(19) Mckersie,B.D.;Lepock,J.R.;Kruuv,J.;Thompson,J.E. Biochim.Biophys.Acta 1978,508,197.doi:10.1016/0005-2736 (78)90325-5
(20) Xu,X.L.;Bittman,R.;Duportail,G.;Heissler,D.;Vilcheze,C.; London,E.J.Biol.Chem.2001,276,33540.doi:10.1074/jbc. M104776200
(21) McKersie,B.D.;Thompson,J.E.Plant Physiol.1979,63,802. doi:10.1104/pp.63.5.802
(22) Halling,K.K.;Slotte,J.P.Biochim.Biophys.Acta 2004,1664, 161.doi:10.1016/j.bbamem.2004.05.006
(23) Su,Y.L.;Li,Q.Z.;Chen,L.;Yu,Z.W.Colloid Surf.APhysicochem.Eng.Aspects 2007,293,123.doi:10.1016/ j.colsurfa.2006.07.016
(24)Wu,R.G.;Wang,Y.R.;Wu,F.G.;Zhou,H.W.;Zhang,X.H.; Hou,J.L.J.Therm.Anal.Calorim.2012,109,311.doi: 10.1007/s10973-012-2331-5.
(25) Ohvo-Rekilä,H.;Ramstedt,B.;Leppimäki,P.;Slotte,J.P.Prog. Lipid Res.2002,41,66.doi:10.1016/S0163-7827(01)00020-0
(26) Wu,R.G.;Chen,L.;Yu,Z.W.;Quinn,P.J.Biochim.Biophys. Acta 2006,1758,764.doi:10.1016/j.bbamem.2006.04.017
(27) McIntosh,T.J.;Magid,A.D.;Simon,S.A.Biochemistry 1989, 28,7904.doi:10.1021/bi00445a053
(28)Wu,F.G.;Jia,Q.;Wu,R.G.;Yu,Z.W.J.Phys.Chem.B 2011, 115,8559.doi:10.1021/jp200733y
(29)Gao,W.Y.;Chen,L.;Wu,R.G.;Yu,Z.W.;Quinn,P.J.J.Phys. Chem.B 2008,112,8375.doi:10.1021/jp712032v
(30) McIntosh,T.J.;Simon,S.A.Biochemistry 1986,25,4058.doi: 10.1021/bi00362a011
(31) Quinn,P.J.;Takahashi,H.;Hatta,I.Biophys.J.1995,68,1374. doi:10.1016/S0006-3495(95)80310-3
(32) Yu,Z.W.;Quinn,P.J.Biophys.J.1995,69,1456.doi:10.1016/ S0006-3495(95)80015-9
(33)Gao,W.Y.;Chen,L.;Wu,F.G.;Yu,Z.W.Acta Phys.-Chim. Sin.2008,24,1149.[高文颖,陈 琳,吴富根,尉志武.物理化学学报,2008,24,1149.]doi:10.1016/S1872-1508(08) 60050-9
(34) Clarke,J.A.;Heron,A.J.;Seddon,J.M.;Law,R.V.Biophys.J. 2006,90,2383.doi:10.1529/biophysj.104.056499
(35) Qin,S.S.;Yu,Z.W.Acta Phys.-Chim.Sin.2011,27,213. [秦姗姗,尉志武.物理化学学报,2011,27,213.]doi:10.3866/ PKU.WHXB20110109
(36) Tristram-Nagle,S.;Moore,T.;Petrache,H.I.;Nagle,J.F. Biochim.Biophys.Acta 1998,1369,19.doi:10.1016/S0005-2736(97)00197-1
(37)Gao,W.Y.;Yu,Z.W.Chin.J.Chem.2008,26,1596.[高文颖,尉志武.中国化学,2008,26,1596.]doi:10.1002/ cjoc.200890288
(38) Hui,S.W.;He,N.B.Biochmeistry 1983,22,1159.doi:10.1021/ bi00274a026
(39) Matuoka,S.;Kato,S.;Hatta,I.Biophys.J.1994,67,728.doi: 10.1016/S0006-3495(94)80533-8
(40) Sankaram,M.B.;Thompson,T.E.Biochemistry 1990,29, 10676.doi:10.1021/bi00499a015
(41) Rinia,H.A.;Snel,M.M.E.;Jan,P.J.M.FEBS Lett.2001,501, 92.doi:10.1016/S0014-5793(01)02636-9
(42) Bach,D.;Miller,I.R.Chem.Phys.Lipids 2005,136,67.doi: 10.1016/j.chemphyslip.2005.04.001
