Design and realization of lamp life test instrument
2012-08-13PANDengZHANGYuncuiPIAOTaimingZOUNianyuWANGZhisen
PAN Deng,ZHANG Yun-cui,PIAO Tai-ming,ZOU Nian-yu,WANG Zhi-sen
潘 登, 张云翠, 朴太明, 邹念育, 王智森
(R&D Institute of Integrated Measurement and Control,Dalian Polytechnic University,Dalian 116034,China)
Semiconductor is used as luminescent material for illumination,which has a lot of advantages,such as high efficiency,energy saving,environmental conservation and long life in compatibility temperature,heat emission and power supply.However,the working temperature of Light Emitting Diode(LED)is affected by the thermal resistance and silver coating of crystallite and cooling capacity of base plate.As the working temperature rise up,luminous efficiency of LED will drop.Even more serious,the life of LED lamp will be greatly shortened as thermal breakdown caused by weak heat elimination or strong excitation[1-2].Thus,it is necessary to study the test method and technology of lamp life.
Luminous flux maintenance rate is an important guideline for lamp life test.Lamp life is tested in lab through simulating many kinds of using conditions.With the failure mechanism not be changed,the test can be made by increasing the stress for shortening the test time.And this is called as accelerated life test[3-4].There are two methods to increase the stress:increasing the input voltage/current or ambient temperature.
This paper proposes a lamp life test instrument which can monitor the luminance of lamp and environment temperature in real time as the stress of lamp is changed.The measure data also can be transmitted by wireless communication and stored in the database of host machine.The test program coded in LabVIEW satisfies many requirements for analyzing the characteristic of lamp life.The characteristics of the instrument are shown as follows:
1)Luminance measurement range:1 -65535lx.
2)Luminance measurement accuracy:±5%.
3)Temperature measurement range:-40 to 123.8℃.
4)Temperature measurement accuracy:±0.5℃.
1 Design of Instrument
The instrument system includes a dark box and a host machine.The dark box is used to provide an ideal test environment without interference of extraneous light.It has a door on the front,an antenna on the top,a voltage meter,a current meter,a current adjuster,a measurement unit,a lamp holder,four luminance sensors and a temperature sensor inside,as shown in Fig.1.

Fig.1 Schematic diagram of the dark box
The voltage/current adjuster is used to set the input voltage or current of lamp.And the input voltage and current can be checked by the voltage meter and current meter,which can protect the voltage and current from exceeding the maximum limit of lamp.The lamp holder is suitable for incandescent lamp,fluorescent light,high-voltage sodium lamp,mercury lamp,deuterium lamp,metallic halide lamp and so on.
Four luminance sensors,one temperature sensor and one antenna are connected to the measurement unit,which is available for receiving test command sent out by host machine and returning the measurement data back.The measurement unit is constituted of MCU,peripheral circuit and short distance wireless communication module.High resolution environment photometric brightness sensor chip BH1750GLI is built in the luminance sensor.Temperature Sensor is made by SHT 10 series SMT temperature and humidity sensor chip.MCU&peripheral circuit is used to achieve a series of control function,such as collection interval,data reading,data sending and system state information acquisition.The schematic drawing of measurement unit with sensors is shown in Fig.2.

Fig.2 Schematic drawing of measurement unit with sensors
As shown in Fig.3,the workflow of the instrument is as follows:
1)As the test program runs in the host machine,the command for acquiring luminance and temperature data in dark box is sent out through the wireless communication module and antenna at regular intervals(the interval can be set as several minutes).
2)The antenna on the dark box receives the command,and transmits it to the measurement unit.Next,the command is processed by the measurement unit,and the task of measuring luminance and temperature is executed once.
3)The original data is reconstructed into NULL terminated 10 bytes string.Then,it is transmitted to the side of the host machine.The string is processed by test program and divided into four luminance numbers and one temperature number which will be stored into the database.
2 Functional Design of Host Machine Program
The aging of lamp needs a long period.In order to obtain the failure time accurately,the luminance which reflects the changes of luminous flux should be measured and recorded continuously.Thetemperature which reflects the working conditions of the lamp also should be measured and recorded incessantly.These data is stored in table TestData of the database with test ID,lamp ID and current date& time.There are another three tables in the database:UserData,LampData and OtherInformation.

Fig.3 Schematic drawing of instrument
The table UserData records the basic information of user,and its columns are User-ID,UserName,Password,Authority,Login-Times,Error and Last-Error-Date.The table LampData is used to store the information and parameters of the lamp,its columns are Lamp-ID,Lamp-Name,Lamp-Model,Lamp-Power,Lamp-Num,Lamp-Current,Lamp-Voltage,Lamp-Efficiency,Lamp-Lux and Lamp-Picture.The table OtherInformation contains columns as Lamp-ID,Submission-Unit,Submission-Person,Reception-Person,Test-Person,Test-Date and Test-Plan which can be input during the test program running.
The test program is designed in LabVIEW,which is a kind of Software Development Kit(SDK)based on graphical program language,which has a set of library function of data acquiring,analyzing and storing and senior signal analysis tool,and is integrated with development,debugging and executing functions.It is able to improve development efficiency and shorten development cycle by using high integrated LabVIEW developing environment[5].
The test program design flow chart is shown in Fig.4.The overall structure of the test program adopts state machine pattern.There are three while loops in the program chart:main loop,event handling loop and display loop as shown in Fig.5.The main loop is used to execute data processing,database operation and report generation.The event handling loop responses the user’s mouse or keyboard operation.The display loop generates the data curve.They are connected and controlled by the queue structure.There are also three queues:main queue,display queue and equipment queue.
The main interface of the test program is shown in Fig.6.The user should login firstly from the menu of the program.Then,the test interval and serial port Number for communicating with wireless communication module can be set.When all work is done,push down the start button and then test will begin.In the measurement result region,the data curve is plot at real time.So people could visually watch the changes of luminance and temperature in dark box.And the data stored in database can be extracted for further analysis,such as calculating average value of the data detected by one luminance sensor and plotting the average values into a curve,and so on.The test program also can generate test report in accordance with the predefined template.
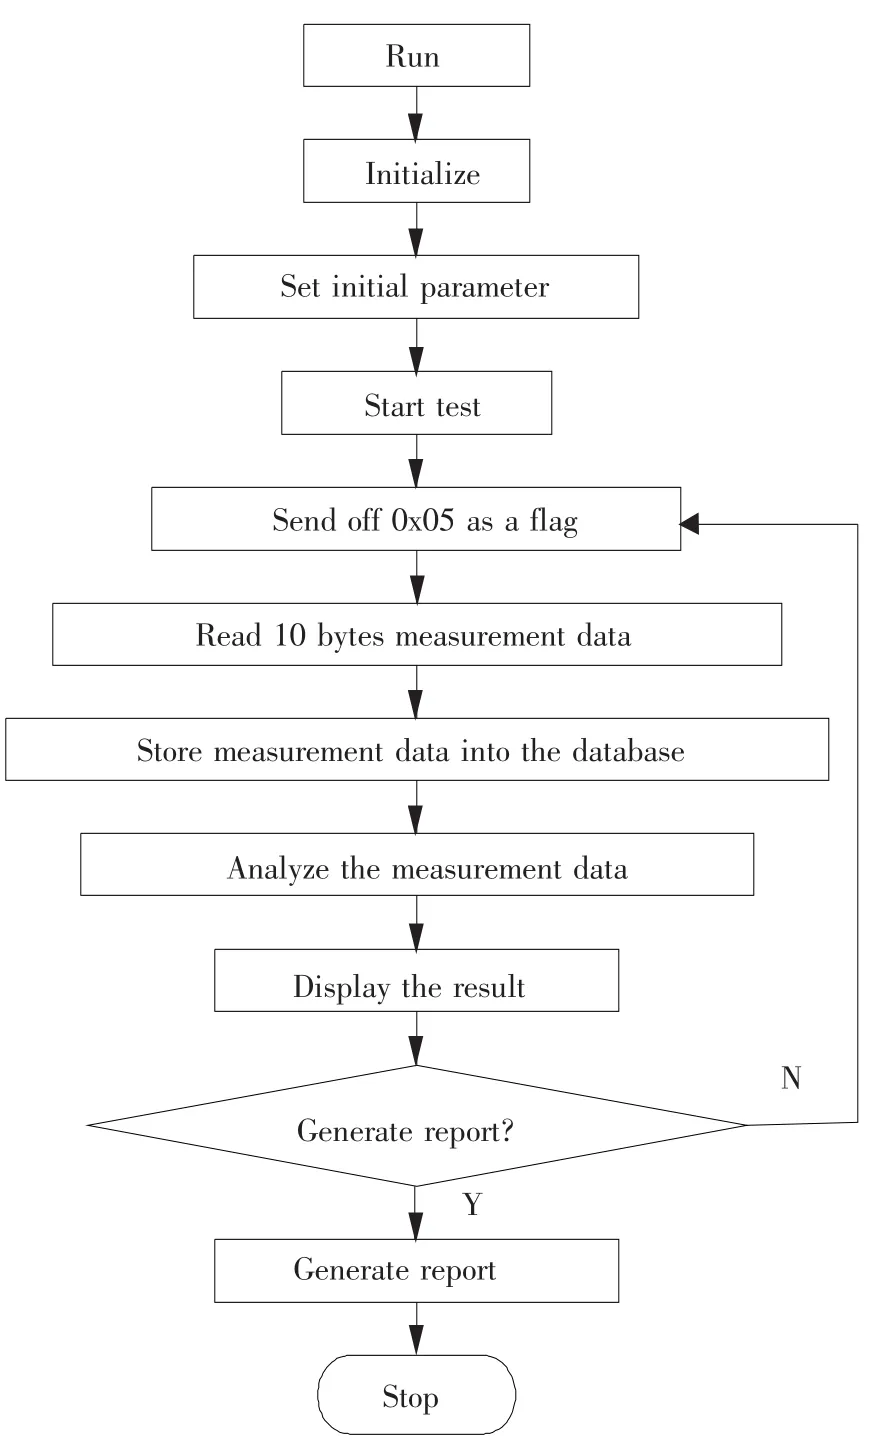
Fig.4 Test program design flow chart

Fig.6 Main interface of the test program
3 Experiment Data Processing
In this experiment,four luminance sensors simultaneously record the luminance data on the points chosen to represent the typical value around the light source.The method of testing lamp life by the instrument has five important steps shown as follows:
1)Select and kick out the ineffective samples from the test samples.
2)Group the samples after confirming the mount of samples,ensuring the same test parameters.
3)Initially aging test in 1000 h and take the luminance at the point of 1000 h as the initial value.
4)Record the luminance of the lamp every 100 to 300 h,till the total test time 6000 h.
5)If the lamp is still work via working test for 6000 h,calculate the expect life of 70%luminance.
Based on physical characters of LED,the life formula can be expressed as follows,

where P0and Ptrepresent the optical power of the light source at initial and t(Unit:hour)respectively.The luminance detection can represent optical power for certain distance between the lamp and detector.For the data processing,two methods can be chosen in the different conditions for the life will or will not reach.
Condition 1:If luminance attenuates to 70%before time point is reached,the average life is calculated as

Condition 2:If luminance does not attenuate to 70%before time point is reached,the lamp life can be deduced by Eq.(1),in which the coefficient β is identified according to the initial luminance E0and Et(t=6000 h).The average coefficient β is calculated by using four testing points β as follows

Because four testing points are used in this experiment,the error of lamp life can be calculated by the following equation.

4 Conclusions
In this paper we propose development technology of lamp life test instrument,which is based on wireless communication,sensor and LabVIEW programming.It resolves the problem that nowadays lamp life test is lack of standard and special instrument.Using wireless communication module,the Communication wires and cables at the scene can be decreased and the mobility of instrument can be raised.In the designation of test program,LabVIEW can afford concise,objective and easy to use program mode,and state machine structure can strengthen scalability and readability of the program.The lamp life test instrument is marked by continuity and convenience of test procedure.It is possessed of popularization and application value,and has an active meaning for the research on development technology of lamp life test.
[1]Zhang Yuncui.Test research of semiconductor lighting products.Information Technology& Standardization Journal,2009,(10):62 -64.
[2]Zhao Ying.A summary of LED lighting technology standards.Information Technology & Standardization,2009,(4):10-14.
[3]Zhao Min,Zhang Wansheng,Xu Lisheng.Research on the method of LED life test.Proceedings of Eleventh National LED Industry and Technology Workshop.2008.17-38.
[4]Zhao Min,Zhang Wansheng,Xu Lisheng.The study of the LED’s accelerated life test method.Information Technology& Standardization,2009,(5):17-21.
[5]Wang Qiaobin.The development of characteristics detection system for LED lighting source based on LabVIEW.Chinese Journal of Luminescence,2009,30(4):509 -514.
[6]Rao Liang.LED life detection system based on ZigBee wirelessmodule. Instrumentation Technology, 2009,(5):12-14.
[7]Trevisanello L.Accelerated life test of high brightness light emitting diodes.IEEE Transactions on Device and Materials Reliability,2008,8(2):304-310.
杂志排行

Journal of Harbin Institute of Technology(New Series)的其它文章
- Journal of Harbin Institute of Technology(New Series)
- A modeling method of microburst based on multiple vortex ring
- Remediation of static lake water by intensified filter of dominant bacteria colony
- An innovative detection method of high frequency BPSK signal with low signal-to-noise ratio
- A reliable and high throughput hybrid routing protocol for vehicular ad-hoc network
- Research on the Seebeck effect in efficient turning process and improving tool life