Modeling of Fatigue Crack Growth Closure Considering the Integrative Effect of Cyclic Stress Ratio,Specimen Thickness and Poisson's Ratio
2012-01-20LIUJiantaoDUPinganLIUXiaobaoandDUQiang
LIU Jiantao*,DU Pingan,LIU Xiaobao,and DU Qiang
College of Mechanical and Electronic Engineering,University of Electronic Science and Technology of China,Chengdu 611731,China
1 Introduction
Key components of large structures,such as space probe,aeroplane,watercraft and so on,often cause fatigue problems due to the periodical loading and lead to catastrophic failures[1-3].Hence,how to predict the rule of FCG process effectively and estimate the fatigue life accurately becomes one of the most important contents for scientific research and reliability design.
Fatigue crack growth curve typically includes three regions under constant amplitude (CA) loading[4].FCG rates in regionⅠare mainly affected by the microstructural characteristics,surface roughness,debris,Rratio,crack shape and length,and environmental conditions[4-7].The primary influence factors of RegionⅡlie inRratio,loading frequency,specimen thickness,material characteristics and environmental conditions[6-9].Region Ⅲis largely affected byRratio,component thickness,material microstructure and environmental conditions[7-10].Since environmental conditions and material properties are similar for the same kind of structures,FCG rates are mainly affected by the component parameters and loading characteristics.A series of work[4-10]indicates that specimen thickness andRratios have significant influence on FCG rates,while some controversies exist in the literature about the effect[11-15].Shahinian[11]pointed out that specimen thickness has no or negligible effect on FCG rates.PARK,et al[12],COSTA,et al[13]and CHANG,et al[14]indicated that specimen thickness accelerates FCG rates with the specimen thickness increasing.JACK,et al[15]stated that specimen thickness reduces FCG rates with the specimen thickness increasing.A similar situation is found with the influence ofRratio on FCG rates[10].Obviously,the specimen thickness andRratio have an interactive effect on FCG rates.The physical rule of FCG process can be obtained only by taking the effect of specimen thickness andRratio into consideration simultaneously.
This paper mainly aims at investigating the integrative effect of specimen thickness,Rratio,material properties and so forth on FCG rates and developing a new model with more extensive applicability.At first,the physical rules of crack opening ratio (γ) and effective stress intensity factor range ratio (U) with respect to specimen thickness,Rratios and Poisson's ratio are analyzed systemically with the existing models.Then,a relative thickness of specimen is defined to describe the influence of specimen thickness and material properties on FCG rates conveniently.Moreover,a new model (IIF) is put forward based on the plasticity-induced crack closure theory and the physical rules indicated by the experimental results.The IIF model considers the interactive effects of several influence factors,including specimen thickness,cyclic stress ratio,Poisson's ratio,the maximum applied stress and so forth.Finally,a number of experimental results with various materials,thicknesses andRratios are used to validate the IIF model.
2 Influence of Specimen Thickness,R Ratio and Poisson's Ratio on Fatigue Crack Growth
The following parameters are defined for the afterward analysis:
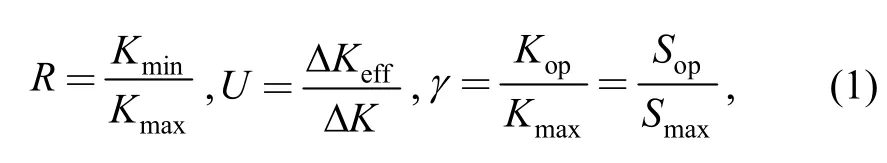
whereRis the cyclic stress ratio,Kmaxis the maximum stress intensity factor (SIF),Kminis the minimum SIF,Kopis the crack opening SIF,ΔKis the SIF range,ΔKeffis the effective SIF range.Similar definitions apply to the stresses and their ranges.
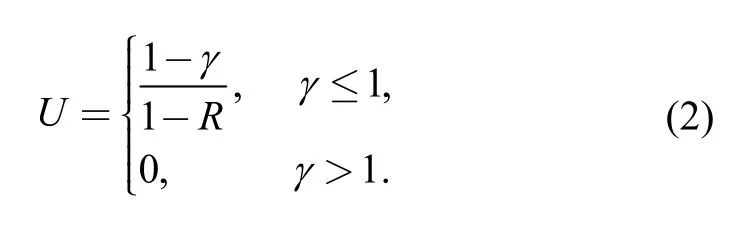
The following relation exists among the parameters above:
2.1 Influence of specimen thickness on FCG rates
According to the plasticity-induced crack closure theory and the retardation phenomenon after the overload[9-11],FCG rates are largely influenced by the plastic zone size in front of the crack tip.Moreover,the plastic zone size is mainly dependent upon the specimen thickness besides the material properties and loading conditions.With the specimen thickness increasing,the stress state changes from being largely plane stress to being plane strain dominant and the plastic zone size becomes smaller gradually.
CHANG,et al[14],proposed an integral equation for plastic zone size based on the three-dimensional strip yield model and defined the plastic zone size for small scale yielding case as follows:

whereμis the Poisson's ratio andσsis the material yield strength.
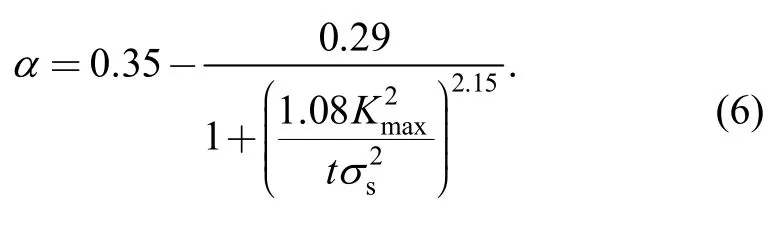
VOORWALD,et al[16],considered all constraints(maximum applied stress,material yield strength and specimen thickness) around the crack tip and presented another parametric function forα:
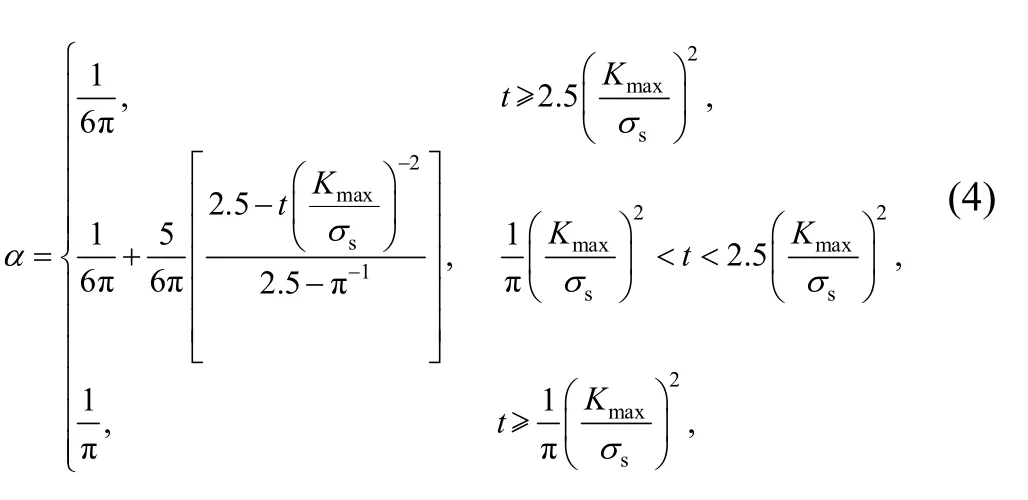
wheretis the specimen thickness.
GUO,et al[17]and ZHANG,et al[18],studied the fatigue crack closure effect by theoretical analysis and introduced a constraint factor to account for the thickness effect on FCG process:
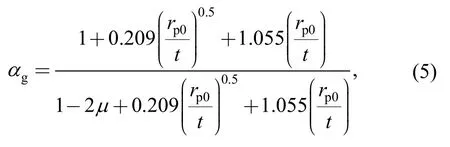
whererp0is the plastic zone size.
HUANG,et al[19],obtained a new continuous function ofαby theoretical analysis and finite element calculation:
Since Eqs.(4)-(6) neglect the influence of Poisson's ratio,the following general function ofαis established in this paper by fitting the theoretical results under both of the plane stress state and the plane strain state and the finite element analysis results:
Eq.(7) considers the integrative effect of specimen thickness,Poisson's ratio and the maximum applied load on the plastic zone size and gives an explicit continuous expression between the plastic zone size and specimen thickness.Furthermore,several experimental results are used to verify the correctness and validity of Eq.(7),which shows great consistency.
2.2 Influence of R ratio on FCG rates
Rratio,which is often described by parameterUorγ,is another important influence factor for FCG rates.Lots of experiential equations ofUwith various kinds of materials have been proposed.However,most of these equations regardUas a function ofRratio onlly and can not reflect the integrative effect of specimen thickness,Poisson's ratio and so forth explicitly.
CODRINGTON,et al[10],obtained an experientialUexpression based on the deduction of the strip-yield model and distributed dislocation technique:
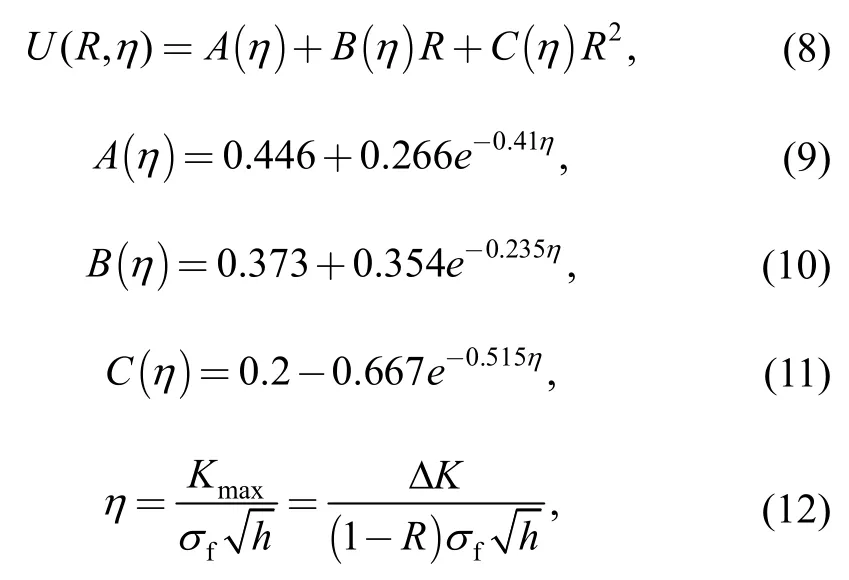
wherehis half of the specimen thickness,σfis the flow stress and defined as
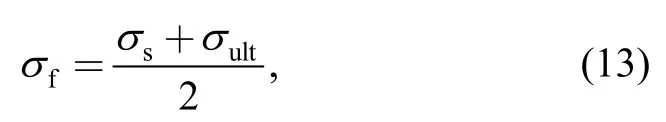
withσultthe ultimate tensile strength.
COSTA,et al[13],presented another experiential equation forUby analysis of the experimental data with CK45 steel:
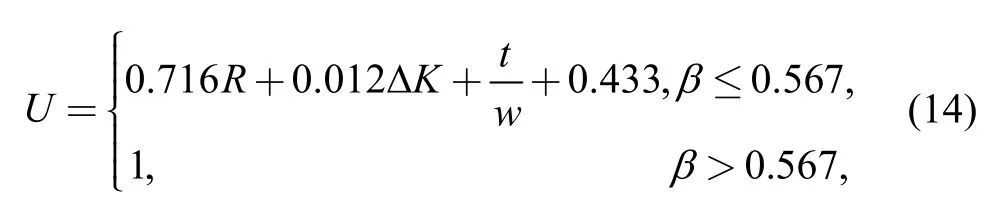
whereβ=0.716R+0.0121ΔK+0.144(t/w),wthe specimen width.
NEWMAN,et al[21-22],put forward a model of crack opening ratioγbased on the crack closure theory[22]:
The coefficients are defined as follows,whenSo≥Smin:
The constraint factorβis closely related to the specimen thickness and largely affected by the plastic zone size and reversed plastic zone size.
Recently,HUANG,et al[23],considered the influence of the plastic zone size and the overloading effects onγand presented another equation forβ:
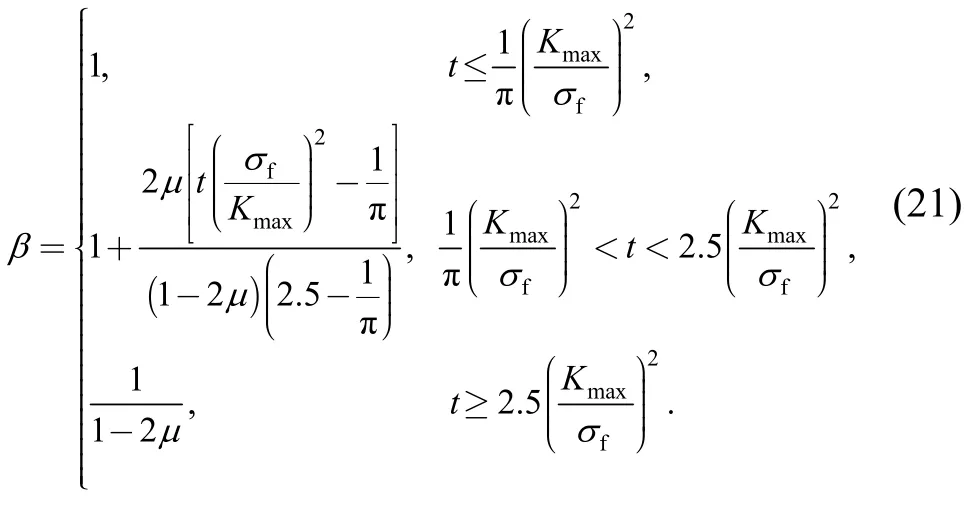
Observations from Eqs.(8)-(21) suggest thatγvalue andUvalue be mainly affected byRratio,specimen thickness and Poisson's ratio simultaneously.In addition,both of the plane stress state and plane strain state exist in finite-sized structures.Hence,how to determine the constraint factorβunder different states effectively owns much significance for fatigue life prediction and FCG process modeling.
2.3 Influence of Poisson's ratio on FCG rates
Figs.1 and 2 show the curves of crack opening ratioγversusRratio with previous models and the theoretical results in Ref.[10].
The following conclusions are drawn accordingly:
(1) HUANG's model and NEWMAN model can describe the influence ofRratios onγeffectively in the whole region from -1.0 to 1.0.Moreover,HUANG's model and NEWMAN model are totally superposed with each other under both of the plane stress state and plane strain state withμ=1/3.
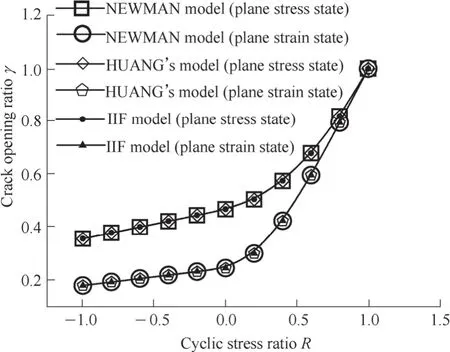
Fig.1.Curves of γ versus R ratio with μ=1/3
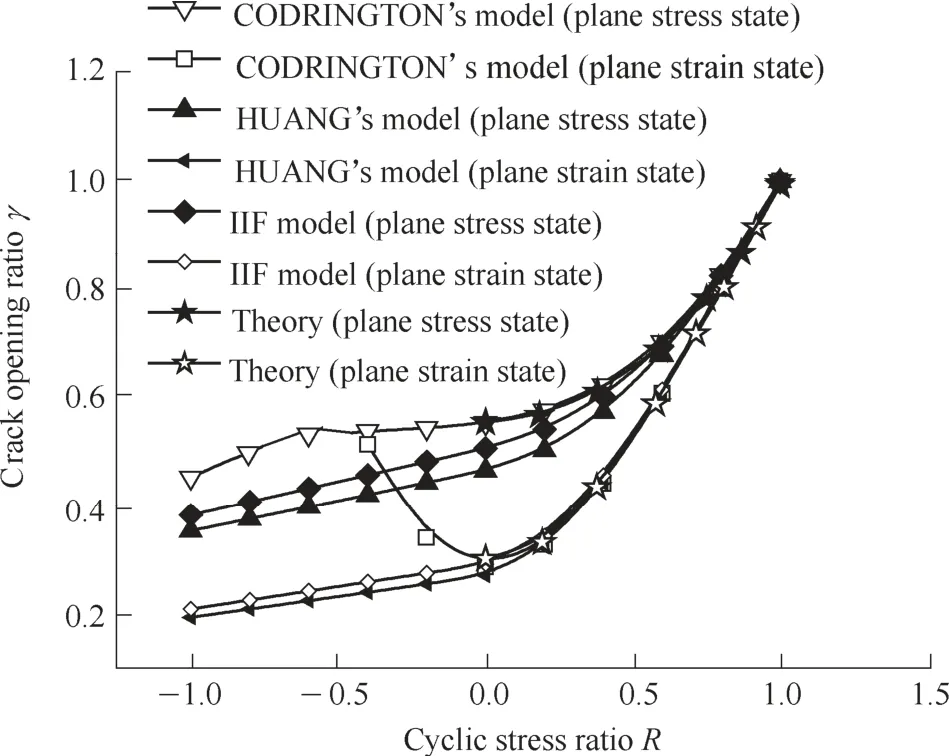
Fig.2.Curves of γ versus R ratio with μ=0.3
In Fig.2,HUANG's model is superposed with the NEWMAN model under the plane stress state withμ=0.3.Whereas,under the plane strain state,predictions by HUANG's model is higher than NEWMAN model due to the influence of Poisson's ratio.
(2) Both curves depicted by HUANG's model and NEWMAN model withμ=0.3 under the plane stress state is lower than the theoretical curve in Ref.[10].The main reason lies in that both of HUANG's model and NEWMAN model neglect the Poisson's ratio effect under the plane stress state.
HUANG's model fits pretty well with the theoretical results in Ref.[10]in highRratio region under the plane strain state whenμequals0.3.Whereas the error between HUANG's model and theoretical results increases with theRratio decreasing due to the integrative effect of Poisson's ratio andRratio.
(3) CODRINGTON's model is totally consistent with the theoretical curves withμ=0.3 under both plane stress and plane strain conditions when 0≤R<1.But it gives wrong results in the case of negativeRratios due to the quadratic approaching function,which is against the physical rules.
In brief,NEWMAN model and the theoretical curves represent the physical rules ofγwithμ=1/3 andμ=0.3,respectively.
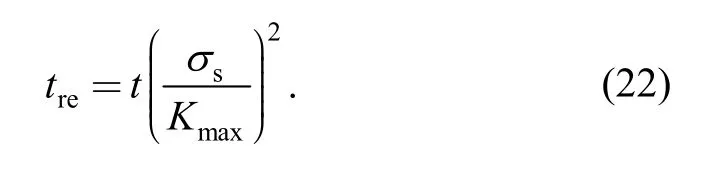
As indicated by Eqs.(4)-(7) and (21),parametercan describe the physical rules ofUandγeffectively.Hence,the relative thickness of specimen is defined as
Figs.3-6 show the rule ofUversus the relative thickness.According to these curves,NEWMAN model defines the upper and the lower boundaries ofUwithμ=1/3.

Fig.3.Curves of U versus treunder R=0.2 with μ=1/3
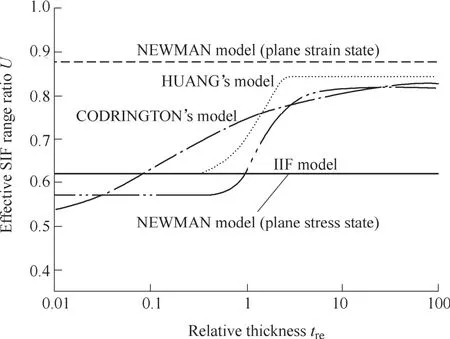
Fig.4.Curves of U versus treunder R=0.2 with μ=0.3
HUANG's model improves NEWMAN model,considers the Poisson's ratio effect under the plane strain condition and uses linear interpolation function to gain theUvalue with different thicknesses.Whereas the linear approaching effect is very limited and could not describe the physical rule ofUeffectively according to the theoretical results in Ref.[10]and the experimental results in Ref.[13].
CODRINGTON's model uses exponential function to approach the changes ofUfrom the plane stress state to the plane strain state under variousRratios withμ=0.3 and gives more accurate results.The disadvantage of this model lies in that theUvalue tends to be much smaller with the specimen thickness decreasing,which is inconsistent with the test results.
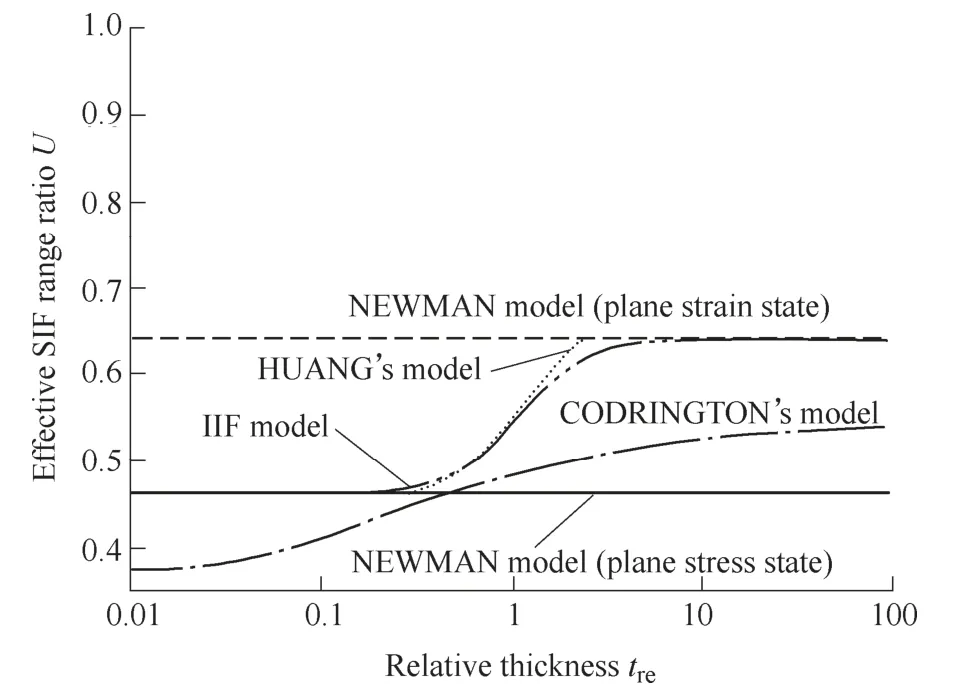
Fig.5.Curves of U versus treunder R=-0.2 with μ=1/3
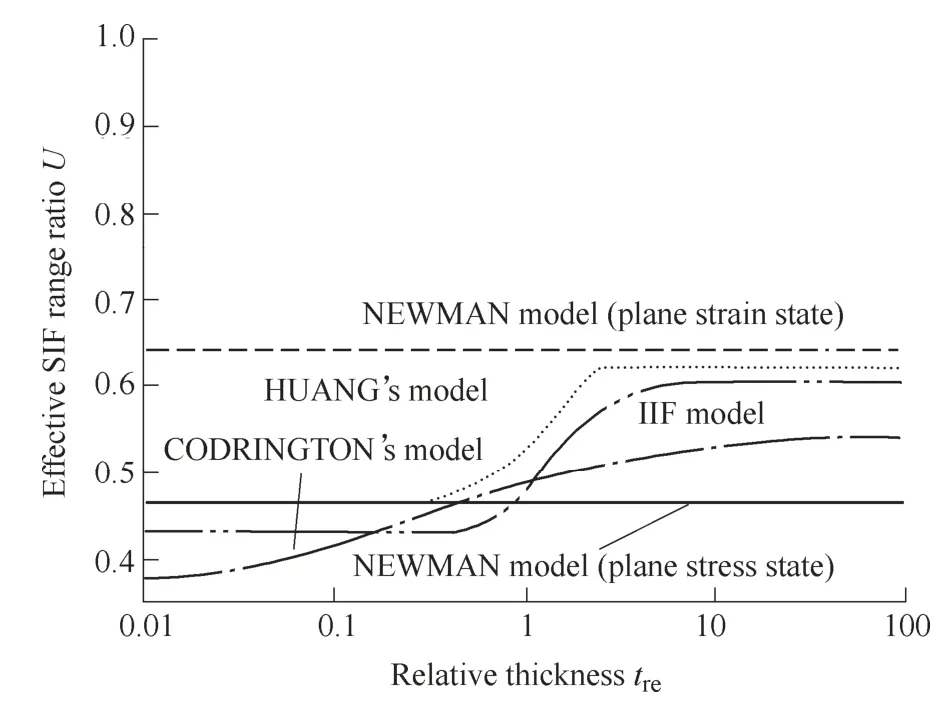
Fig.6.Curves of U versus treunder R=-0.2 with μ=0.3
More parts of HUANG's model will be superposed with CODRINGTON's model whenRratio takes larger value.The main reason lies in that CODRINGTON's model is totally consistent with the theoretical result,while HUANG model is only consistent with the theoretical result in highRratio region.
3 Modeling of the Integrative Effect of R Ratio,Specimen Thickness and Poisson's Ratio on Fatigue Crack Growth Rates
According to the previous analysis,the IIF model should consider the integrative effect ofRratio,specimen thickness and Poisson' sratio simultaneously and describe the changes ofUversus thickness andγversusRratio continuously and explicitly.Hence,the IIF model will be developed based on NEWMAN model and considers the previous integrative effects.
3.1 Boundaries of the constraint factor β in consideration of Poisson's ratio
The following equations can be obtained by previous analysis and the theoretical results in Ref.[10]:
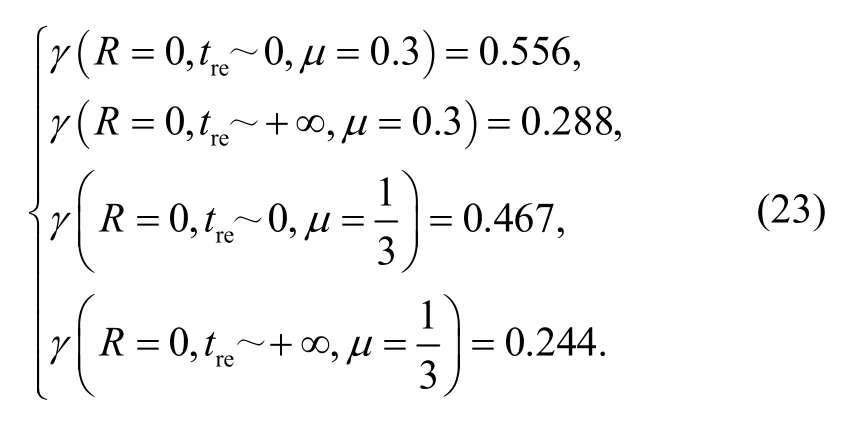
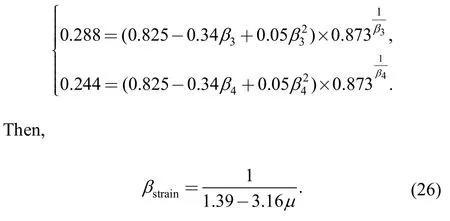
Eq.(23) gives the upper and lower boundaries ofγwithμ=0.3 andμ=1/3 under both of the plane stress state and the plane strain state,respectively.The following formulation ofβis constructed based on HUANG's model[19]:
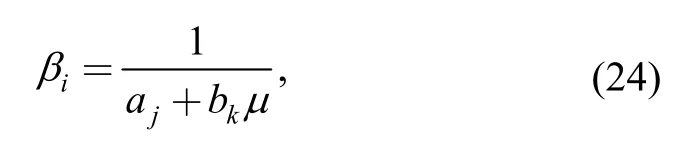
whereβiis the constraint factor under different conditions,i=1-4.ajandbkare the coefficients to be determined,j=1,2,k=1,2.
Expression ofγunder the plane stress state can be obtained by substituting Eqs.(15)-(20) and (24) into Eq.(23):
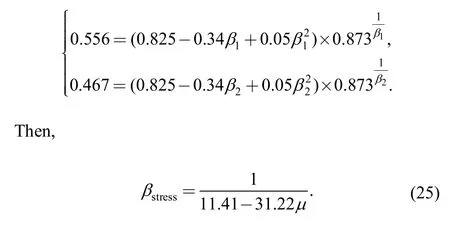
Similarly,expression ofγunder the plane strain state can be further expressed as
Up to now,boundaries of the constraint factorβconsidering the Poisson's ratio effect are obtained.
3.2 Modeling of the changes of β versus specimen relative thickness
The IIF model for parameterβtakes the following form based on the previous analysis:
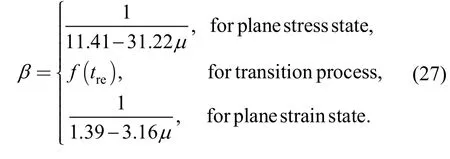
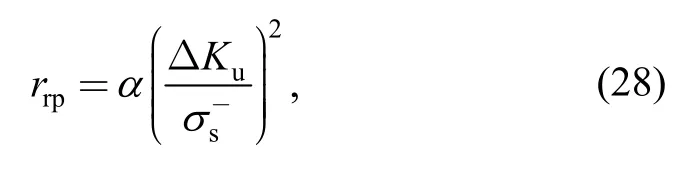
As indicated by the Refs.[17-18,22-24],crack opening stress is mainly affected by the plastic zone and reversed plastic zone around the crack tip.The reversed plastic zonerrpis defined as follows[19]:
Hence,the influence of specimen thickness,material properties and loading characteristics on parametersβcan be established by mapping the relationship from Eq.(7) to Eq.(27).Accordingly,the continuous expression of IIF model is defined as
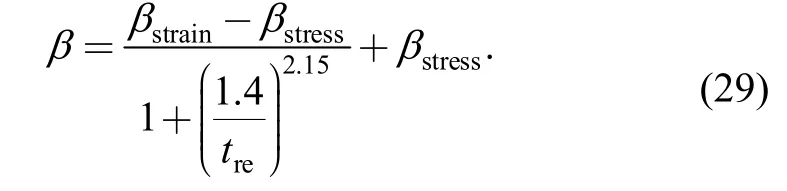
The specimen tends to be plane stress state when the relative thicknesstreapproaches to 0 and the constraint factorβapproaches toβstress;the specimen is nearly under the plane strain condition when thetrevalue is greater than 10,and the constraint factorβapproaches toβstrain.
3.3 Simplification of the parameters for relative thickness expression
The maximum SIF of center crack specimen is written as follows[3]:
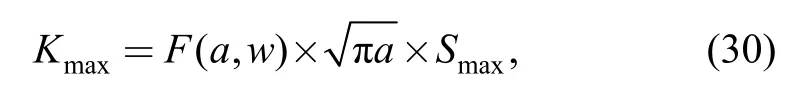
whereais half of the crack length;F(a,w) is the geometric function and defined as[27]
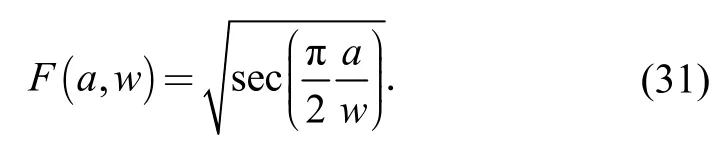
Eqs.(30)-(31) suggest thatKmaxis related to crack length,specimen width and the maximum applied load.Furthermore,Kmaxincreases dramatically when the ratioa/wapproaches to 1.0.Accordingly,γalso increases dramatically asa/wapproaches to 1.0 based on Eqs.(14)-(19) and (28)-(30).However,experimental results in Refs.[25]and [26]indicate thatγchanges dramatically near the initial crack lengtha0and approaches to be a constant after some cycles of loading or when the crack length is longer than 2a0.Hence,the relative thickness equation should be independent ofa/wratio.Here,the relative thicknesstreis further defined as follows:
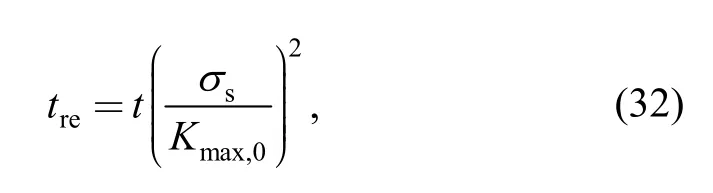
whereKmax,0is a parameter only related to the maximum applied stressSmaxand material properties,and is further regarded as
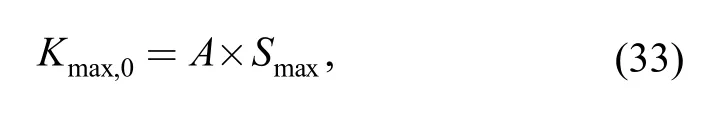
whereAis a constant related to material properties merely and can be determined by the fatigue test data.
Substituting Eq.(29) into Eq.(25) gives

Since some existing models use the flow stressσfto describe the influence of specimen thickness,a strength ratio is defined to compare the predictions conveniently:

Then,Eq.(34) can be further expressed as follows:
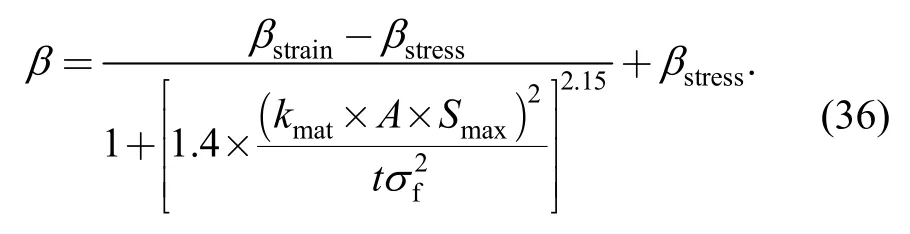
As expressed by Eqs.(34) and (36),the IIF model considers the integrative effect of Poisson's ratio,specimen thickness,Rratio and so forth on parameterUandγ,and reflects the influence of these factors explicitly.
4 Validation of the IIF Model with Existing Models
This part mainly concentrates on the validation of the IIF model with existing models.
4.1 Validation of the IIF model with crack opening ratio γ
Figs.1 and 2 describe the changes ofγversusRratio withμ=1/3 andμ=0.3,respectively.
(1) Curves by HUANG's model,NEWMAN model and the IIF model withμ=1/3 in Fig.1 are totally superposed with each other,which indicates that the IIF model describes the physical rules ofγeffectively in the wholeRratio region under both of the plane stress state and plane strain state.
(2) Predictions by the IIF model fit pretty well with the theoretical results in the highRratio region under the plane stress condition in Fig.2.Though the predictions in the lowRratio region are a little smaller than the theoretical results due to the deficiency of Eq.(15),the approaching effect is better than HUANG's model.Moreover,the IIF model and the theoretical results withμ=0.3 fit very well with each other in the wholeRratio region under the plane strain condition.
In short,the IIF model describes the rules ofγversusRratio correctly and more effectively.
4.2 Validation of the IIF model with effective stress intensity factor range ratio U
Figs.3-6 show the curves ofUversus the relative thicknesstreunder differentRratios withμ=1/3 andμ=0.3,respectively.
(1) Predictions by the IIF model fit pretty well with Huang's model and are totally superposed with NEWMAN model under both of the plane stress and plane strain conditions whenμequalsμ=1/3.The main reason lies in that the IIF model considers the integrative effect ofRratio,specimen thickness and Poisson's ratio.
Moreover,the IIF model adopts the exponential function to describe the changes ofUversustre,which is consistent with the experimental results in Ref.[13]and gives more accurate results than HUANG's model.
(2) Both HUANG's model and NEWMAN model neglect the influence of Poisson's ratio onUunder the plane stress condition,which results in the total superposition of the curves whenμequals 0.3 in Figs.4 and 6.Furthermore,HUANG's model considers the effect of Poisson's ratio onUunder the plane strain condition,which leads to the smaller predictions compared to NEWMAN model.
The IIF model considers the influence of Poisson's ratio under both of the plane stress state and plane strain state.Thus,the predictions by IIF model are consistent with the theoretical results and smaller than the NEWMAN model whenμ=0.3.Meanwhile,some error exists between Huang's model and the theoretical results in the lowRratio region,which leads to the larger predictions of theUvalue by Huang's model compared with the IIF model.
To sum up,the IIF model considers the integrative effect ofRratio,specimen thickness and Poisson's ratio on the changes ofUandγ,overcomes the disadvantages of existing models and depicts the changes ofUandγversusRratio effectively in the whole region with different Poisson's ratios.
5 Validation of the IIF Model with Test Data
The test data in Ref.[28]are used to validate the IIF model and the NASGRO model[28]is used to describe the whole process of FCG rates:whereC,n,pandqare model coefficients,ΔKthis the cracking threshold range,KICis the material fracture roughness.
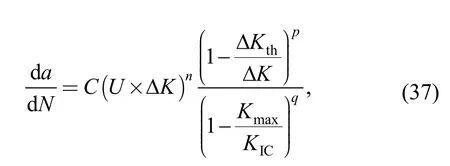
The material parameters are listed in Table 1[28]and the model coefficients of Eq.(37) are listed in Table 2.The Poisson's ratios for these materials are set to be 0.33 according to Ref.[29].The cracking threshold range ΔKthand fracture roughnessKICare calculated with the experiential equation in Ref.[28].Figs.7-12 show the test results and the predictions by the IIF model.

Table 1.Material parameters
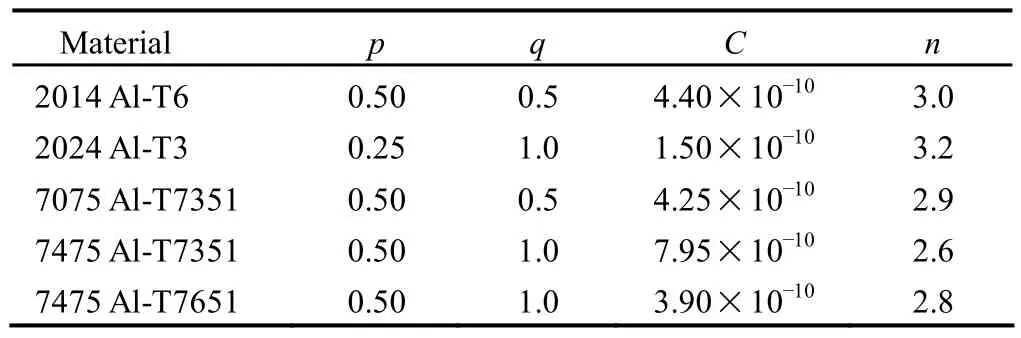
Table 2.Model coefficients
Symbol“※”in Figs.7-12 represents the experimental results obtained by several specimens with different thicknesses under the sameRratio.
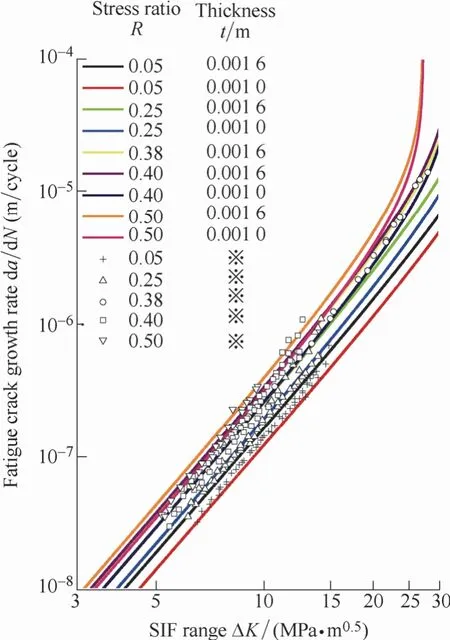
Fig.7 Curves of da/dN versus ΔK with 2014 Al-T6

Fig.8.Curves of da/dN versus ΔK with 2024 Al-T3(R>0)
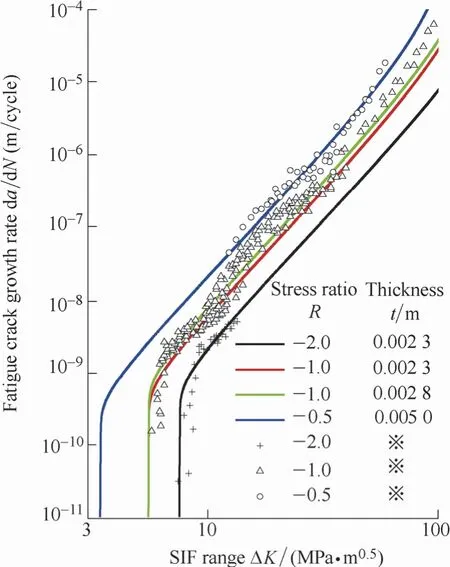
Fig.9.Curves of da/dN versus ΔK with 2024 Al-T3(R<0)
According to the test data and the predictions above,the IIF model describes the whole process of FCG rates from the cracking threshold to the critical fracturing point effectively with explicit expression of Poisson's ratio and specimen thickness,and eliminates the needs for empirical correction factors.
Most of the test data shown in Figs.7-12 are situated on the predicted curves or between the two predicted curves that represent the different specimen thicknesses under the sameRratio,which indicates that the IIF model can describe the influence of specimen thickness on fatigue crack growth rates effectively.
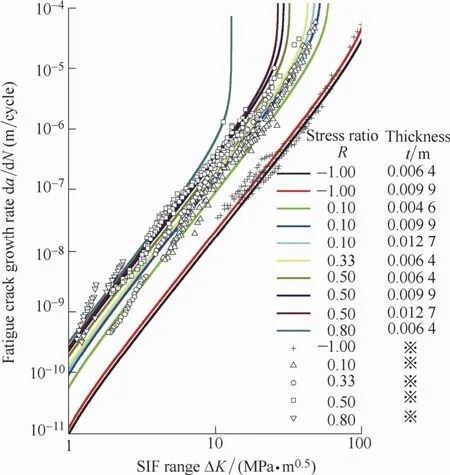
Fig.10.Curves of da/dN versus ΔK with 7075 Al-T7351
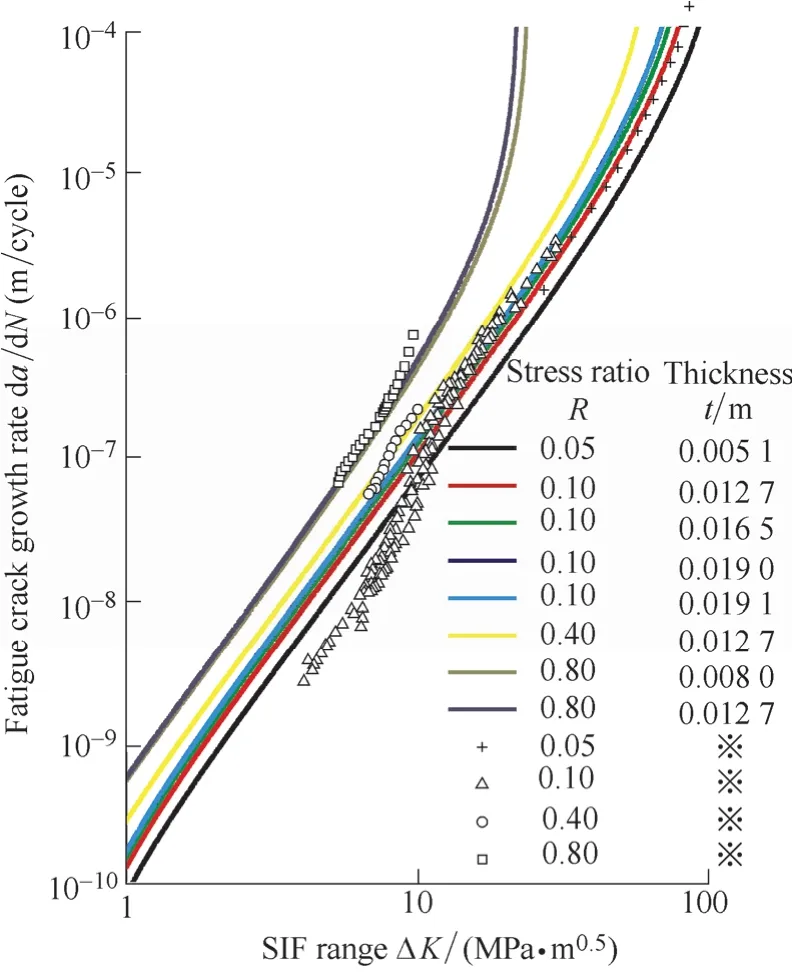
Fig.11.Curves of da/dN versus ΔK with 7475 Al-T7351
Some of the experimental results slightly departure from the predictions due to the surface roughness,uneven material properties,errors in testing and measurement,uneven distribution of specimen thicknesses and so forth.
The model coefficientsAin Eq.(33) are listed in Table 3
The coefficientAis closely related to the material properties and has a small variation range for different materials.Moreover,it is a constant for the same material according to the data above and determines the transition process from the plane stress state to the plane strain state.
6 Conclusions
(1) A new model named IIF model is developed to account for the integrative effect ofRratio,Poisson's ratio,specimen dimensions and so forth on the fatigue crack growth closure.It adopts the exponential function to approach the changes ofUfrom the plane stress state to the plane strain state,and makes a more accurate and explicit description of the influence of Poisson's ratio,specimen thickness,Rratio and so forth onUandγ.
(2) The relative thickness of specimen is defined to describe the influence of specimen thickness and material properties on FCG characteristics conveniently.It provides a general parameter to depict the fatigue property of different materials with various thicknesses under different loading conditions.
(3) The IIF model eliminates the needs for empirical correction factors by fatigue test,and provides a more convenient tool for fatigue life estimation and failure analysis.
(4) The fatigue properties of real components can be estimated by substituting the material parameters,specimen dimensions and other coefficients into the IIF model.It is very helpful for fatigue experiment design and specimen choosing.

Fig.12.Curves of da/dN versus ΔK with 7475 Al-T7651
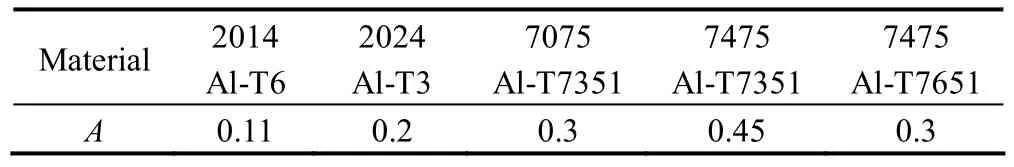
Table 3.The coefficient A of the IIF model
[1]METHEE C,AMJAD J A,SREENIVAS A.Dynamic and fatigue response of a truss bridge with fiber reinforced polymer deck[J].International Journal of Fatigue,2007,29(8):1 475-1 489.
[2]WANG B,SIEGMUND T.A numerical analysis of constraint effects in fatigue crack growth by use of an irreversible cohesive zone model[J].International Journal of Fracture,2005,132(2):175-196.
[3]LIU J T,DU P A,HUANG M J,et al.New model of propagation rates of long crack due to structure fatigue[J].Applied Mathematics and Mechanics,2009,30(5):575-584.
[4]ZHAO T W,ZHANG J X,JIANG Y Y.A study of fatigue crack growth of 7075-T651 aluminum alloy[J].International Journal of Fatigue,2008,30(7):1 169-1 180.
[5]RAY A,PATANKAR R.Fatigue crack growth under variable-amplitude loading:part I-model formulation in state-space setting[J].Applied Mathematical Modeling,2001,25(11):979-994.
[6]PATANKAR R,QU R.Validation of the state-space model of fatigue crack growth in ductile alloys under variable-amplitude load via comparison of the crack-opening stress data[J].International Journal of Fracture,2005,131(4):337-349.
[7]JONES R,CHEN B,PITT S.Similitude:fatigue cracking in steels[J].Theoretical and Applied Fracture Mechanics,2007,48(2):161-168.
[8]ZHU X,JONES J W,ALLISON J E.Effect of frequency,environment,and temperature on fatigue behavior of E319 Cast-Aluminum alloy:small-crack propagation[J].Metallurgical and Materials Transactions,2008,39A(11):2 666-2 680.
[9]PARIS P C,TADA H,DONALD J K.Service load fatigue damage-a historical perspective[J].International Journal of Fatigue,1999,21:S35-S46.
[10]CODRINGTON J,KOTOUSOV A.A crack closure model of fatigue crack growth in plates of finite thickness under small-scale yielding conditions[J].Mechanics of Materials,2009,41(2):165-173.
[11]SHAHINIAN P.Influence of section thickness on fatigue crack growth in type 304 stainless steel[J].Nuclear Technology,1972,30:390-397.
[12]PARK H B,LEE B W.Effect of specimen thickness on fatigue crack growth rate[J].Nuclear Engineering and Design,2000,197(1-2):197-203.
[13]COSTA J D M,FERREIRA J A M.Effect of stress ratio and specimen thickness on fatigue crack growth of CK45 steel[J].Theoretical and Applied Fracture Mechanics,1998,30(1):65-73.
[14]CHANG T Z,GUO W L.A model for the through-thickness fatigue crack closure[J].Engineering Fracture Mechanics,1999,64(1):59-65.
[15]JACK A R,PRICE A T.Effect of thickness on fatigue crack initiation and growth in notched mild-stell specimens[J].Acta Metallurgica,1972,20(7):857-866.
[16]VOORWALD H J C,TORRES M A S,JUNIOR C C E P.Modeling of fatigue crack growth following overloads[J].International Journal of Fatigue,1991,13(5):423-427.
[17]GUO W L,ZHANG T Z.Effects of three dimensional constraint on crack growth under aircraft spectrum loading[J].Acta Aeronautica et Astronautica Sinica,2000,21(4):294-298.(in Chinese)
[18]ZHANG T Z,GUO W L,XU F.Theoretical analysis of fatigue crack closure considering stress states[J].Acta Aeronautica et Astronautica Sinica,2001,22(1):24-29.(in Chinese)
[19]HUANG X P,TORGEIR M,CUI W C.An engineering model of fatigue crack growth under variable amplitude loading[J].International Journal of Fatigue,2008,30(1):2-10.
[20]NEWMAN J C.A crack opening stress equation for fatigue crack growth[J].International Journal of Fracture,1984,24(4):R131-R135.
[21]NEWMAN J C,RUSCHAU J J.The stress-level effect on fatigue-crack growth under constant-amplitude loading[J].International Journal of Fatigue,2007,29(9):1 608-1 615.
[22]ELBER W.The significance of fatigue crack closure in fatigue[C]//Damage Tolerate in Aircraft Structures,ASTM STP 486,American Society for Testing and Material,March 31-April 2,Philadophia,USA,1971:230-242.
[23]HUANG X P,HAN Y,CUI W C,et al.Fatigue life prediction of weld-joints under variable amplitude fatigue loads[J].Journal of Ship Mechanics,2005,9(1):89-97.(in Chinese)
[24]WANG J,GAO J X,GUO W L,et al.Effects of specimen thickness,hardening and crack closure for the plastic strip model[J].Theoretical and Applied Fracture Mechanics,1998,29(1):49-57.
[25]ALIZADEH H,HILLS D A,MATOS P F P,et al.A comparison of two and three-dimensional analyses of fatigue crack closure[J].International Journal of Fatigue,2007,29(2):222-231.
[26]JIANG Y,FENG M,DING F.A reexamination of plasticity-reduced crack closure in fatigue crack propagation[J].International Journal of Plasticity,2005,21:1 720-1 740.
[27]YUEN B K C,TAHERI F.The effects of loading frequency,tensile overload and compressive underload on the fatigue crack propagation behavior of polymethyl methacrylate[J].Polymer Testing,2004,23(5):491-500.
[28]FORMAN R G,SHIVAKUMAR V,CARDINAL J W,et al.Fatigue crack growth database for damage tolerance analysis[R].U.S.Department of Transportation Federal Aviation Administration,2005.
[29]LU M J.Material manual for mechanical engineering applications[M].Shenyang:Liaoning Science and Technology Press,2004.(in Chinese)
Biographical notes
LIU Jiantao,born in 1982,is currently a PhD candidate atCollege of Mechanical and Electronic Engineering,University ofElectronic Science and Technology of China.He received his bachelor degree fromChongqing Institute of Technology,China,in 2005.His research interests include modeling and numerical simulation of fatigue crack growth,structure robust design and optimization.
Tel:+86-28-87 634141;E-mail:jiantaoliu.uestc@gmail.com
DU Pingan,born in 1962 is currently a professor atCollege of Mechanical and Electronic Engineering,University of Electronic Science and Technology of China.
E-mail:dupingan@uestc.edu.cn
LIU Xiaobao,born in 1978,is currently a PhD candidate atCollege of Mechanical and Electronic Engineering,University of Electronic Science and Technology of China.
E-mail:forcan2008@qq.com
DU Qiang,born in 1968,is currently a PhD candidate atCollege of Mechanical and Electronic Engineering,University of Electronic Science and Technology of China.
E-mail:duqiang2007@hotmail.com
杂志排行

Chinese Journal of Mechanical Engineering的其它文章
- Influence of Deposition Temperature and Pressure on Microstructure and Tribological Properties of Arc Ion Plated Ag Films
- Characterizing the Spheroidization Grade and Strength of 15CrMo Steel through Determining Fractal Dimension
- Psychoacoustic Study on Contribution of Fan Noise to Engine Noise
- Reconstruction of Emission Coefficients for a Non-axisymmetric Coupling Arc Based on MALDONADO's Method
- Tool Wear in Turning of Titanium Alloy after Thermohydrogen Treatment