Evaluating Local Elasticity of the Metal Nano-films Quantitatively Based on Referencing Approach of Atomic Force Acoustic Microscopy
2012-01-20ZHANGGaimeiHECunfuWUBinandCHENQiang
ZHANG Gaimei ,HE Cunfu *,WU Bin ,and CHEN Qiang
1 College of Mechanical Engineering and Applied Electronics Technology,Beijing University of Technology,Beijing 100124, China 2 Laboratory of Plasma Physics and Materials,Beijing Institute of Graphic Communication,Beijing 102600,China
1 Introduction
Metallic nano-particles and nano-film have received significant attention due to their unique properties such as color,conductivity,melting temperature,magnetism,specific heat and light absorption in comparison with bulk metal[1-2].Additionally,further miniaturization of advanced electronic devices requires a reduction in the thickness and width of the metal lines,resulting in sizes of several to several tens of nanometers[3-4].So it is necessary to accurately evaluate the material properties for designing devices with sufficient strength,not only to predict the performance of a system before use,but also to evaluate its reliability during or after use,especially nano-mechanical information—knowledge on mechanical properties at the nano-scale such as elastic modulus,adhesion,and friction.Meanwhile,subsurface defects can be present during nano-film deposition,which will deteriorate the properties of the nano-materials.But the detection of these nano-scale tiny defects is very difficult by conventional methods.
There are many methods such“nano-”indentation(NI)method based on Nano Indenter[5]and force-displacement curve method based on atomic force microscope(AFM) that can measure the mechanical properties[6-8].But NI measurement is inherently destructive,creating indents hundreds to thousands of nanometers wide and with insufficient spatial resolution.Due to the indenting depth,the measurement result is affected by the mechanical property of substrate easily,especially for the films of nano-thickness.Force-displacement curve methods work best when the compliance of the cantilever is roughly comparable to that of the tested material.Therefore,these methods are better suited to very compliant(“soft”)materials,and lose effectiveness as the material stiffness increases.
To address the requirements,many researchers[9-13]have developed the atomic force acoustic microscope(AFAM)system and measured the thin film with nano-scale thickness such diamond-like carbon(DLC) film with 5 nm,20 nm and 100 nm thickness[14],nano-crystalline ferrites film of 200 nm thickness[12]and Nb film with nano-film thickness[15].AFAM is a dynamical technique[9-13],where the cantilever or the sample surface is vibrated at ultrasonic frequencies while a sample surface is scanned with the sensor tip contacting the sample.At a consequence,the amplitude of the cantilever vibration as well as the shift of the cantilever resonance frequencies containing information about local tip-sample contact stiffness can be used to calculate the contact stiffness between the tip and sample.According to the Hertz contact model and referencing approach[9,12],the value of indentation modulus can be determined.The AFAM technique has been demonstrated to be a powerful tool for the investigation of the local elastic prosperities of sample surface[9,11,12,16].Moreover,in the case of a thin film deposited over a substrate,AFAM measurements are less affected by mechanical properties of the substrate itself[11,17].
Copper(Cu) film with nano-thickness has many attractive properties such as low resistivity and high electro migration resistance.Another important factor is the reliability of the thin film,which depends on the method of processing.To satisfy this requirement,the sputtering method is one of the most useful thin film production techniques as it allows low temperature formation of almost ideal films,i.e.films with properties very similar to that of the bulk material.To illustrate the feasibility of AFAM system and investigate the metal film with nano-thickness,in this paper,the Cu films with 110 nm thickness prepared by direct current(DC)magnetron sputtering method are investigated.At the same time,the zinc thin films of 90 nm thickness prepared by DC magnetron sputtering method and bulk glass are measured also to prove the AFAM method.
Compared with reference value of test materials,the measured results reveal that it is a promised method evaluating the local nano-mechanical properties not only for bulk sample but also for metal thin film with nano-thickness.Furthermore,the choice of the reference material,tip wear and the influencing factors arising from the cantilever characteristics were analyzed.
2 Experimental Method
2.1 Samples preparation
In this paper,the copper and zinc thin films of nano-thickness prepared by direct current(DC) magnetron sputtering method and glass slide are investigated by the atomic force acoustic microscope technique experimentally.The single crystal silicon wafers(used for depositing the zinc film) and glass slides(used for depositing the copper film) as the substrates are cleaned sequentially in an ultrasonic bath using ethanol,acetone and de-ionized water before they are mounted on the sample holder.The copper films are deposited by DC magnetron sputtering method.The background pressure is 2.6 mPa,the flow rate of Ar2is 20 scc/m(standard cubic centimeter per minute),the deposition time is 5 min and the input power were 20 W,40 W and 60 W respectively.The back of substrates are glued the sample holder using the double-side tape.The substrate-to-target distance is 100 mm.Fig.1 shows the samples with the copper coating on the glass slide substrate and zinc coating on Si substrate.The thicknesses are 40 nm,80 nm and 110 nm for input power with 20 W,40 W and 60 W respectively.In this paper,only the copper film with 110 nm thickness is measured.To minimize the impact of inaccuracy arising from indentation modulus of the tip,the SiOx films are chosen as reference sample.
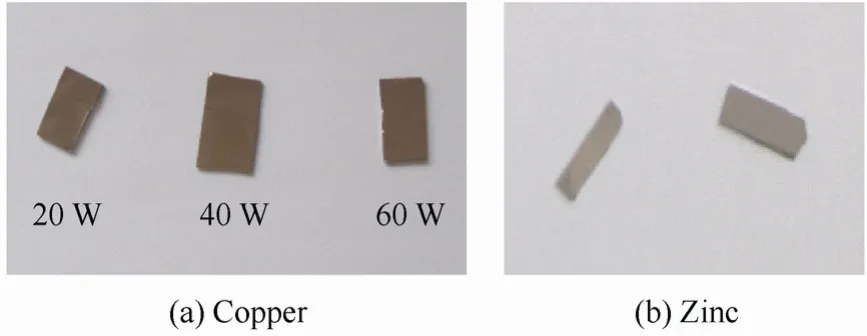
Fig.1.Photography of the tested namo-films
2.2 AFAM setup and method
The AFAM technique is based on the contact theory and the vibration theory of the cantilever,the contact stiffness can be calculated according to the contact resonance frequencies measured by the AFAM system.The elastic modulus can be deduced from contact stiffness based on the contact theory.The details of description see Ref.[13].
A modified commercial atomic force microscope (CSPM 5000,Ben Yuan,China) is used to image the sample surface,and to control the static cantilever forces before the tip contacting the sample.An external function generator(Handyscope-HS3,TiePie,UK) provides a stable sinusoidal excitation,which is applied to a piezoelectric transducer(V103-RM,Panametrics,USA),coupled to the back side of the sample with the double-sided tape,as Fig.2 and Fig.3.Fig.2 and Fig.3 show the block diagram and actual photograph of the AFAM system.The transducer,worked on the thickness vibration,emits longitudinal acoustic waves into the sample,which causes out-of-plane vibration of the sample surface.These surface vibrations are transmitted into the cantilever via the sensor tip.The cantilever vibrations are measured by the photodiode detector of the atomic force microscope(AFM) instrument,and the signal is connected to the signal channel of lock-in amplifier(Model 7280 DSP,Signal Recovery,USA) which also receives a reference signal from the function generator at the reference channel.
To measure the contact resonance frequencies for the fixed point of sample,the amplitude of the cantilever vibration is demodulated by the lock-in amplifier only at an excitation frequency and is output to HS3.The data acquisition software is created with commercial tool Labview(National Instruments,Austin,TX,USA),by which the excitation frequency is changed stepwise and the digitized lock-in output at the specific frequency is read.And the amplitude of the cantilever versus as the excitation frequency is stored.
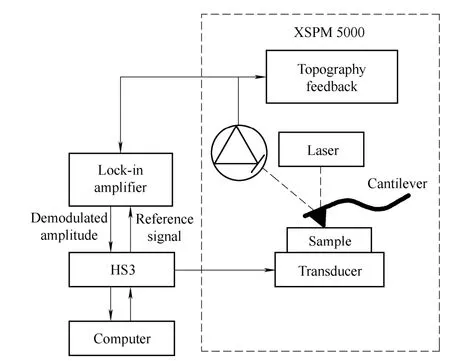
Fig.2.Block diagram of AFAM system
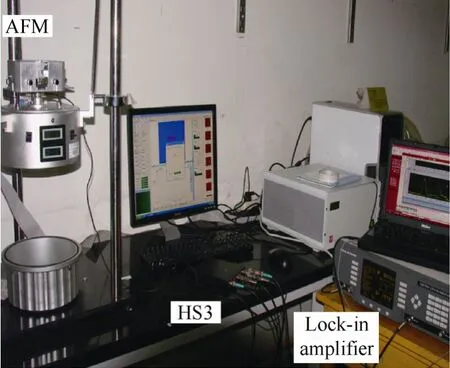
Fig.3.Photograph of AFAM system
3 Results and Discussion
3.1 Free and contact resonance frequency of the cantilever
Before performing contact experiments,the first two free resonance frequencies of the clamped-free cantilever must be measured when the tip is out of contact[18].The cantilever is brought close to,but not in contact with the sample.Driving the transducer at relatively high voltages creates ultrasonic vibrations,which are large enough to excite the cantilever's free resonances via air coupling.
According to the referencing approach,in this paper three cantilevers are used for three different tested samples.Meanwhile,to investigate the effect of the cantilever on contact resonance frequency,for the tested sample and corresponding reference sample the same cantilever are used.We define the cantilever for the copper film as #1,zinc film as number #2,and glass as number #3 respectively.The free flexural frequencies for three cantilevers are measured and shown in Fig.4.
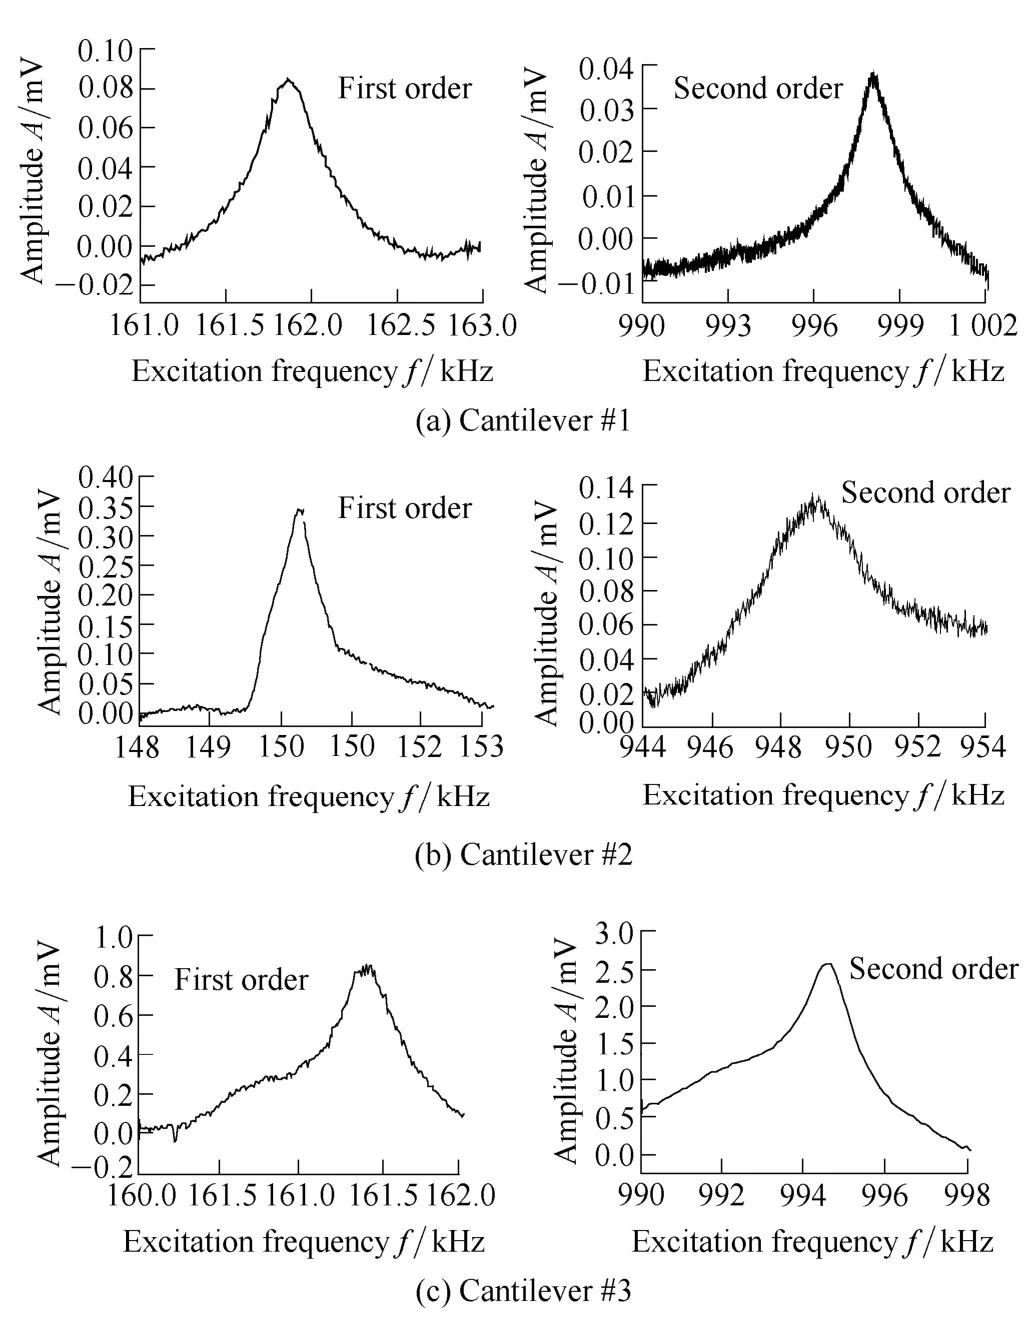
Fig.4.The first two orders free flexural resonance spectra of three cantilevers
In order to determine the elastic modulus of the tested sample,a referencing or comparison approach is used[9,12],in which measurements are performed on the tested sample and the reference samples under the same static forces (960 nN) separately.The contact resonance spectra measured on the tested and corresponding reference samples are shown in Fig.5.From Fig.4 and Fig.5,it can be seen that the first two orders free and contact resonance frequencies are clearly visible,and listed in Table 1.Heref1andf2are the first and second contact resonance frequencies of the cantilever respectively when the tip contacts the samples.f10andf20are the first and second free resonance frequencies of the cantilever respectively.
3.2 Contact stiffness and elasticity modulus
According to the flexural beam model for the AFM cantilever with sensor tip contacting with samples and characteristic equation(see Ref.[16]),the contact stiffness between samples (including tested and reference samples)and the tip can be calculated.According to the measured first and second contact resonance frequencies,the function between the contact stiffness andL1/Lcan be shown in Fig.5.Here,Lis the total length of the cantilever,andL1is the length between the tip and the cantilever base.From Fig.6,the contact stiffness andL1/Lfor tested sample and corresponding reference sample can be read,shown in Table 2.
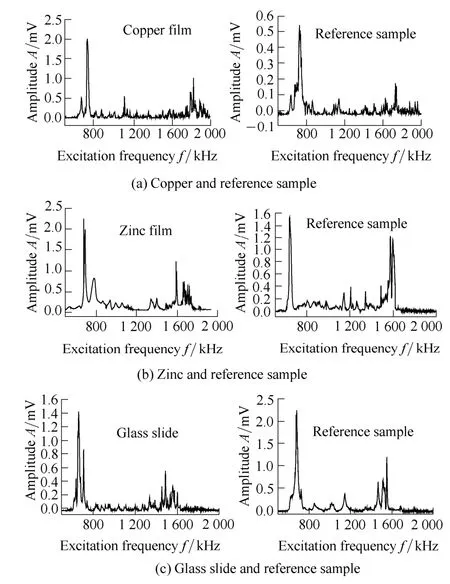
Fig.5.The contact resonance spectra of the first and second order for tested and corresponding reference sample
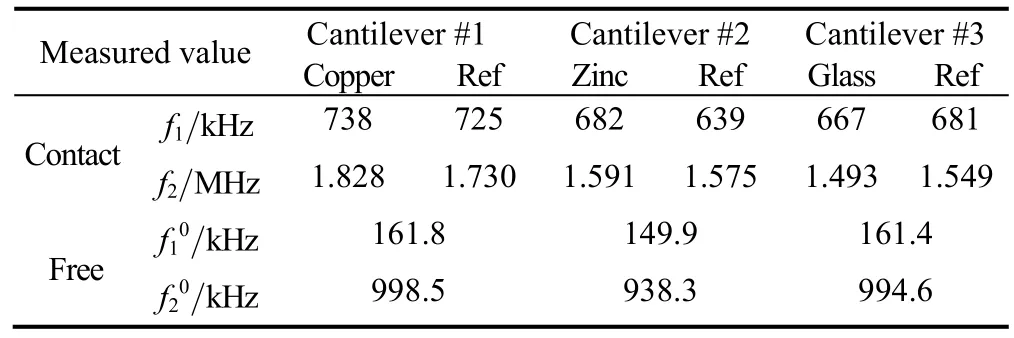
Table 1.The first two order contact resonance frequencies of the tested and reference samples
According to the Hertz contact theory and referencing approach,Eq.(1) can be obtained:
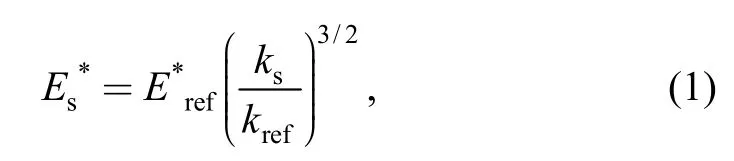
whereEs*andEref*are reduced Yong's modulus for tested and reference materials respectively.ksandkrefare contact stiffness for tested sample and reference materials respectively.
Also,we know that
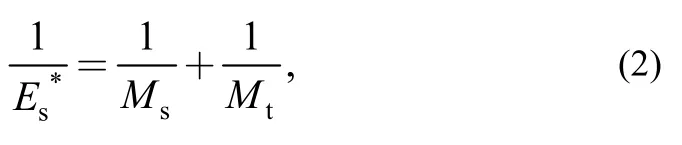
whereMtandMsare the indentation modulus of the tip and the tested sample,respectively.
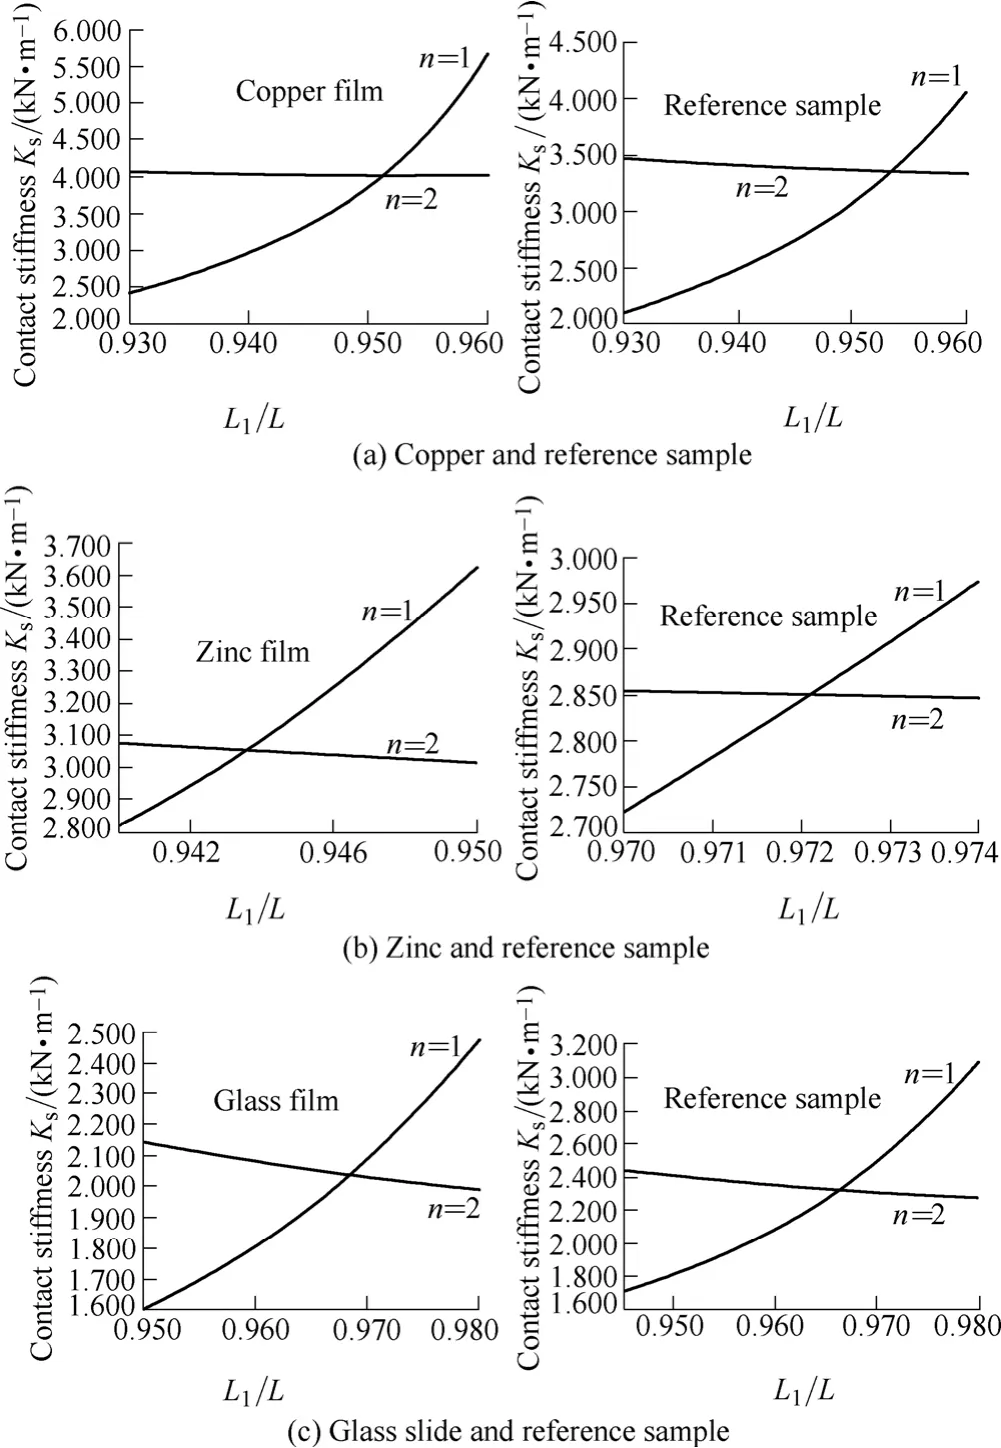
Fig.6.Contact stiffness as a function of relative tip position L1/L for samples
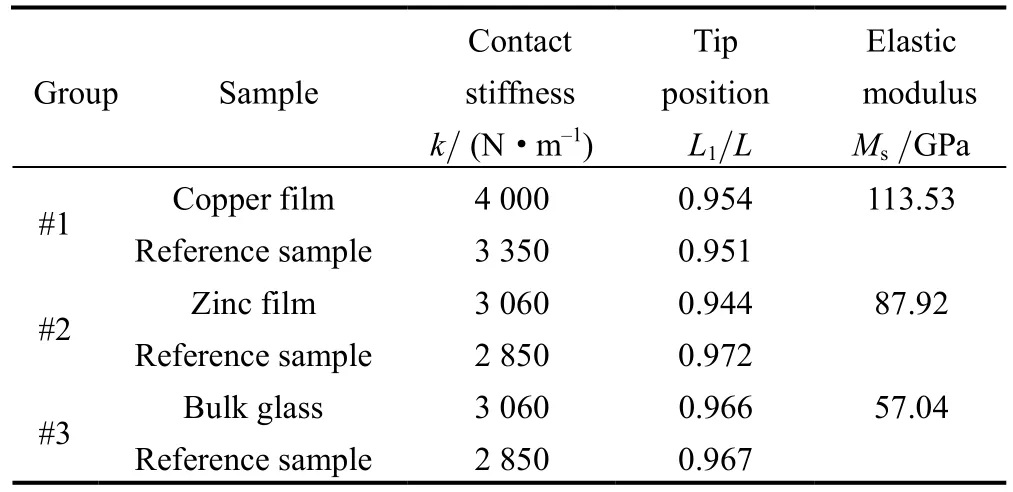
Table 2.Measured values of the contact stiffness and L1/L for tested and corresponding reference samples
Assuming the indentation modulus as 75 GPa for reference sample,and 165.5 GPa for cantilever tip,the elastic modulus of tested samples can be obtained and are listed in Table 2.kis the contact stiffness calculated from the resonance frequencies for tested and reference samples.Msis indentation modulus of the tested sample.These results are within the range of the literature values for copper film[18](MCu=105-130 GPa)and bulk glass (MGlass=50-90 GPa).Due to the errors of the parameter provided by manufacturer,purity level of the copper target and zinc target,the wear of the tip,the errors of the indentation modulus are suitable.
3.3 Discuss and analysis
3.3.1 Effect of the cantilever on the contact resonancefrequency and sensitivity
Due to the manufacturing error,for the same model cantilevers the free resonance frequencies can be different,such as the first and second free resonance frequencies for three cantilevers in Fig.4(a),Fig.4(b) and Fig.4(c).From the Fig.4,it can be found that the first free frequencies are 161.8 kHz,149.9 kHz and 161.4 kHz for three cantilevers respectively,which relate with the dimensions especially the length of the cantilever.So,for the same sample and same static cantilever force,the contact resonance frequencies vary with the free resonance frequency of the cantilever and spring constant of the cantilever,such as contact resonance spectra of reference samples in Fig.5(a) and Fig.5(b).Even the free frequencies are same or close for two cantilevers,due to the error of the spring stiffness,the contact resonance spectra are still different,shown in Fig.5(a) and Fig.5(c) for same reference sample.So for every cantilever,before measuring the contact resonance frequencies it is necessary to determine the free resonance frequencies.
According to the characterization equation of the cantilever (see Ref.[16]),the sensitivity to the contact stiffness and accuracy can be calculated and are affected by free frequencies and spring constant of the cantilever.Table 3 lists the contact resonance frequency varying with the contact stiffness for three models of cantilevers.The dimension of the cantilever isL×W×t(length×width×thickness),Spring constant and natural frequencyf0of cantilever are provided by manufacture.The values of spring constant are 48 N/m,40 N/m and 0.9 N/m for three type cantilever.f1andf2are the corresponding first and second contact resonance frequencies respectively whenkare set as 200 N/m,400 N/m,600 N/m and 800 N/m respectively.Δf1and Δf2are the first and second frequency increments for 200 N/m contact stiffness increment,which can reflect the sensitivity of contact resonance frequency to the contact stiffness.
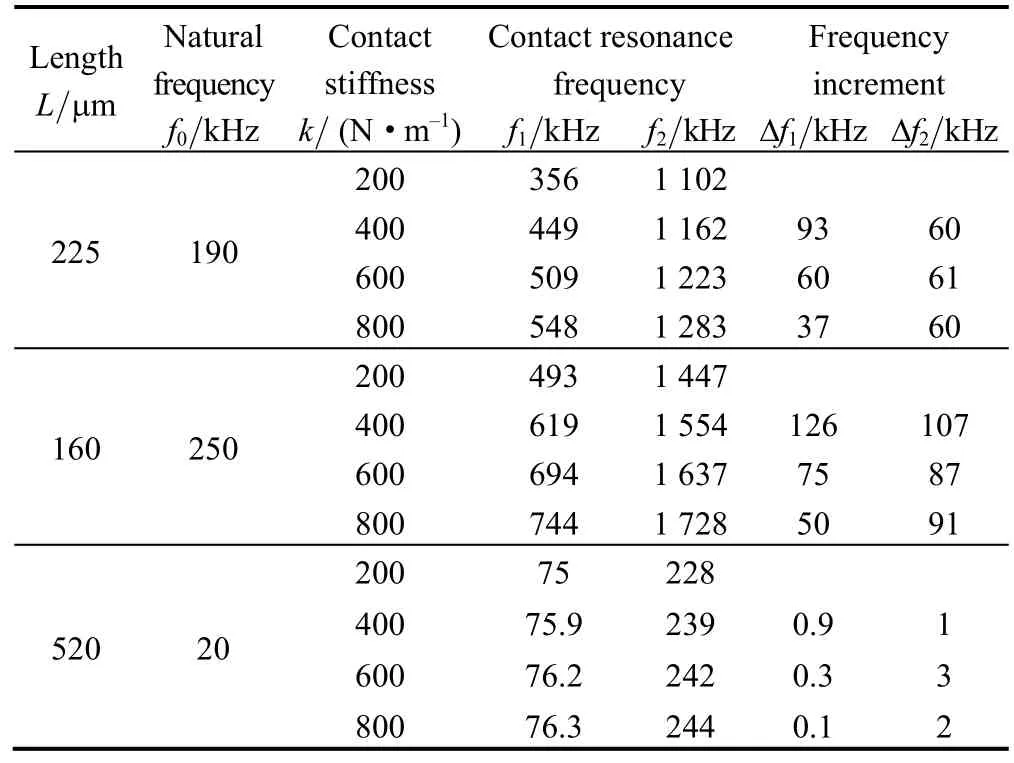
Table 3.Contact resonance frequency varying with the contact stiffness for three types of cantilevers
From Table 3,we can find that the sensitivity of contact resonance frequency to contact stiffness varies with the cantilevers.It can be found that from the 600 N/m to 800 N/m,the first resonance frequencies increase 37 kHz,50 kHz and 0.1 kHz for three models of cantilevers respectively,but it is difficult to distinguish 0.1 kHz for the device.So the cantilever can affect the measurement accuracy and it is necessary to choose suitable cantilever according to the stiffness of the sample and frequency band wide of the AFAM system.To measure the stiff material(modulus greater than approximately 50 GPa),the cantilevers with spring constant of approximately 30 N/m to 50 N/m are available.
3.3.2 Elastic modulus affected by reference materials
From Eq.(1) and Eq.(2),the equation can be obtained:
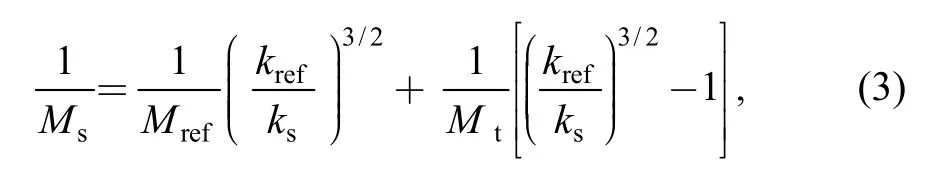
whereMrefandkrefare the indentation modulus and contact stiffness of the reference sample.From Eq.(3),it can be found that if there is too much difference between the stiffness of reference material and that of tested material,the inaccuracy of indentation modulus of the tip will impact the measured values of the tested sample.The reference material needs to be similar to the tested material in stiffness.So,the tested and reference materials should have similar modulus to ensure accuracy of the referencing approach.At the same time,contact models vary with the stiffness of sample.If the tested sample is similar with reference sample in stiffness,the contact models are same,so the referencing approach is suitable.
3.3.3 Contact resonance frequency affected by tip wearAccording to the Hertz model we can obtain
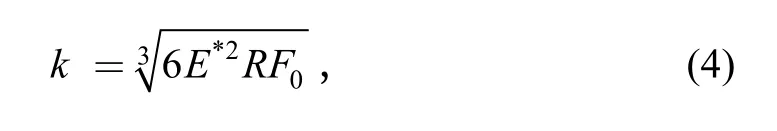
whereF0is static cantilever force acting on the tip.Ris the tip radius.E*is the reduced Yong's modulus for sample.It can be found that the radiusRincreases with the wear of tip,which causes the contact stiffness to increase.So for same sample and same cantilever,even the applied load was kept same throughout the measurements,it can be happened that the contact resonance frequency increases.So measuring the reference sample before and after each measurement on the tested sample is necessary to reduce the inaccuracy.It has also been demonstrated in Ref.[18].
4 Conclusions
(1) The AFAM system is built based on commercial atomic force microscope (AFM) and the data acquisition software is created with commercial tool Labview.The excitation frequency is changed stepwise and the frequency spectra of the cantilever are constructed by the AFAM system.
(2) The copper and zinc films with nano-thickness are prepared by the DC magnetron sputtering method and the elastic modulus are determined by the AFAM system.Meanwhile,the glass slides are measured.The results show that the AFAM technique is a sensitive method of quantitatively measuring the indentation modulus for fixed point.
(3) The effect of cantilever on the sensitivity and accuracy of contact resonance frequency is discussed.When the length of cantilever increases,the natural frequency and the sensitivity reduce.
(4) The choice of the reference material and wear of tip are analyzed.The error can be reduced when the reference material is familiar with tested sample in stiffness.
[1]ZHANG L D,MU J M.Nanoscale Materials and Nanostructures[M].Beijing:Science Press,2001.(in Chinese)
[2]MCFARLAND A D,VAN DUYNE R P.Single silver nanoparticles as real-time optical sensors with zeptomole sensitivity[J].Nano Letters,2003,3(8):1 057-1 062.
[3]MICHEL B,BERNARD A,BIETSCH A,et al.Printing meets lithography:Soft approaches to high-resolution patterning[J].IBM Journal of Research and Development,2001,45(5):697-719.
[4]SEUNG H K,INKYU P,HENG P,et al.Direct nanoimprinting of metal nanoparticles for nanoscale electronics fabrication[J].Nano Letters,2007,7(7):1 869-1 877.
[5]OLIVER W C,PHARR G M.An improved technique for determining hardness and elastic modulus using load and displacement sensing indentation experiments[J].Journal of Materials Research,1992,7(6):1 564-1 583.
[6]ZHONG Q,INNISS D,KJOLLER K,et al.A Fractured polymer/silica fiber surface studied by tapping mode atomic force microscopy[J].Surface Science Letters,1993,290(1-2):L688-L692.
[7]BURNHAM N A,KULIK A J,GREMAUD G,et al.Scanning local-acceleration microscopy[J].Journal of Vacuum Science &Technology B,1996,14(2):794-799.
[8]TROYON M,WANG Z,PASTRE D,et al.Force modulation microscopy for the study of stiff materials[J].Nanotechnology,1997,8(4):163-170.
[9]RABE U,JANSER K,ARNOLD W.Vibrations of free and surface coupled atomic force microscope cantilevers:theory and experiment[J].Review of Scientific Instruments,1996,67(9):3 281-3 293.
[10]PASSERI D,ROSSIA M,ALIPPI A,et al.Characterization of epoxy/single-walled carbon nanotubes composite samples via atomic force acoustic microscopy[J].Physica E.2008,40(7):2 419-2 424.
[11]AMELIO S,GOLDADE A V,RABE U,et al.Measurements of elastic properties of ultra-thin diamond-like carbon coatings using atomic force acoustic microscopy[J].Thin Solid Films,2001,392(1):75-84.
[12]HURLEY D C,SHEN K,JENNETT N M,et al.Atomic force acoustic microscopy methods to determine thin-film elastic properties[J].Journal of Applied Physics,2003,94(4):2 347-2 354.
[13]HE C F,ZHANG G M,WU B,et al.Subsurface defect of the SiOx film imaged by atomic force acoustic microscopy[J].Optics and Lasers in Engineering,2010,48(11):1 108-1 112.
[14]KESTER E,RABE U,PRESMANES L,et al.Measurement of Young's modulus of nanocrystalline ferrites with spinel structures by atomic force acoustic microscopy[J].Journal of Physics and Chemistry of Solids,2000,61(8):1 275-1 284.
[15]HURLEY D C,KOPYCINSKA-MüLLER M,KOS A B,et al.Nanoscale elastic-property measurements and mapping using atomic force acoustic microscopy methods[J].Measurement Science and Technology,2005,16(11):2 167-2 172.
[16]HE C F,ZHANG G M,WU B.Quantitative measurement of local elasticity of SiOx film by atomic force acoustic microscopy[J].Chinese Physics B,2010,19(8):084302.
[17]KOPYCINSKA-MüLLER M,GEISS R H,MüLLER J,et al.Elastic property measurements of ultrathin films using atomic force acoustic microscopy[J].Nanotechnology,2005,16(6):703-709.
[18]BerLin:Hurley D C.Applied Scanning Cantilever Methods XI[M]Berlin:Springer-Verlag Berlin Heidelberg,2008.
Biographical notes
ZHANG Gaimei,born in 1975,is currently a PhD candidate atCollege of Mechanical Engineering and Applied Electronics Technology,Beijing University of Technology,China.She received her master degree fromXi'an University of Technology,China,in 2001.Her research interests include the measurement of nanomechanics based on atomic force acoustic microscopy and the technology of the nondestructive tests.
Tel:+86-10-60 261105;E-mail:zhang_gaimei@163.com
HE Cunfu,born in 1958,is currently a professor atCollege of Mechanical Engineering and Applied Electronics Technology,Beijing University of Technology,China.He received his PhD degree fromDepartment of Engineering Mechanics,Tsinghua University,China,in 1996.His research interests include modern nondestructive testing methods and signal processing.
Tel:86-10-67 391938;E-mail:hecunfu@bjut.edu.cn
WU Bin,born in 1962,is currently a professor atCollege of Mechanical Engineering and Applied Electronics Technology,Beijing University of Technology,China.He received his PhD degree fromTaiyuan University of Technology,China,in 1996.His research interests include electrodynamics,modern nondestructive testing methods and signal processing.
Tel:86-10-67 391766;E-mail:wb@bjut.edu.cn
CHEN Qiang,born in 1963,is currently a professor atBeijing Institute of Graphic Communication,China.He received his PhD degree fromInstitute of Plasma Physics Chinese Academy of Sciences,China,in 2000.His research interests include plasma physics,plasma diagnostic,plasma chemistry,new softpackaging materials fabrication and modifications.
Tel:86-10-60 261099;E-mail:lppmchenqiang@hotmail.com