Optimal Design of Multiple Stress Constant Accelerated Life Test Plan on Non-rectangle Test Region
2012-01-20CHENWenhuaGAOLiangLIUJuanQIANPingandPANJun
CHEN Wenhua *,GAO Liang ,LIU Juan ,QIAN Ping ,and PAN Jun
1 Department of Mechanical Engineering,Zhejiang University,Hangzhou 310027,China 2 Zhejiang Province's Key Laboratory for Reliability Technology of Mechanical &Electrical Products,Zhejiang Sci-Tech University,Hangzhou 310018,China
1 Introduction
Constant stress accelerated life test(CSALT) is a common technique to assess product life rapidly in engineering[1-3].Comparing with single-stress CSALT,as multiple CSALT is closer to product's actual use condition and easier to stimulate product failure,it is more conducive to assess product life quickly and accurately;therefore,it is increasingly used widely in engineering[1,4-6].Designing an optimal test plan is an important part to assess product life accurately and economically[7-15].
Currently,when designing two-stress CSALT,it is usually assumed that all the stress levels between normal stress and the highest stress could be loaded on test units.Accordingly,if one establishes a Cartesian coordinates system with the two stresses to be axes,the range of test stress,called test region,is a rectangular area[1,8-15].However,sometimes one stress is limited by the other stress in engineering practice,that will induce the two stresses not to reach the highest stress levels simultaneously,and the test region becomes non-rectangle.For example,in multiple CSALT of a certain type of electrical connectors under temperature and vibration,the allowed highest stress levels are 158 ℃ for temperature and 1.0 g2/Hz for vibration[15].Actually,as high temperature would reduce driving force of the vibra-bench,vibration stress could not achieve 1.0 g2/Hz when temperature is 158 ℃.
For optimal CSALT design on non-rectangle test region,the wildly used design method based on rectangular region is inapplicable.To solve this problem,ESCOBAR and MEEKER[8]presented an optimal design method for a simple non-rectangle test region,the upper right corner of a rectangle test region being truncated by the life-stress relationship contour (e.g.the regionOBMNAin Fig.1).However,the research is only a special case of non-rectangular test region,and the optimization algorithm is simple and based on experience,which can not ensure to get the optimal plan.
Generally,the boundary of non-rectangular test region is a complex curve,such as curveSABshown in Fig.1.In order to obtain the optimal CSALT plan on non-rectangular test region with complex boundaries,the widely used linear-extreme value model in CSALT of electromechanical products is considered in this paper,and design method for optimal plan on non-rectangular test region with arbitrary boundaries is presented,which generalizes design idea of ESCOBAR and MEEKER.
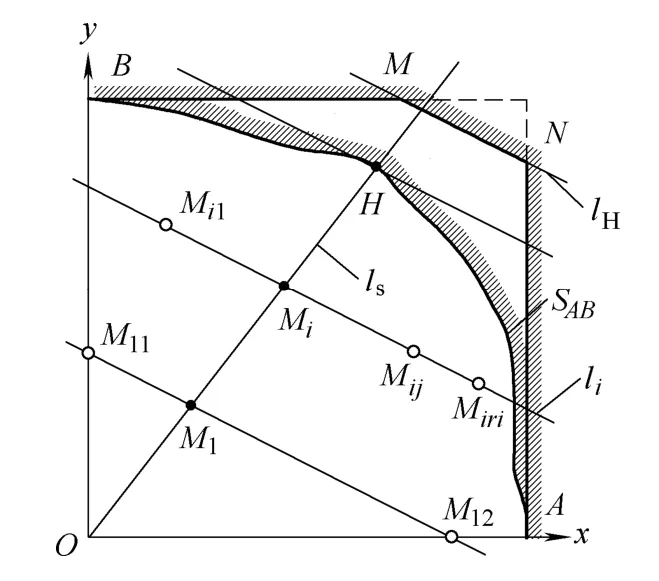
Fig.1.General non-rectangular test region &the two categories of V-optimal plan
2 Model Assumptions
Currently,the statistical model of most electromechanical products can be transformed to linear-extreme value model,and the model assumptions are as follows.
(1) For each stress level combination,called test points,the log-life of product follows the extreme value distribution,and the probability function is
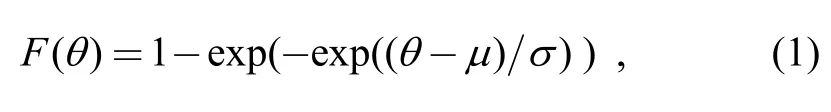
whereμis the location parameter,σis the scale parameter.
(2) The relationship between the location parameterμand the standardized stressesxandysatisfies
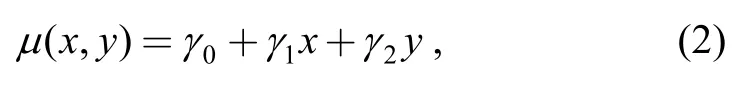
where 0 ≤x≤1,0 ≤y≤1,γ0,γ1andγ2are model parameters,γ1<0,γ2<0.
(3) The scale parameterσis constant and independent withxandy.
For example,under multiple effects of temperature and vibration,the electrical contact life of a certain type of electrical connectors follows two-parameter Weibull distribution[8]:
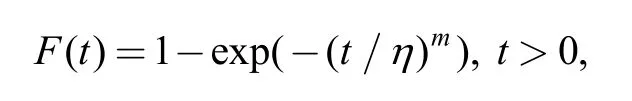
wheremis the shape parameter,ηis the location parameter or character life.
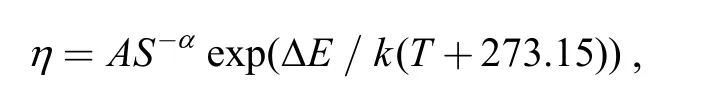
The shape parametermis a constant;the relationship between the location parameterηand environment temperatureT(℃) and random vibration stressS(g2/Hz),namely the life-stress relationship[5-6],satisfies where ΔEis the activation energy (eV),kis the Boltzmann constant (0.867 1×10⁻⁴eV/K),Aandαare unknown parameters.
Letθ=lnt,the two-parameter Weibull distribution transforms to the Extreme value distribution[8];the probability distribution function shows as Eq.(1),where the location parameterμ=lnη,and the scale parameterσ=1/m.
The scale parameterσis a constant.The relationship between the location parametersμand the transformed stresseswandvsatisfies[5]
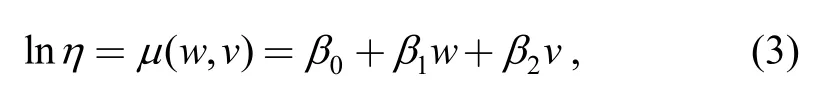
whereβ0=lnA,β1=ΔE/k,β2=-α,w=1/(T+273.15),v=lnS.
Furthermore,letw0andv0be the normal operating stress levels andwmandvmbe the highest stress levels ofwandv,let
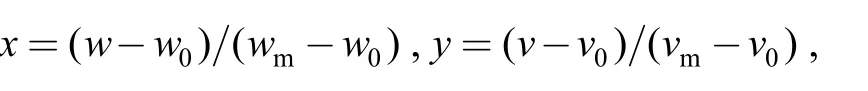
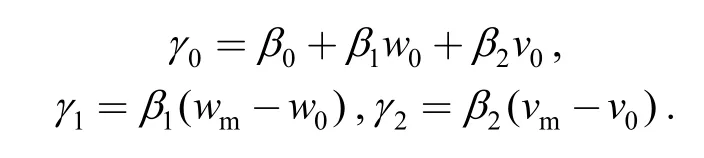
thenwandvcan be transformed to standardized stressesxandy.Accordingly,Eq.(3) transforms to Eq.(2),and the paramesters in Eq.(2) satisfy
3 Optimal Design Theory of CSALT on Non-Rectangular Test Region
3.1 General non-rectangular test region
As shown in Fig.1,in the Cartesian coordinates systemxOywith standardized stressesxandyas the axes,the coordinates of pointsAandBare (1,0) and (0,1)respectively,the boundaries of general non-rectangular test regionΩcontain segmentsOA,OBand an arbitrary curveSAB.IfSABis a broken line asBMNA,Ωbecomes the non-rectangular region discussed in Ref.[8].
3.2 Optimization problem
Considering type-І censored CSALT under the linearextreme value model,firstly,specify the censored time,the total sample size and the number of test points.The problem here is to determine the coordinates and the sample allocation ratios of test points,which minimize the asymptotic variance of the maximum likelihood estimate(MLE) of thepth quantile of product's life distribution under normal stress (V-optimality).
3.3 Problem analysis
The solution of the optimization problem has two properties[8].
(1) The optimal test plans are not unique,and could be divided into two categories:①All the test points locate on a straight line through the origin of coordinate,such as the solid pointsH,MiandM1on linelsin Fig.1,where,the origin of coordinate represents the normal stress levels;② All the test points are non-collinear,such as the hollow pointsM11,M12andMijin Fig.1.Ref.[8]names the two categories of plans as optimal degenerate test plan and optimal non-degenerate test plan respectively.
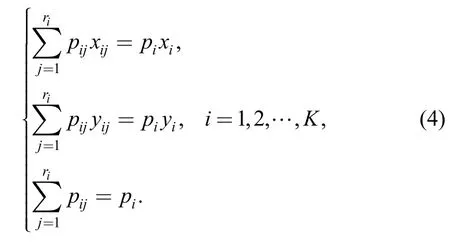
(2) Optimal non-degenerate test plan can be generated from the optimal degenerate test plan.As Fig.1 shows,let(xi,yi) be the coordinate andpibe the sample location ratio of theith (i=1,2,…,K) test pointMifor an optimal degenerate test plan;draw the life-stress relationship contourlithroughMiand select the test pointsMij(j=1,2,…,ri;Mij≠Mi) onli.Let (xij,yij) be the coordinates andpijbe the sample location ratio of pointMij.If (xij,yij) andpijsatisfies Eq.(4),then the corresponding optimal non-degenerate test plan could be obtained:
On the basis of the above two properties,ESCOBAR and MEEKER[8]proposed a design idea.First,determine the V-optimality degenerate test plans;then,derive all the V-optimality non-degenerate test plans;finally,find out the D-optimality plan which provides the most accuracy estimates of model parameters from all the V-optimality non-degenerate plans.
The above idea is not limited by the shape of test region boundary,and it can be extended to general non-rectangular test region,but there are two key problems need to be settled:
a) How to determine the slope of the line on which the test points of V-optimality degenerate test plan locate(named optimal line).For this problem,if numerical method is used directly,principally it requires to determine the optimal degenerate test plans on all the straight lines through the origin of coordinate first,and then select the global optimal plan,which needs intensive calculation.
b) If the V-optimality degenerate test plans are not unique,how to determine all the V-optimality plans and select the best non-degenerate test plan based on D-optimality.If the slopes of all optimal lines locate on an interval,the problem is difficult to be solved directly by numerical method.
3.4 Two properties of optimal test plan on general non-rectangular test region
It can be proved that,there are two properties for the optimal test plan on general non-rectangular test region:
Property 1:LetHbe the point on test region boundary.If failure probability of pointHis maximum at censored timeτ,the test points of optimal degenerate test plan locate on segmentOH.PointHis called Maximum Failure Probability Point (MFPP),and it is corresponding to the highest stress levels.If MFPP is not unique,it is assumed that they all locate on the same contourlH;letΨbe the set of MFPP,then a line through the origin of coordinate and any point inΨis an optimal line.
Property 2:If MFPP on the test region boundary is not unique,the optimal degenerate test plan is also not unique.Let (xi,yi) be the coordinates andpibe the sample location ratio of theith (i=1,2,…,K) test pointMifor an optimal degenerate test plan;draw the life-stress relationship contourlithroughMi,then:①the sample location ratio of theith test point of all the optimal degenerate test plans ispi;② theith test point of all the optimal degenerate test plans is on contourli.
On the basis of the two properties,the slope of the optimal line and all the V-optimality plans could be determined theoretically,which avoids solving the optimization model directly and improves the efficiency and robustness of optimization.Property 1 can be used to determine the slope of the optimal line;Property 2 can be used to determine all the V-optimality plans.
4 Optimal Design Method of CSALT on Non-Rectangular Test Region
First,find out MFPPs on test region boundary.Generally,MFPPs locate on the curve segmentSAB,and the optimization problem can be written as follows:
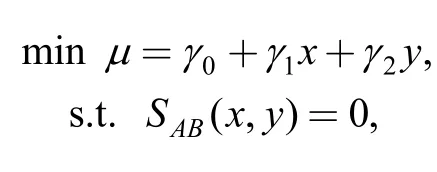
whereSAB(x,y)=0 is the equation of the curve segmentSAB.
For the above optimization problem with linear objective function and nonlinear equality constraint,the numerical algorithm is mature;especially,for some relatively simple boundaries,MFPP can be determined by geometric method or analytical method directly.
Secondly,design the optimal test plan.The problem can be divided into four cases based on the number and location of MFPPs.
4.1 MFPP is unique (case 1)
According to property 1,the unique optimal degeneration test plan locates on the segmentOH.The optimal plan can be determined according to the following steps.
4.1.1Determine the V-optimality degeneration test plan on OH
As shown in Fig.2,let (xH,yH) be the coordinates of pointH,andsHbe the slope ofOH.Rotate the coordinate systemOxyμaround the axisOμuntilOxcoincides withOH,which forms a new coordinate systemOξημ.In the new coordinate systemOξημ,the life-stress relationship Eq.(2) turns to Eq.(5):
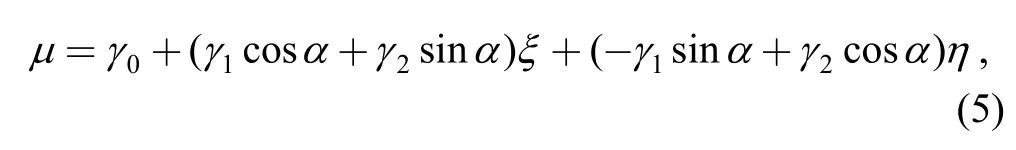
where cosα=
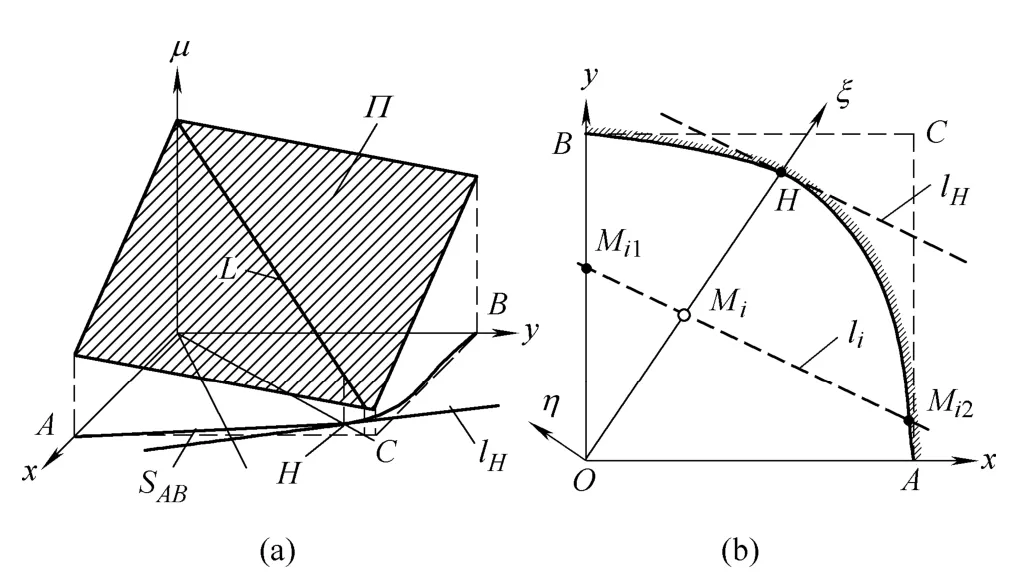
Fig.2.Sketch map of test design method for case 1
LetΠbe the plane corresponding to the life-stress relationship,andLbe the intersecting line betweenΠand the coordinate planeξOμ.In the new coordinate systemOξημ,the equation ofLis
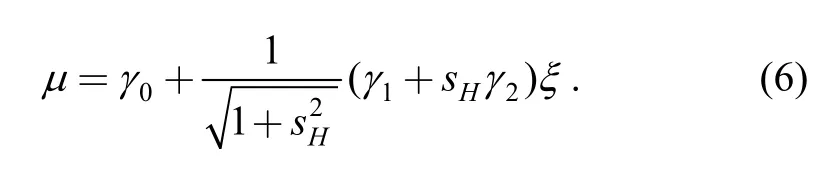
Eq.(6) is the life-stress relationship of single-stress optimal test plan in the coordinate planeξOμ.And the highest stress level is
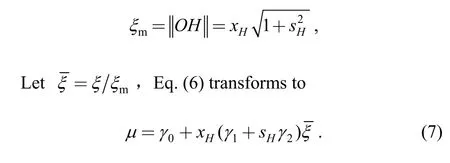
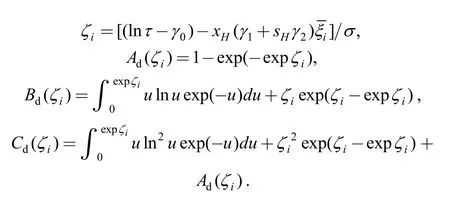
Eq.(7) is the standardized life-stress relationship.Then,the problem of determining V-optimality degenerate test plan onOHtransforms to determine single-stress optimal test plan inξOμ.Specify the censored timeτ,the total sampleNand the number of stress levelK;the stress leveland the sample location ratiospi(i=1,2,…,K) are solved by minimizing the asymptotic variance of MLE of thepth quantile of life distribution under normal stress.The optimization model can be described as follows:
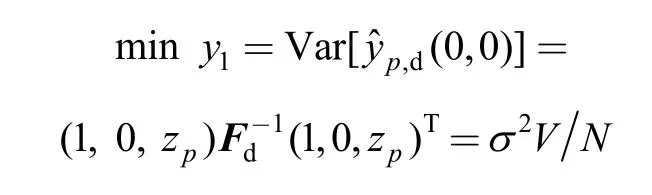
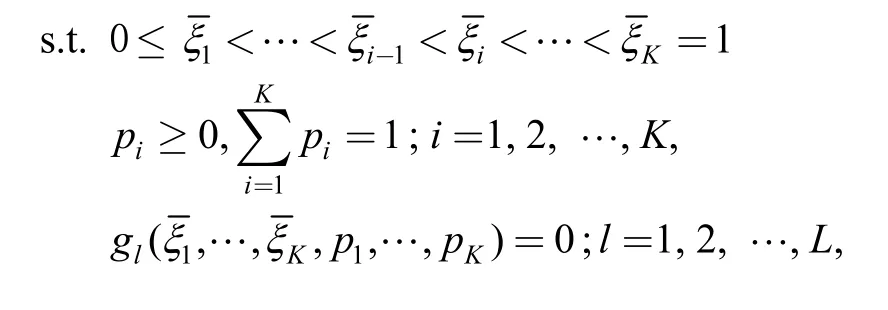
where
When determining the optimal test plans,two or three stress levels could be selected.For test plan with three stress levels,equally spaced test stresses is adopted and the sample location ratios of the middle test point set to be 0.2[8].
Letbe theith (i=1,2,…,K) level of the optimal single-stress test plan,andbe the sample location ratio of.The coordinates (xi,yi) of theith test pointsMiof V-optimality degenerate test plan onOHis,and the sample location ratio is.
4.1.2Determine the D-optimal non-degenerate test plan from the V-optimal test plans
As shown in Fig.2(b),draw a contourlithrough pointMi(i=1,2,…,K),the equation ofliis
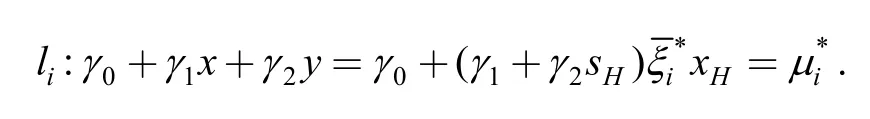
Derive the two intersection pointsMi1,Mi2betweenliand the test region boundary,let (xi1,yi1),(xi2,yi2) be the coordinate andpi1,pi2be the sample location ratio ofMi1andMi2,set[8]
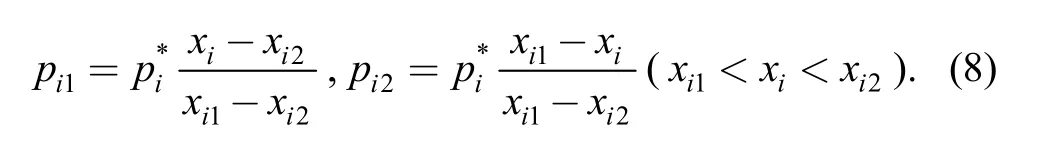
Then,the D-optimality non-degenerate test plan with V-optimality simultaneously is obtained as follows:the coordinates of test point are (xi1,yi1),(xi2,yi2) (i=1,2,…,K-1) and (xH,yH),and the corresponding sample ratios arepi1,pi2(i=1,2,…,K-1) and[8].
4.2 MFPP is not unique:the set Ψ corresponds to the segment MN on the contour(case 2)
As Fig.3(a) shows,V-optimal degenerate test plan is not unique.According to property 1,a line through the origin of coordinate and any point onMNis an optimal line,the non-rectangular region in Ref.[8]is a special case of this case.The optimal test plan could be obtained by the following steps.
(1) Select a pointHonMNrandomly and determine the V-optimal test plan onOHaccording to step (1) in case 1.
(2) Determine D-optimal non-degenerate test plan from V-optimality test plans obtained in step (1).
According to step (2) in case 1,determine the contourlithrough the pointMi(i=1,2,…,K) and the two intersection pointsMi1andMi2ofliand the test region boundary.According to property 2,li,Mi1andMi2are independent with the location of pointH.Therefore,the optimization problem in this step can be described as follows.
Determine the linefrom all the optimal lines,on which the corresponding optimal non-degenerate test plan is D-optimality.Let (xM,yM) and (xN,yN) be the coordinates of pointsMandN,the optimization model can be described as
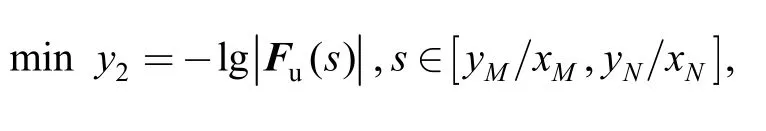
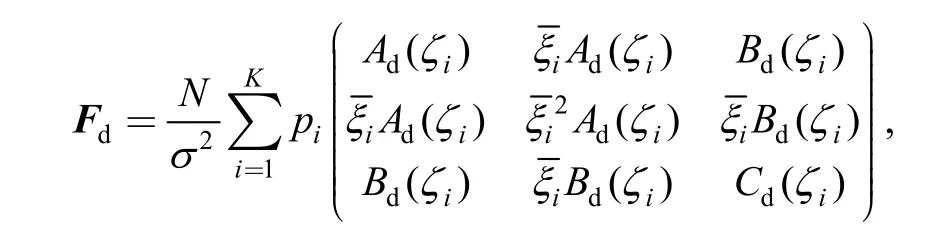
whereFu(s) is the Fisher information matrix of nondegenerate test plan,which can be described as
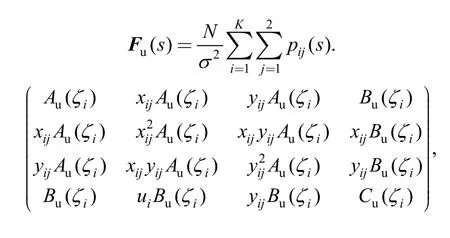
where
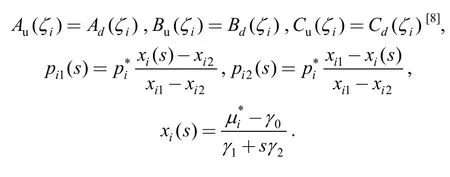
In this problem,there is only one decision variable,the slopesof the optimal line.Therefore,it becomes a continuous one-dimensional optimization problem,which is easy to be solved.
4.3 MFPP is not unique:the set Ψ is a set of discrete points on the contour (case 3)
As Fig.3(b) shows,the number of V-optimality degeneration test plan is limited,the optimal test plans could be obtained by the following steps.
(1) For each MFPP,determine the corresponding optimal non-degenerate test plan according to step (1) in case 1.
(2) Select the optimal non-degenerate test plan with best D-optimality from the plans obtained in step (1).
4.4 MFPP is not unique:the set Ψ includes points on the segment and discrete points on the contour(case 4)
As Fig.3(c) shows,the optimal plan can be obtained by the following steps.
(1) Determine the optimal non-degenerate test plans corresponding with the points on the segment according to case 2.
(2) Determine the optimal non-degenerate test plans corresponding with the discrete points according to case 3.
(3) Select the optimal non-degenerate test plan with best D-optimality from the plans obtained in steps (1) and (2).
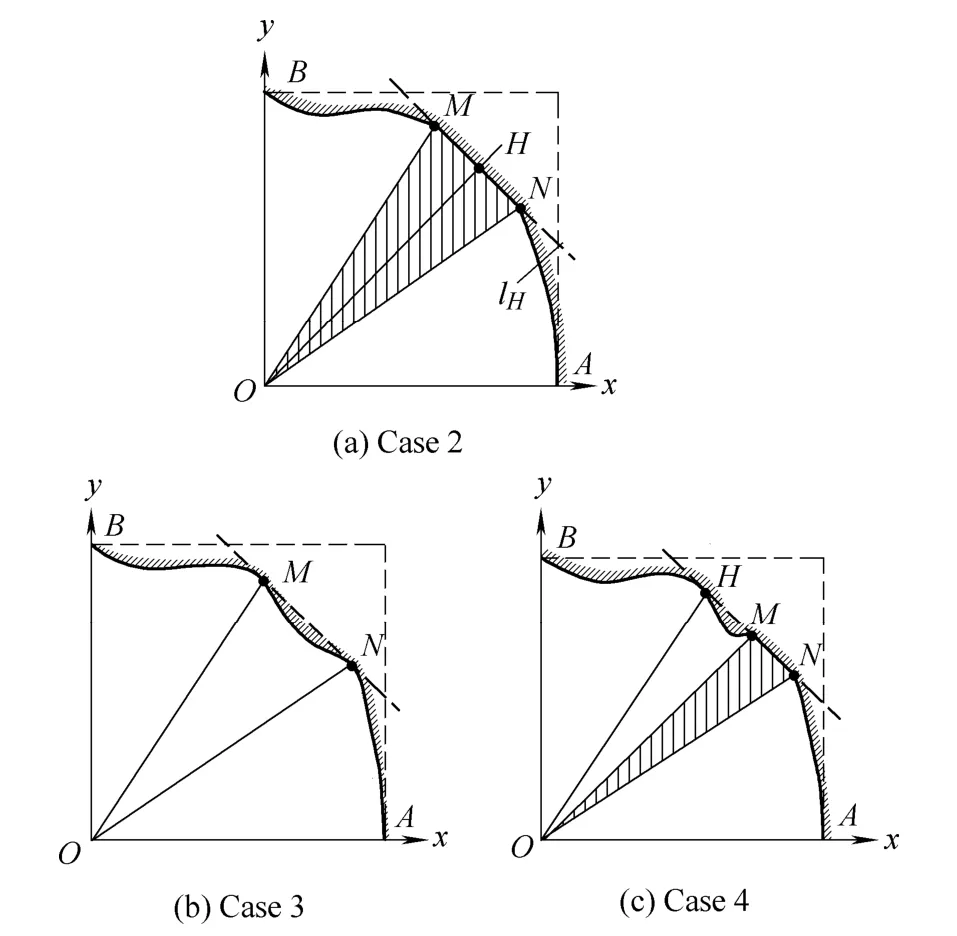
Fig.3.Sketch map of optimal degradation test plan for case 2-4
In the above four cases,the design methods of case 1 and case 2 are the foundation;case 3 is a combination of case 1;case 4 is a combination of case 2 and case 3,which is the most complex case.
5 Example
As shown in Fig.4,the boundary of test region includes the parabolaBM,the line segmentMN,NPand the arcPA.The coordinates of pointsM,NandPare (0.794 6,0.9),(0.874 8,0.484 5) and (0.874 8,0.6) respectively.The equation for each part is as follows.
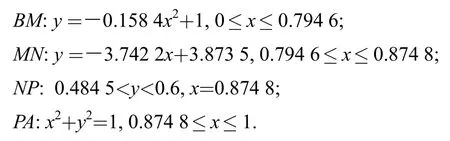
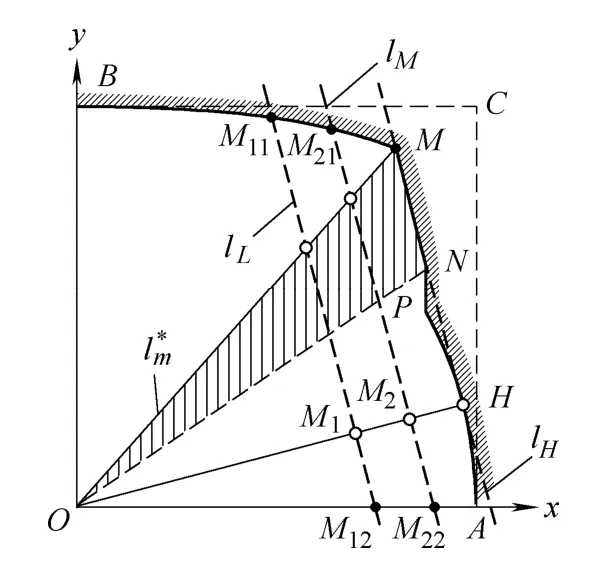
Fig.4.Sketch map of example
Specify the model parametersγ0=15.808,γ1=-11.249,γ2=-3.006,σ=0.673 4,and the censored timeτ=1 000[8].The problem here is to determine the test plan by minimizing the variance of the 0.01 quantiley0.01of life distribution under normal stress.
Theoretically,for two-stress test design,three test points are enough to estimate model parameters.Considering the deviations between the theoretical optimization model and the practice,four or five test points are adapted generally to ensure the test be successful.A plan with five test points is designed as follows.
First,find out MFPP on the boundarySABand determine the type of problem.
On the boundarySAB,from pointBtoM,failure probability is increasing monotonically.From pointMtoN,failure probability is constant as the slope ofMNis equal to the one of the life-stress relationship contour.From pointNtoP,failure probability is decreasing monotonically.From pointPtoA,the slope of the arc tangent changes from-1.458 0 to -∞,which includes the slope of the contour;therefore,failure probability of this part first increases and then decreases,and the maximum failure probability locates on pointH,the tangent point of the arc and the contour.It can be obtained that the coordinates ofHis(0.966 1,0.258 2) and the equation of contourlHthroughHisy=-3.742 2x+3.873 5.Obviously,MNis a segment onlH.Therefore,pointHand the points on segmentMNare all MFPPs,and the problem here belongs to case 4.
Determine the optimal test plan according to 4.4.
(1) According to step (1) of 4.1,determine the optimal degeneration plan on segmentOH.In this plan,the test points areM1,M2andH,the corresponding coordinates are(0.697 5,0.186 4),(0.831 8,0.222 3) and (0.966 1,0.258 2),and the sample allocation ratios are 0.52,0.20 and 0.28,respectively.The variance factor of this plan is 87.19.
(2) Draw the contourslLandlMthrough the pointsM1andM2respectively;derive the intersection points oflLandlMwith test region boundary;determine the sample location ratios on these points according to Eq.(8);then,the non-degenerate test plan corresponding to pointHis obtained.In this plan,test points areM11,M12,M21,M22andH,the corresponding coordinates are(0.490 3,0.961 9),(0.747 4,0),(0.641 4,0.934 8),(0.891 2,0)and(0.966 1,0.258 2),and the sample allocation ratios are 0.10,0.42,0.05,0.15 and 0.28.The log-determinant of the Fisher information matrix of this plan is lg|FH|=-3.378.
(3) According to step (2) of section 4.2,determine the optimal non-degenerate test plan corresponding to the points on segmentMN.It can be obtained that the optimal line is the line through the pointsOandM.In the corresponding optimal plan,test points areM11,M12,M21,M22andM,and the sample allocation ratios are 0.23,0.29,0.11,0.09 and 0.28,respectively.The log-determinant of the Fisher information matrix of this plan is lg|FMN|=-3.21.
(4) As lg|FMN|>lg|FH|,the D-optimality of nondegenerate test plans corresponding to segmentMNis better,and it is selected to be the best test plan.
The best test plan is listed in Table 1,and the solid dots in Fig.4 represent the location of test points.
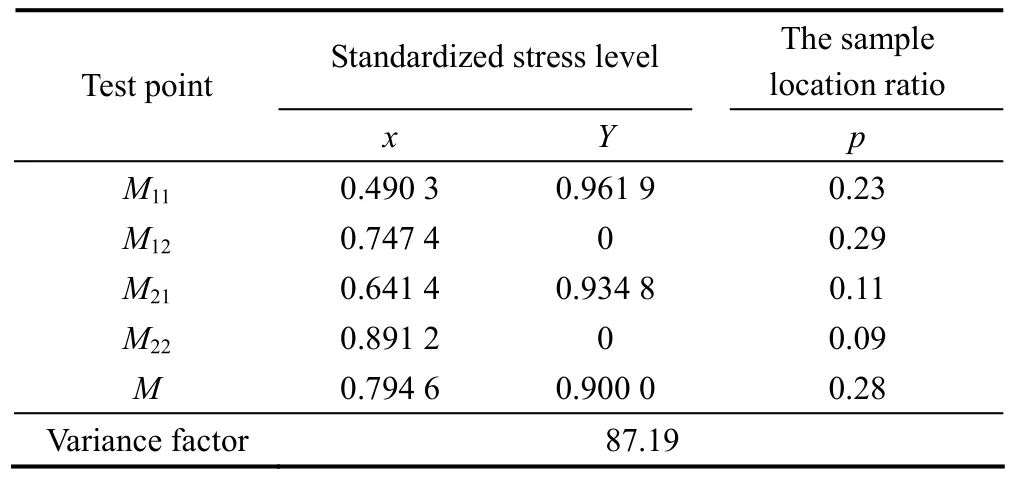
Table 1.Result of the best plan
6 Conclusions
(1) Two properties of optimal test plans are proved.They are as follows:1) Test points of optimal degradation test plan locate on the segments through the origin of coordinate and MFPPs on test region boundary.2) If optimal degradation test plan is not unique,the lowest stress points of all the optimal degradation test plans locate on the same life-stress relationship contour.
(2) The optimal design method of two-stress CSALT plan on general non-rectangular test region is proposed.The proposed method simplifies the optimization problem and presents the optimal test planning on non-rectangular test regions with arbitrary boundaries.
(3) A numerical example is adopted to illustrate the feasibility of the method.The result shows that the proposed method could obtain the optimal test plan on non-rectangular test regions with arbitrary boundaries.
(4) The theory and method for two-stress optimal CSALT planning on non-rectangular test regions is provided.
[1]NELSON W B.Accelerated testing:statistical models,test plans,data analyses[M].New York:Wiley,1990.
[2]TAN Yuanyuan,ZHANG Chunhua,CHEN Xun.Analysis of incomplete data of accelerated life testing with competing failure modes[J].Chinese Journal of Mechanical Engineering,2009,22(6):883-889.
[3]TAN Yuanyuan,ZHANG Chunhua,CHEN Xun,et al.Remaining life evaluation based on accelerated life testing[J].Chinese Journal of Mechanical Engineering,2010,46(2):150-154.(in Chinese)
[4]CHEN Juan,WANG Zhanlin,WANG Shaoping.Constant stress accelerated life test method for pneumatic cylinders[J].Chinese Journal of Scientific Instrument,2006,27(6):91-92.(in Chinese)
[5]CHEN Wenhua,LI Hongshi,LIAN Wenzhi et al.Accelerated life and statistical analysis of aerospace electrical connectors under multiple environmental stresses[J].Journal of Zhejiang University(Engineering Science),2006,40(2):349-351.(in Chinese)
[6]QIAN Ping,CHEN Wenhua,MA Zikui,et al.Research of multiple stresses accelerated life model verification method[J].Journal of Mechanical Engineering,2010,46(24):156-161.(in Chinese)
[7]CHEN Wenhua,LIU Junjun,PAN Jun,et al.Theory &method for optimum design of accelerated life test plan under step-stresses[J].Journal of Mechanical Engineering,2010,46(24):182-187.(in Chinese)
[8]ESCOBAR L A,MEEKER W Q.Planning accelerated life tests with two or more experimental factors[J].Thchnometrics,1995,37(4):411-427.
[9]PARK J W,YUM B J.Optimal design of accelerated life testing with two stress[J].Naval Research Logistics,1996,43:863-884.
[10]GUO Huairui,PAN Rong.D-Optimal reliability test design for two-stress accelerated life tests[C]//Proceedings of the 2007 IEEE IEEM.Singapore,Dec.2-4,2007:1 236-1 240.
[11]YANG Gangbin.Accelerated life tests at higher usage rates[J].IEEE Transactions on Reliability,2005,54(1):53-57.
[12]FU Yongling,HAN Guohui,WANG Zhanlin,et al.Optimization design of twin-stress constant accelerated life test for cylinders[J].Journal of Mechanical Engineering,2009,45(11):288-294.(in Chinese)
[13]CHEN Wenhua,FENG Hongyi,QIAN Ping,et al.Theory &method for optimum design of accelerated life test plan under multiple stresses[J].Journal of Mechanical Engineering,2006,42(12):101-105.(in Chinese)
[14]CHEN Wenhua,QIAN Ping,MA Zikui,et al.Optimum design of multiple stress accelerated life test plan under periodic inspection[J].Chinese Journal of Scientific Instrument,2009,30(12):2 545-2 550.(in Chinese)
[15]QIAN Ping.Research on multiple stresses accelerated life test and statistical analysis of aerospace electrical connector[D].Hangzhou:Zhejiang University,2010.(in Chinese)
Biographical notes
CHEN Wenhua,born in 1963,is currently a professor of mechanical design atZhejiang UniversityandZhejiang Sci-Tech University,and the director ofZhejiang Province's Key Laboratory for Reliability Technology of Mechanical &Electrical Products,Zhejiang Sci-Tech University,China.He received his PhD degree in mechanical manufacture fromZhejiang University,China,in 1997.He is mainly engaged in the research of reliability design and test,and statistical analysis.
Tel:+86-571-87 952849;E-mail:chenwh@zstu.edu.cn
GAO Liang,born in 1981,is currently a PhD candidate atDepartment of Mechanical Engineering,Zhejiang University,China.He is mainly engaged in the research of reliability design and testing,and statistical analysis.
E-mail:gaoliangth@163.com
LIU Juan,born in 1982,is currently a PhD candidate atZhejiang University,China.She received her bachelor degree fromNanjing University of Science and Technology,China,in 2006.Her research interests are concentrated on reliability testing and statistical analysis.
E-mail:liuxjuan1983@163.com
QIAN Ping,born in 1983,is a docent atSchool of Mechanical and Automatic Control,Zhejiang Sci-Tech University,China.She received his PhD degree fromZhejiang University,China,in 2010.Her research interests include modeling and statistic analyzing of accelerated life testing/degradation testing,design of Testing Plans,estimating of system reliability.
Tel:+86-571-86 843368;E-mail:hustchampion@sohu.com
PAN Jun,born in 1974,is an associate professor atZhejiang Sci-Tech University,China.He received his PhD degree fromZhejiang Sci-Tech University,China,in 2011.His research interests include modeling and statistic analyzing of accelerated life testing/degradation testing,design of testing plans,estimating of system reliability.
Tel:+86-571-86 843742;E-mail:panjun@zstu.edu.cn