Numerical Simulation of Pressure Fluctuations in a Large Francis Turbine Runner
2012-01-20WANGFujunLIAOCuilinandTANGXuelin
WANG Fujun *,LIAO Cuilin ,and TANG Xuelin
1 College of Water Conservancy &Civil Engineering,China Agricultural University,Beijing 100083,China 2 China Institute of Water Resources and Hydropower Research,Beijing 100038,China
1 Introduction
Francis turbines usually experience unsteady pressure fluctuations,especially at partial loads.The pressure fluctuation is becoming more severe in large turbine units,and may cause the parts to flaw or even break,which substantially influences the steadiness of hydraulic turbine operation[1].
Much attention has been occupied by these issues.Experimental and numerical methods are employed to study the unsteady feature.RUPRECHT,et al[2],compared numerical results with experimental data from model tests to show that the amplitudes and frequencies in draft tube agreed quite well.WANG,et al[3],compared simulation results with experimental data of a prototype hydraulic turbine,and indicated that the flow details in hydraulic turbine are well simulated.The authors also did similar research work by numerical and experimental approaches in large hydraulic turbines[4-5].
However,until now,most investigations in this field have been mainly focused on the pressure pulsation induced by the vortex rope in draft tube[6].Prototype test and experimental measurements of pressure fluctuation in runner are difficult to carry out and cost too much since flow paths are rotating with the runner,transducer cannot be easily installed[7-8].The pressure pulsation in runner of a large Francis turbine usually could not be obtained by similarity law from model test[9].Therefore,numerical simulation is a good way to predict pressure pulsation in runner and improve understanding of the flow at part-load operation.
The use of computational fluid dynamics(CFD) for the computation of turbomachinery flows has significantly increased in recent years[10-11].When simulating unsteady flows,such as the pressure fluctuations,large eddy simuation(LES) is usually the ideal method.However,the pressure fluctuations in a large hydraulic turbine runner are dominated by large turbulent scales.This special unsteady flow can not be resolved by LES without too fine meshes[12].Therefore,Reynolds-averaged Navier-Stokes(RANS) approach is a alternative method that could be used to obtain a resolution within a acceptable accuracy at an affordable cost.
In this paper,a 3D geometry model including the full flow passage of a large Francis turbine is setup.The numerical method based on RANS for predicting the pressure fluctuation in runner is investigated and the numerical simulation is performed.The features of pressure fluctuations in runner are analysed in detail.
2 Numerical Models and Computational Schemes
2.1 Geometry and grid
The hydraulic turbine investigated is a Francis turbine with a rated output of 710 MW.The outlet diameter of the turbine runner is 9.8 m.There are 24 stay vanes,24 guide vanes and 15 blades in the runner.X-shape blades are adopted for the runner,which is designed to adapt to a wide water head variation with stable operation and excellent cavitation performance.The rated speed is 75 r/min.
The computational domain including the full passages of spiral case,stay vane,guide vane,runner and draft tube is built for the simulation.The meshes of five computational domains including the passages of spiral case,stay vane,guide vane,runner and draft tube are generated separately.The unstructured mesh with tetrahedral element is used in all three computational domains.A localized refinement of mesh is employed at regions close to runner blade leading and trailing edge in order to accurately capture the flow field structure.This is because the flow field properties variation such as pressure and velocity at these regions are expected to be substantial.Fig.1 shows the grid assembly of spiral case,stay vane,guide vane,runner and draft tube sections.The whole computational domain consists of 1 297 329 elements.
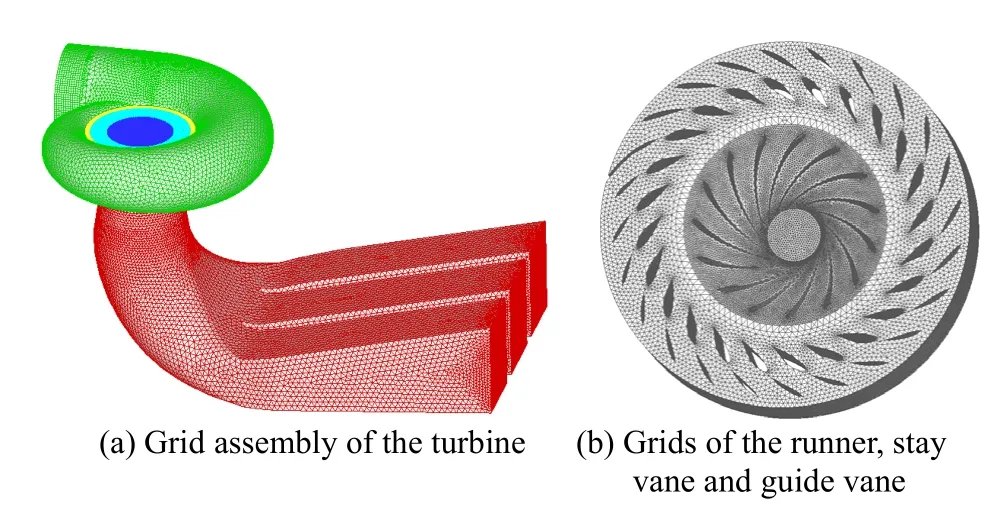
Fig.1.Computational grid for the full passage
2.2 Turbulence model and discretization scheme
At present study,the commercial CFD code,CFX is used.The time-dependent RANS method with twoequation renormalization group (RNG)k-εand shear-stress transport (SST)k-ωmodels are adopted.The walls are modeled using a scalable wall function.Validation of this code can be found from the work done by LIAO[13]and other contributions[3,14].
The governing equations are discretized using the control-volume technique with the semi-implicit method for pressure-linked equations consistent(SIMPLEC)scheme and pressure implicit with splitting of operators(PISO) scheme[12].A second-order upwind scheme is used for the convection terms with a central difference scheme for the diffusion terms in the momentum equations.And the second-order upwind scheme is also employed to discretize other equations,such as turbulent kinetic energykequation.
2.3 Transient rotor-stator interaction and boundary conditions
The current numerical computation is carried out with a multiple frame of reference approach because the runner flow field is within a rotating frame whereby the spiral case,stay vane,guide vane sections and draft tube are in stationary frame.The simulation is based on transient rotor-stator condition with the following boundary conditions imposed:at the inlet of the spiral case,the mass flow rate,the turbulence intensity and a reference pressure are specified.The absolute velocity at the inlet is defined in such a way that is perpendicular to the inlet mesh surface.Turbulent intensity is specified to be 5%.At the outlet of draft tube out flow condition is being specified as well.All the other variables are free to float.The passage walls for the spiral case,stay vane,guide vane sections and draft tube are in stationary frame and modeled using a no-slip boundary condition.It is also should be mentioned that the inlet boundary condition,the velocity condition,is obtained by a prior steady flow calculation for the turbine at given operation condition.
In this numerical simulation,the meshes of the guide vane and the runner,also the meshes of the runner and the draft tube,are connected by means of a transient rotor-stator interface.The two frames of reference,rotating and stationary,are connected in such a way that for transient calculations the relative position of the runner and guide vane changes and updates through out the calculations for each time step.A total 5 revolutions or total time of 4 s is set for the computations.The time step is set as 0.008 s,corresponding to a rotating angle of 3.6°per time step,that is 100 steps for one revolution of the runner.The maximum iteration loops is set to 5 in order to reduce all the root means square residual.
2.4 Recording points
To observe the pressure distribution on the runner blade surfaces,9 recording points were set up on the pressure surface and suction surface of the runner blade respectively,as shown in Fig.2.Here,1,2,and 3 recording points are close to runner crown,and 3,6 and 9 recording points are close to blade trailing edge.
3 Results and Discussions
3.1 Pressure fluctuation with different numerical models
To evaluate the effect of turbulence models and computational schemes on the simulation,two RANS models,RNGk-εand SSTk-ω,with two discretization schemes,SIMPLEC and PISO,are used.Fig.3,Fig.4 and Fig.5 show the pressure fluctuations on runner blade pressure surface points 1,5 and 9 with different numerical models under same part-load operation condition of headH=68 m,guide vane open angleα=19°.
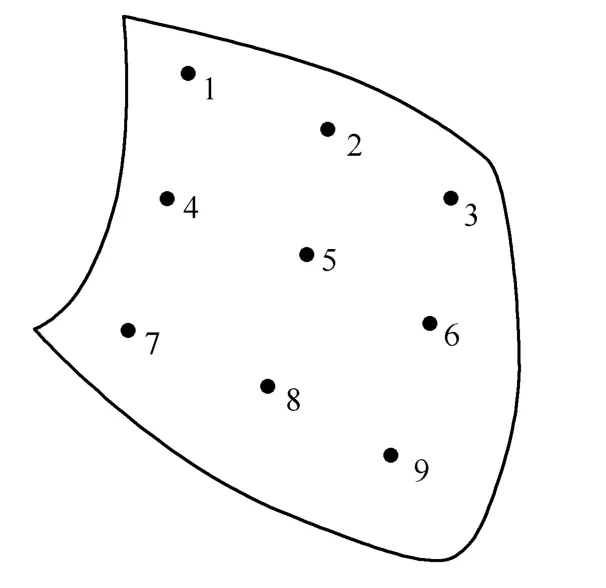
Fig.2.Recording points on the runner blade surface
The results in Fig.3,Fig.4 and Fig.5 show no significant difference between RNGk-εand SSTk-ωturbulence models,while the effect of discretization schemes on simulation results is obvious.The PISO algorithm could capture more pressure pulsation information.
The peak-to-peak values of the pressure fluctuations on pressure surface,which conducted from the above time-domain results,are shown in Table 1.For the reason of comparison,the peak-to-peak value is divided by local average pressure.The peak-to-peak value calculated by SSTk-ωwith PISO algorithm is the largest,while RNGk-εwith SIMPLEC algorithm smallest among all the peak-to-peak values whether for points 1,5 or 9.Since the peak-to-peak value reflects the dynamic load applied on the runner blade,this value is always be concerned by researchers and engineers.Usually we use this dynamic value to predict the fatigue life of blade.If the value with SSTk-ωand PISO algorithm is used to predict structure properties of a runner,a more safe prediction result would be carried out.Therefore,the SSTk-ωand PISO algorithm is adopted at the following simulations.
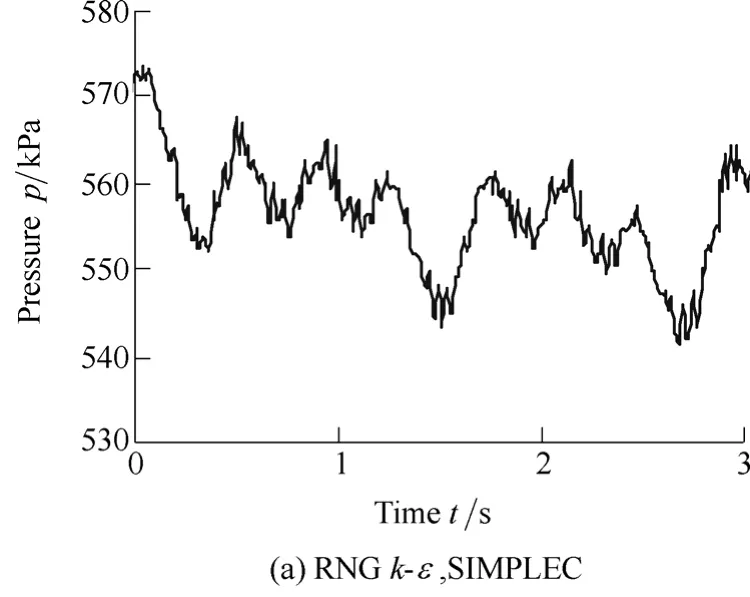
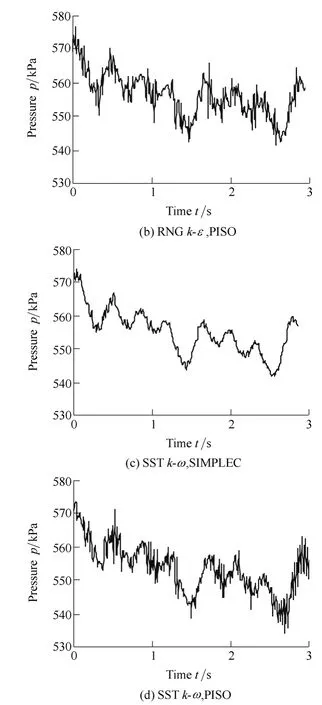
Fig.3.Pressure fluctuations at point 1 on pressure surface
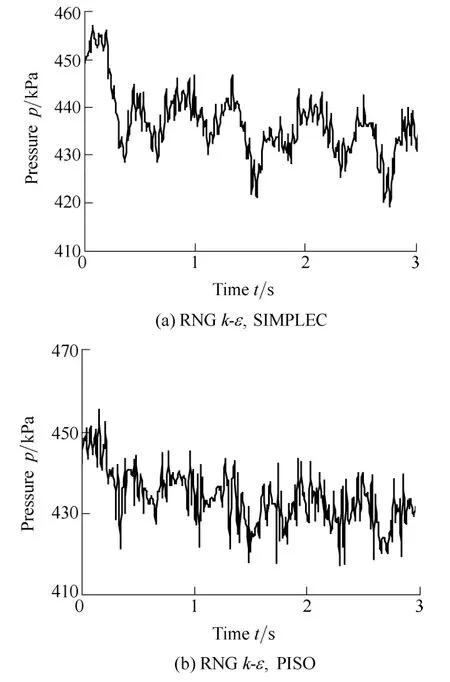
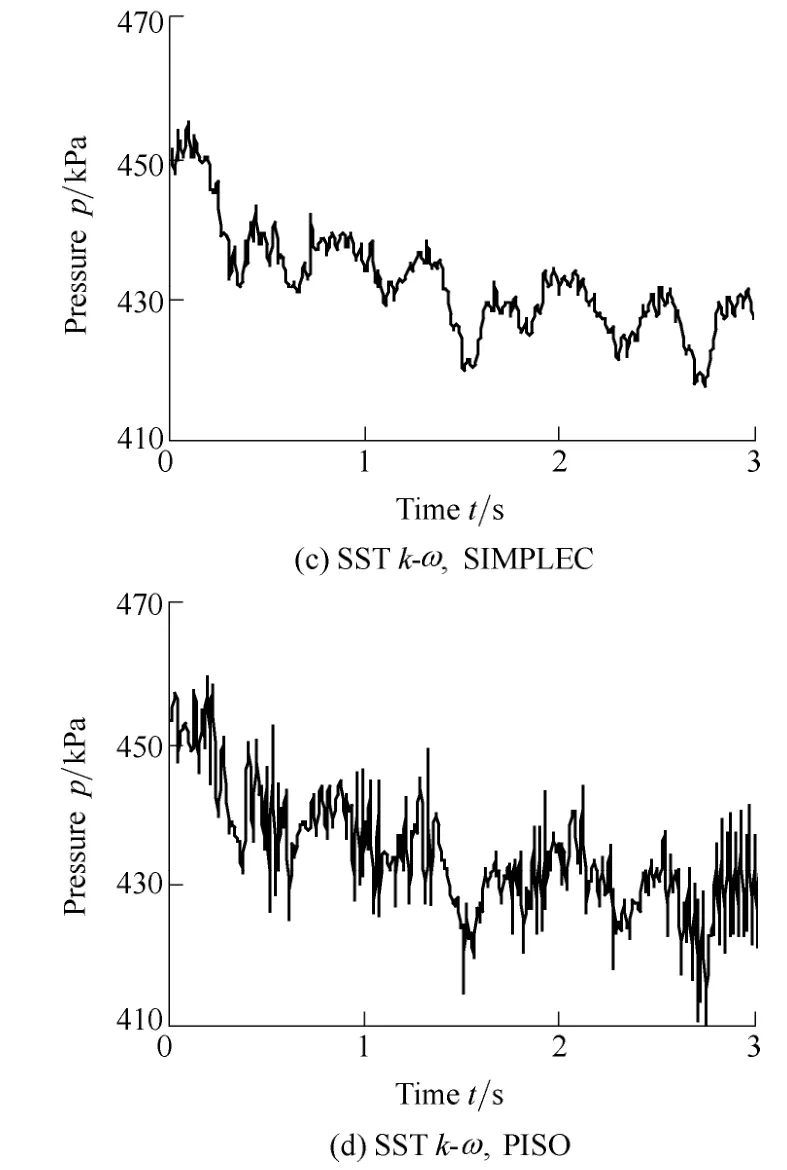
Fig.4.Pressure fluctuations at point 5 on pressure surface
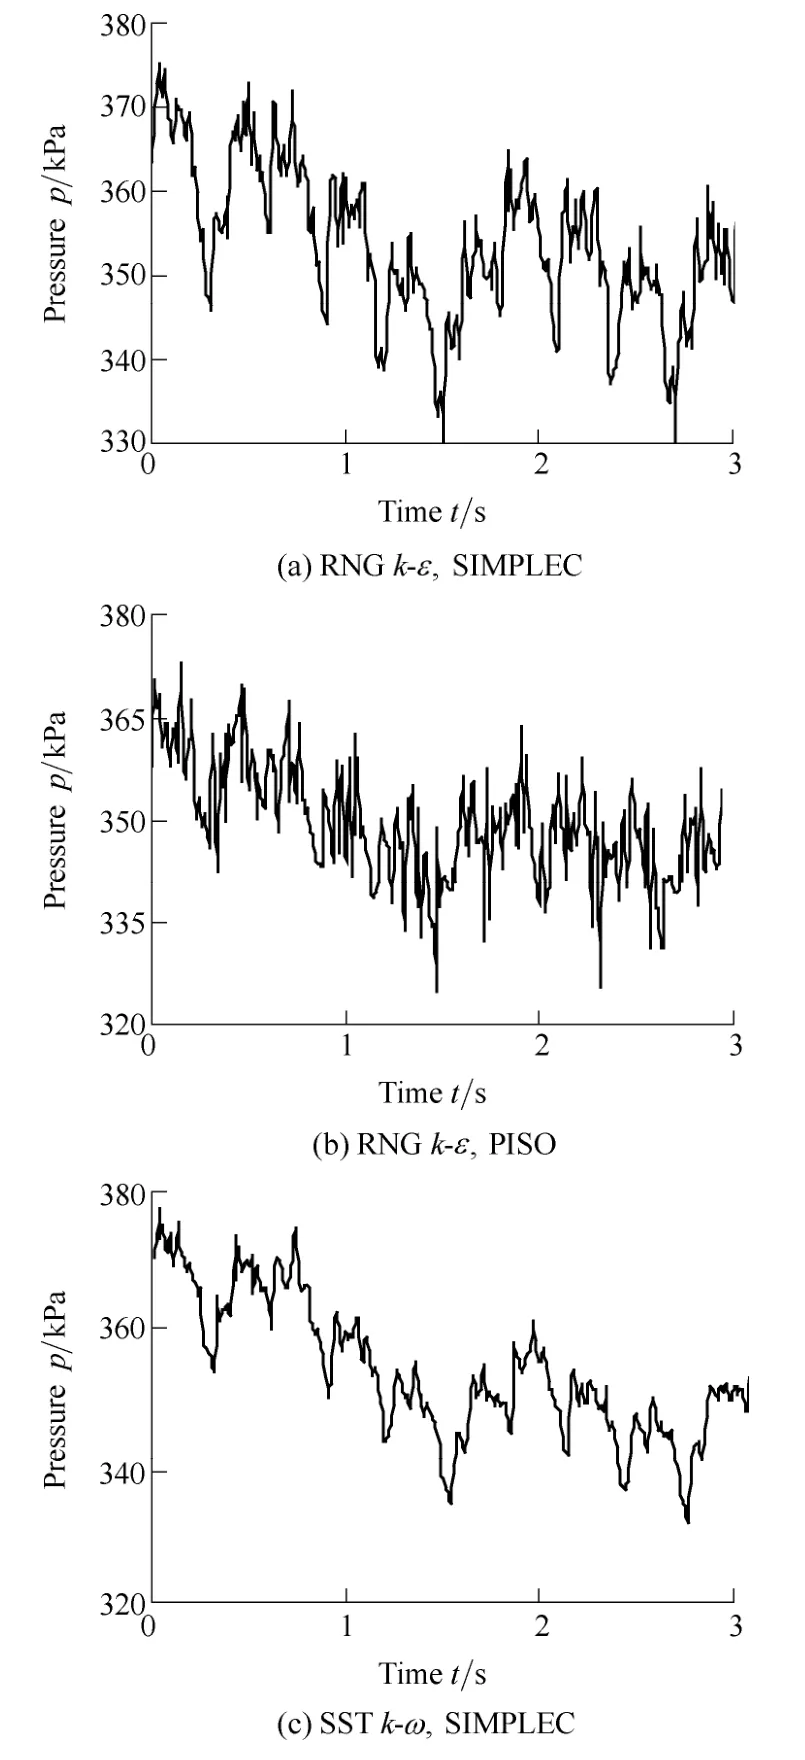
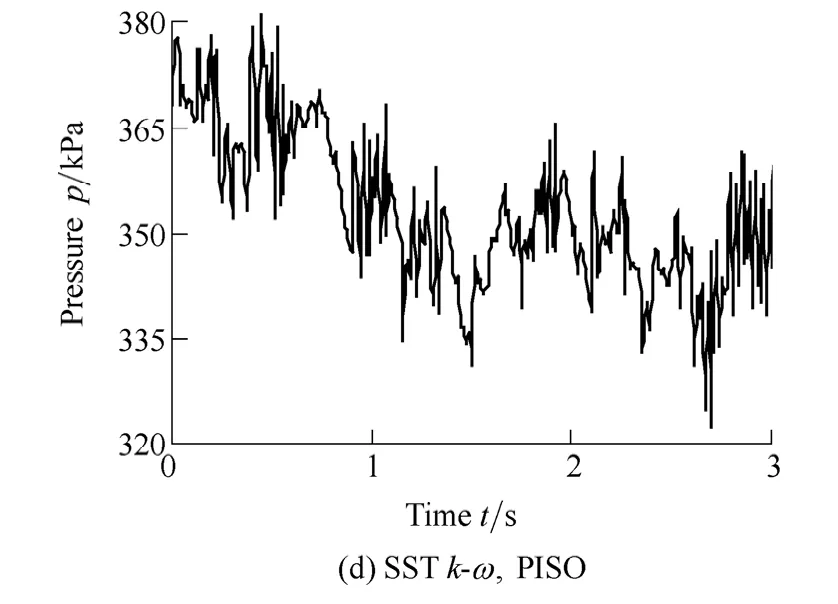
Fig.5.Pressure fluctuation at point 9 on pressure surface
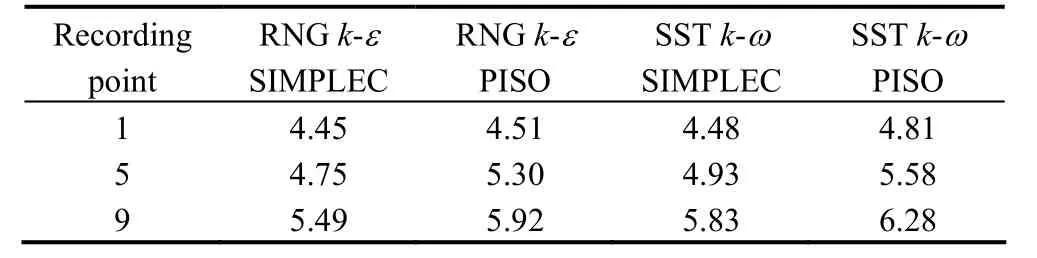
Table 1.Peak-to-peak value of pressure fluctuations %
To verify the simulation with SSTk-ωand PISO algorithm,a comparison between the simulation and experimental results[4,15]is made,as shown in Fig.6.The position concerning the pressure fluctuations is a point on the inlet section of the draft tube.The numerically calculated pressure fluctuation follows the trend very well as compared to the experimental ones.The dominant frequencies and their amplitudes for simulation and experimental results are 0.36 Hz,15 kPa,0.31 Hz,20 kPa,respectively.This indicates that the simulation with SSTk-ωand PISO algorithm could be used to predict the pressure fluctuation in the turbine in the view of engineering.
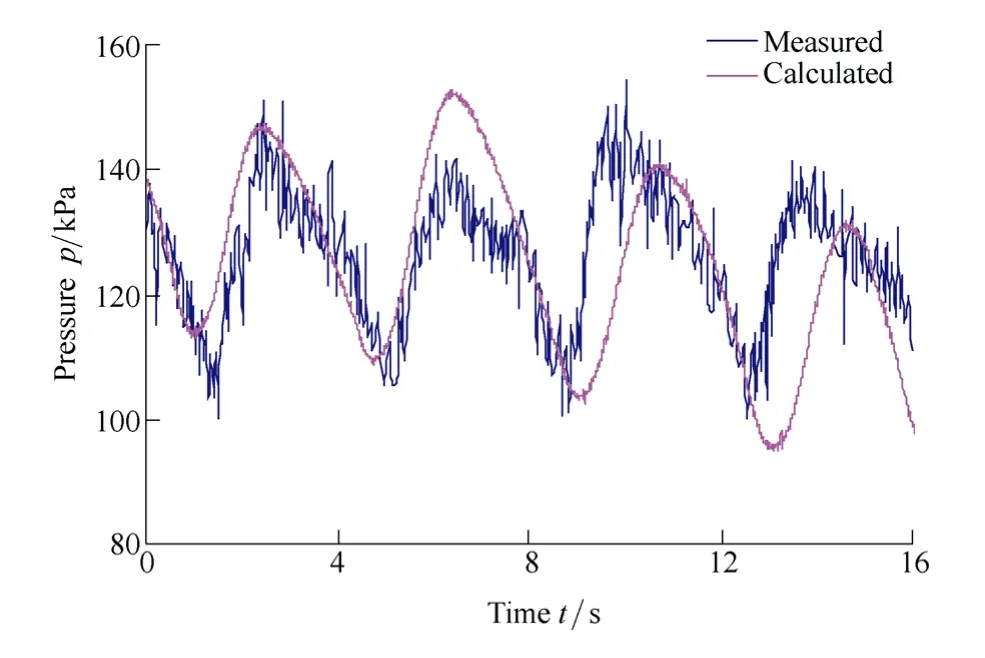
Fig.6.Pressure fluctuations for a position in draft tube
3.2 Frequency of pressure fluctuations
To evaluate the pressure fluctuations at different positions under different operation conditions,the unsteady simulations under 4 typical operation conditions shown in Table 2 are performed.
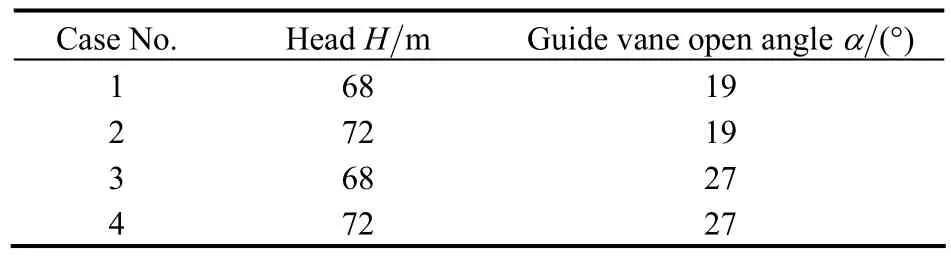
Table 2.Operation conditions for the simulations
As typical results,the amplitude spectrum of pressure fluctuations at different recording points for case 2 and case 3 are shown in Fig.7 and Fig.8 respectively.At part load condition with low guide vane open angle,the dominant frequencies of pressure fluctuations for all the points on the blade surface are very close to that in draft tube,as shown in Fig.7.It has been proved that the low frequency pressure fluctuation with about 1/3 of the runner rotating frequency dominates the unsteady flow in the draft tube by whether the site tests or the numerical simulations[4-5].There are rich low frequencies in Fig.7,especially for points 3,6 and 9.Because these points locate near the trailing edge of the blade,the flow in this region may be significant affected by vortex rope in the draft tube.This result demonstrates that the vortex rope in the draft tube not only determine the flow structure in draft tube,but also affects the flow features in runner with upstream spreading.
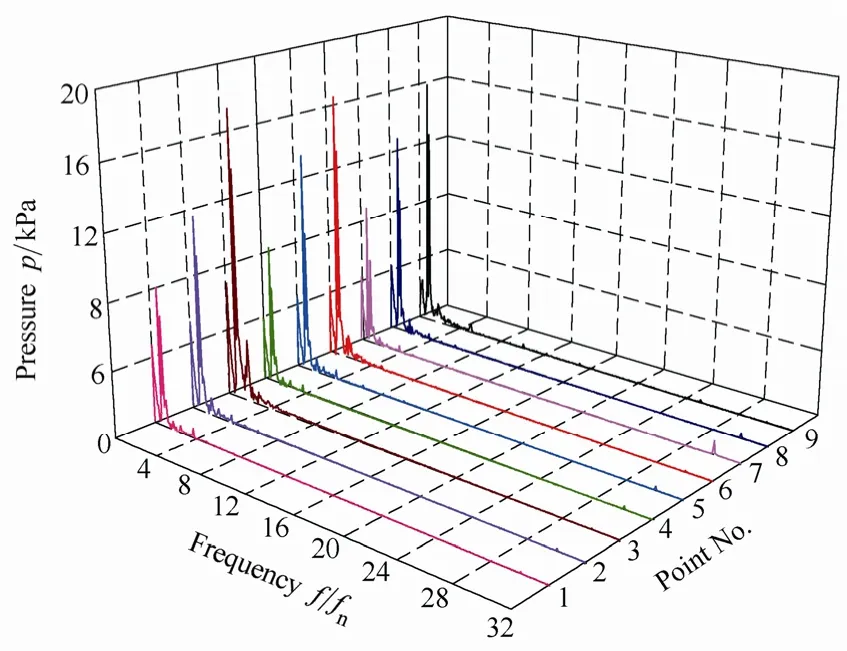
Fig.7.Amplitude spectrum of pressure fluctuations on pressure surface (for case 2)
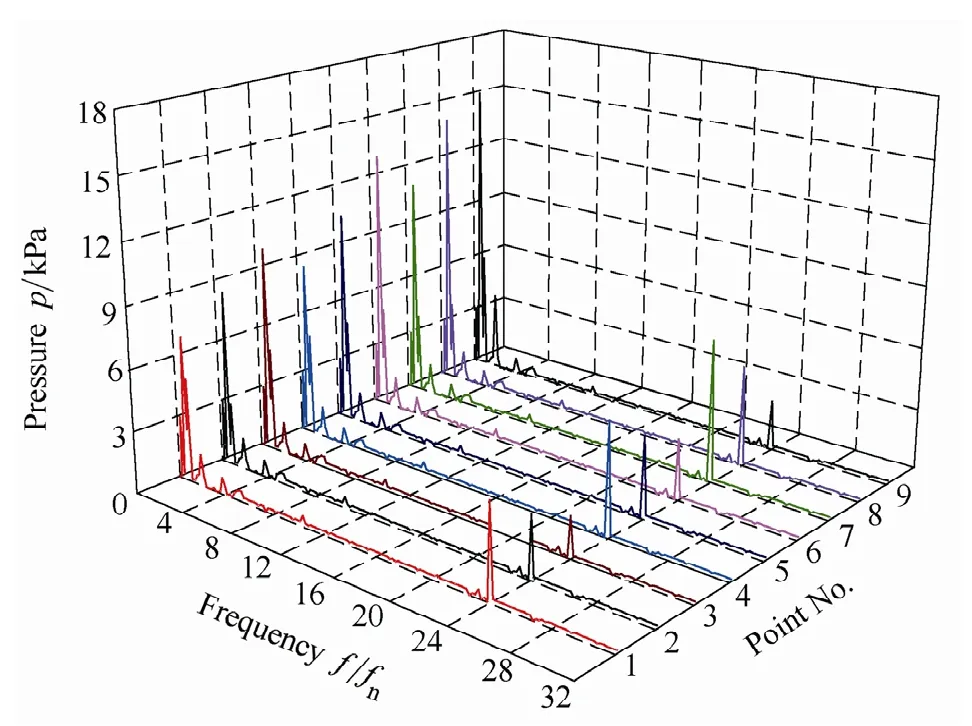
Fig.8.Amplitude spectrum of pressure fluctuations on suction surface (for case 3)
With the guide vane open angle increases,the turbine output correspondingly changes to full load condition.The pattern of amplitude spectrum of pressure fluctuations in full load condition is different with that in part load condition.We can find the evident second dominant frequency that is close to 24 times of runner rotating frequency,as shown in Fig.8.This special frequency is exactly the runner passing frequency relative to stationary guide vane.We also find that the amplitudes of pressure fluctuations for points 1,4 and 7 are larger than other points.These three points locate near the leading edge of the blade.Therefore,we can conclude that the flow structure in the guide vane has more effects on runner flow at full load condition.On the other hand,the effects of draft tube also exist,in which the low frequencies are first dominant.
According to the above discussion,it is could be concluded that the frequencies of pressure fluctuations in runner are affected by the flow in guide vane and the flow in draft tube.The first dominant frequency of pressure fluctuation in the runner is significantly determined by the flow in draft tube,especially at part load condition.This frequency is a low frequency that is approximately equal to 1/3 of the runner rotating frequency.The impact decreases from blade trailing edge to leading edge,e.g.,points 3,6,9 exhibit strong pulsations than points 1,4 and 7,also from runner band to crown,e.g.,point 9 exhibits strong pulsation than point 3.The evident high frequency of pressure fluctuation in the runner is determined by the flow in guide vane,especially at full load condition.The evident second dominant frequency is exactly equal to the guide vane passing frequency.This impact decreases from blade leading edge to trailing edge,e.g.,points 1,4 and 7 exhibit strong pulsation than points 3,6 and 9.
3.3 Amplitude of pressure fluctuation
The peak-to-peak amplitude of pressure fluctuation in the runner is the most concerned by engineers,since it directly determines the level of dynamic load applied on the runner.The amplitude also affects turbine operation stability and runner fatigue life.Fig.9 shows the peak-to-peak amplitude of pressure fluctuation on pressure surface and suction surface for 2 typical operating heads at 2 open angles.
As shown in Fig.9,the amplitude of pressure fluctuation at small guide vane open angle (α=19°) is larger than that at large open angle (α=27°) at the same operating head.This result is caused by that the vortex rope in draft tube at small guide vane open angle is strong.On the other hand,the amplitudes of pressure fluctuations at points on blade pressure surface are generally greater than that on suction surface.One of the reasons is that the suction surface of the blade is more close to the inlet of draft tube.The pressure fluctuation resulted by vortex rope in draft tube has more influence on the flow near blade suction surface.Another reason is that a large attack angle causes vortex on blade suction surface,especially at low guide vane open angle.The vortex may results to more strong pressure fluctuations.
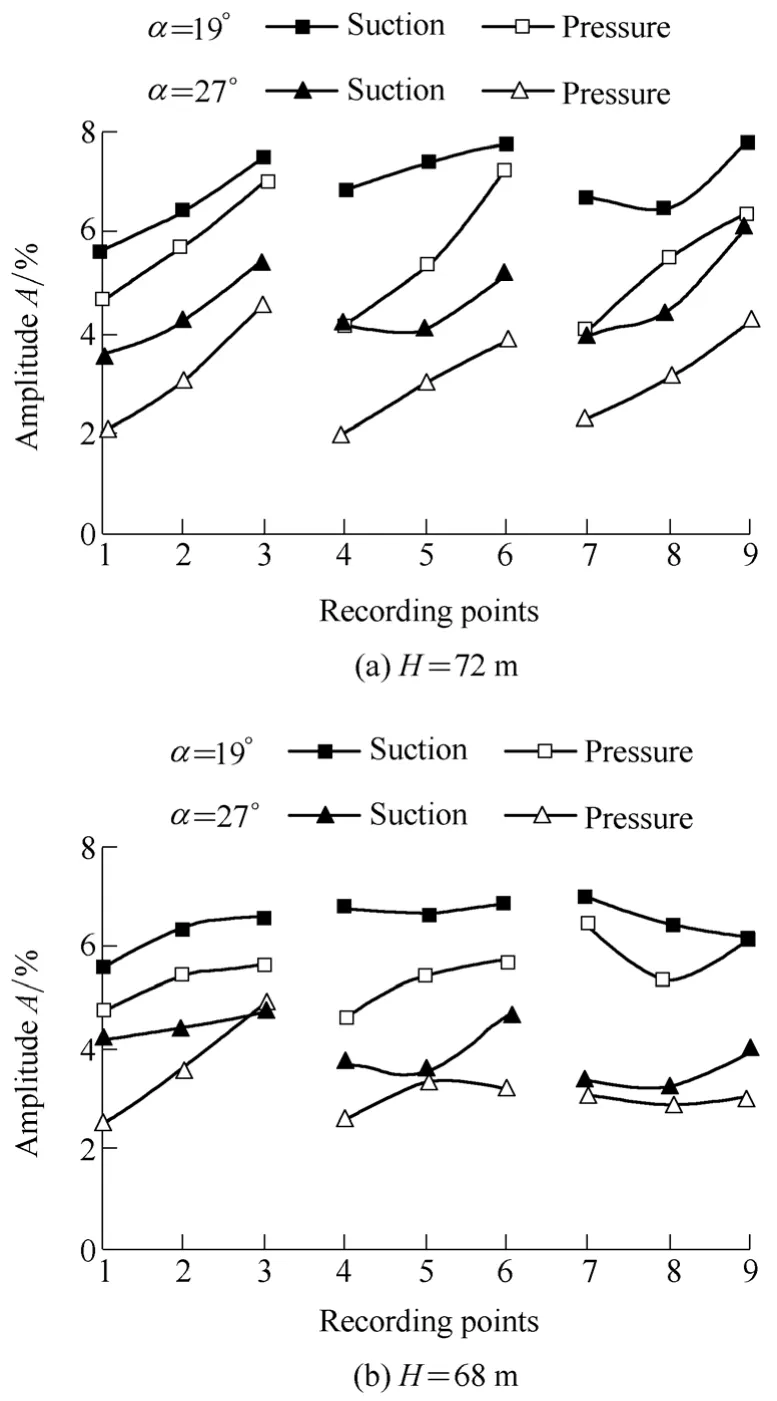
Fig.9.Peak-to-peak amplitude of pressure fluctuation in runner
4 Conclusions
(1) The PISO algorithm could capture more pressure pulsation information than SIMPLEC algorithm.The peak-to-peak amplitudes of pressure fluctuations in the runner predicted by SSTk-ωmodel are greater than that by RNGk-εmodel.The combination of SSTk-ωmodel and PISO algorithm could be more suitable for predicting pressure fluctuations in turbine runner for the reason of safe prediction in the view of engineering.
(2) The frequencies of pressure fluctuations in runner are affected by the flow in guide vane and the flow in draft tube.The first dominant frequency is significantly determined by the flow in draft tube,especially at part load condition.This frequency is a low frequency that is approximately equal to 1/3 of the runner rotating frequency.The impact decreases from blade trailing edge to leading edge,also from runner band to crown.The evident high frequency of pressure fluctuation in the runner is determined by the flow in guide vane,especially at full load condition.The evident second dominant frequency is exactly equal to the guide vane passing frequency.This impact decreases from blade leading edge to trailing edge.
(3) The peak-to-peak amplitudes of pressure fluctuations in runner at small guide vane open angle are larger than that at large open angle at the same operating head.The amplitudes at points on blade pressure surface are generally greater than that on suction surface.
[1]ARZOLA F,AZUAJE C,ZAMBRANO P,et al.Undesired power oscillations at high load in large Francis turbines:Experimental study and solution[C]//Proceedings of the 23rd IAHR Symposium on Hydraulic Machinery and Systems,Yokohama,Japan,October 17-21,2006:1-9.
[2]RUPRECHT A,HELMRICH T,ASCHENBRENNER T,et al.Simulation of vortex rope in a turbine draft tube[C]//Proceedings of the 21st IAHR Symposium on Hydraulic Machinery and Systems,Lausanne,Switzerland,2002:257-264.
[3]WANG Zhenwei,ZHOU Lingjiu.Simulations and measurements of pressure oscillations caused by vortex ropes[J].Journal of Fluid Engineering,Transactions of the ASME,2006,128(4):649-655.
[4]WANG Fujun,LI Xiaoqin,MA Jiamei,et al.Experimental investigation of characteristic frequency in unsteady hydraulic behaviour of a large hydraulic turbine[J].Journal of Hydrodynamics,2009,21(1):804-812.
[5]LIAO Cuilin,WANG Fujun,LI Xiaoqin.Numerical simulation of pressure fluctuation in draft tube of large Francis turbine[C]//Proceedings of the 5th Joint ASME/JSME Fluids Engineering Summer Conference,FEDSM2007,San Diego,USA,July 30-August 2,2007:873-878.
[6]HELLSTROM J G I,MARJAVAARA B D,LUNDSTROM T S.Parallel CFD simulations of an original and redesigned hydraulic turbine draft tube[J].Advances in Engineering Software,2007,38(5):338-344.
[7]LIAO Weili,JI Jinting,LU Peng,et al.Unsteady flow analysis of francis turbine[J].Journal of Mechanical Engineering,2009,45(6):134-140.(in Chinese)
[8]PAIK J,SOTIROPOULOS F,SALE M J.Numerical simulation of swirling flow in complex hydro-turbine draft tube using unsteady statistical turbulence models[J].Journal of Hydraulic Engineering,2005,131(6):441-456.
[9]ILIESCU M S,CIOCAN G D A.Analysis of the cavitating draft tube vortex in a Francis turbine using particle image velocimetry measurements in two-phase flow[J].Journal of Fluids Engineering,Transactions of ASME,2008,130(2):0211051-02110510.
[10]WU Yulin,WU Xiaojing,LIU Shuhong.Correlation analysis of the internal vortex flow of hydro turbine with the pressure fluctuation inside draft tube[J].Journal of Hydroelectric Engineering,2007,26(5):122-127.(in Chinese)
[11]NILSSON H,DAVIDSON L.Validations of CFD against detailed velocity and pressure measurements in water turbine runner flow[J].International Journal for Numerical Methods in Fluids,2003,41:863-879.
[12]WANG Fujun.Computational fluid dynamics analysis—CFD principles &application[M].Beijing:Tsinghua University Press,2004.(in Chinese)
[13]LIAO Cuilin.Study on hydraulic stability of large francis turbine[D].Beijing:China Agricultural University,2008.(in Chinese)
[14]SUSAN-RESIGA R,CIOCAN G D,ANTON I.Analysis of the swirling flow downstream a Francis turbine runner[J].Journal of Fluids Engineering,Transactions of ASME,2006,128(1):177-189.
[15]WANG Fujun,LI Xiaoqin,ZHU Yuliang.Experimental investigation of pressure fluctuation and vibration in a large francis turbine[C]//Proceedings of the 5th Joint ASME/JSME Fluids Engineering Summer Conference,FEDSM2007,San Diego,USA,July 30-August 2,2007:879-884.
Biographical notes
WANG Fujun,born in 1964,is currently a professor atCollege of Water Conservancy &Civil Engineering,China Agricultural University,China.He received his PhD degree fromTsinghua University,China,in 2000.His research interests include fluid machinery and computational fluid dynamics.
Tel:+86-10-62 736972;E-mail:wangfj@cau.edu.cn
LIAO Cuilin,born in 1982,is currently an engineer atChina Institute of Water Resources and Hydropower Research,China.She received her PhD degree fromChina Agricultural University,China,in 2008.Her research interests include Hydraulic turbine and computational fluid dynamics.
Tel:+86-10-68781668,E-mail:liaocl@iwhr.com
TANG Xuelin,born in 1969,is currently a professor atCollege of Water Conservancy &Civil Engineering,China Agricultural University,China.He received his PhD degree fromTsinghua University,China,in 2003.His research interests include hydraulic pumps and hydraulic turbines.
Tel:+86-10-62 736578;E-mail:xl-tang@mail.tsinghua.edu.cn
杂志排行

Chinese Journal of Mechanical Engineering的其它文章
- Algorithm for Calculating Torque Base in Vehicle Traction Control System
- Optimal Design of Multiple Stress Constant Accelerated Life Test Plan on Non-rectangle Test Region
- Evaluating Local Elasticity of the Metal Nano-films Quantitatively Based on Referencing Approach of Atomic Force Acoustic Microscopy