Fuel Consumption Potential of the Pushbelt CVT
2011-07-06VanderSluisFrancisVanDongenTomVanSpijkGertJanVanderVeldeArieVanHeeswijkAd
Van der Sluis,Francis;Van Dongen,Tom;Van Spijk,Gert-Jan;Van der Velde,Arie;Van Heeswijk,Ad
(Van Doorne’s Transmissie-Bosch Group,Netherlands)
1 Introduction
New vehicles are offered with an increasing variety of transmission types.The CVT based on the pushbelt principle is a rapidly expanding technology.In 2010 over 4 million pushbelts will be produced and installed in over 70 vehicle models worldwide.The latest design has a torque capacity of 400 N·m and covers the full range of front wheel driven vehicles[1].The increase in power density offers cost reductions for current and new applications.
The transmission choice by OEMs is based on several criteria.Governmental regulations,customer satisfaction and cost are important drivers.The end customer appreciates criteria like comfort,fun to drive,cost,performance,fuel consumption and emissions.With oil prices rising and emission legislation tightening,fuel consumption has become a primary driver[2].This is especially true for Japan and the U.S.A.where emission regulations are most strict and the choice for the most fuel efficient technology is almost mandatory.

Figure 1 Fuel consumption of FWD vehicles with several transmission types as currently available on the Japanese market.Evaluated cycle:10~15 cycle.Shown trend lines are second order curve fits.Sources:www.carstadium.net,OEM data of European applications on the Japanese market.
A recent study on the European transmission market[3]has proven the latest generation CVTs based on the pushbelt principle to be the industries benchmark concerning criteria like fuel consumption.Figure 1 confirms this status for the Japanese market.Besides offering unsurpassed comfort,fuel consumption benefits of vehicles equipped with CVT averagely lie at 10%to 15%when compared to vehicles with stepped Automatic Transmissions(AT)[3-4].OEMs like Nissan and Toyota therefore turn to CVT technology to offer fuel consumption and environmental benefits to their customers.
Moreover,CVT as a consolidating new technology still can provide substantial gain in fuel consumption through minor hardware changes enabling it to maintain and extend its benchmark status for the future.
Looking past the conventional driveline,the trend towards hybridization offers new chances.Thanks to the integrated approach enabled by CVT,present hybrid drivelines already show significant fuel consumption improvements without imposing restrictions on the level of comfort.Hybrids like the Honda Civic IMA therefore are available with CVT only.The decrease of losses in the hybrid driveline by electrification of CVT actuation components can add to the fuel consumption potential as found by the changes suggested for the conventional driveline.In the following these changes will be discussed.
2 Sources of Loss in the CVT
In the conventional driveline the combustion engine presents the largest loss of energy.For typical automotive cycles about 75%to 80%of the energy content of the fuel is lost in the engine(Figure 2).About 10%to 17%of this amount is related to idling.The CVT dissipates about 8%.Finally 12%to 16%is used for vehicle propulsion.
For a given combustion engine the CVT can offer an estimated fuel consumption reduction of up to 8.4%.This is achieved by a 60%decrease of average power losses inside the transmission.To understand this potential we have to consider the main components.

Figure 2 Calculation results(section 4)of energy losses for the Japanese 10~15 and the European NEDC cycle
Figure 3 shows the lay-out of a prototype CVT developed by VDT/Bosch for a maximum engine torque of 250 Nm.This transmission currently is used as a research object on test rig and vehicle level.It will be used for reference throughout this paper.
The main components in the transmission are:① Pump/hydraulic unit;② Torque converter(T/C);③ Pushbelt variator;④ Drive-Neutral-Reverse(DNR)unit;⑤ Final reduction.
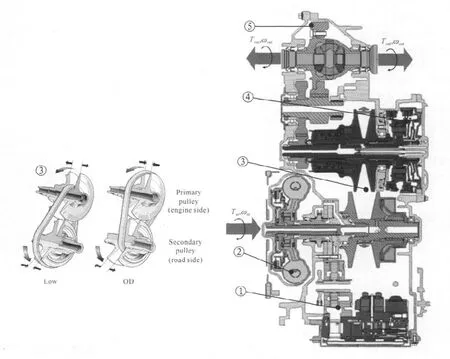
Figure 3 Variator working principle and lay-out of the reference CVT
The losses inside the CVT are distributed over the main components according Figure 4.In the following paragraphs these specific losses will be discussed in detail.
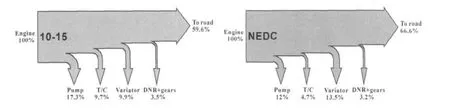
Figure 4 Calculation results(section 4)of energy losses of the CVT components for the 10~15 and NEDC cycle
2.1 Torque converter
In most CVTs a torque converter is applied.Despite cost and packaging drawbacks when compared with a clutch,its torque amplification and smoothness at launch provides preferred performance[4-5].To improve efficiency a lock-up clutch locks the torque converter above certain vehicle speeds.Optimization efforts aim at reducing losses by engaging the lock-up clutch as soon as possible.For some applications this is already feasible at 5 km/h[4].
2.2 Pump
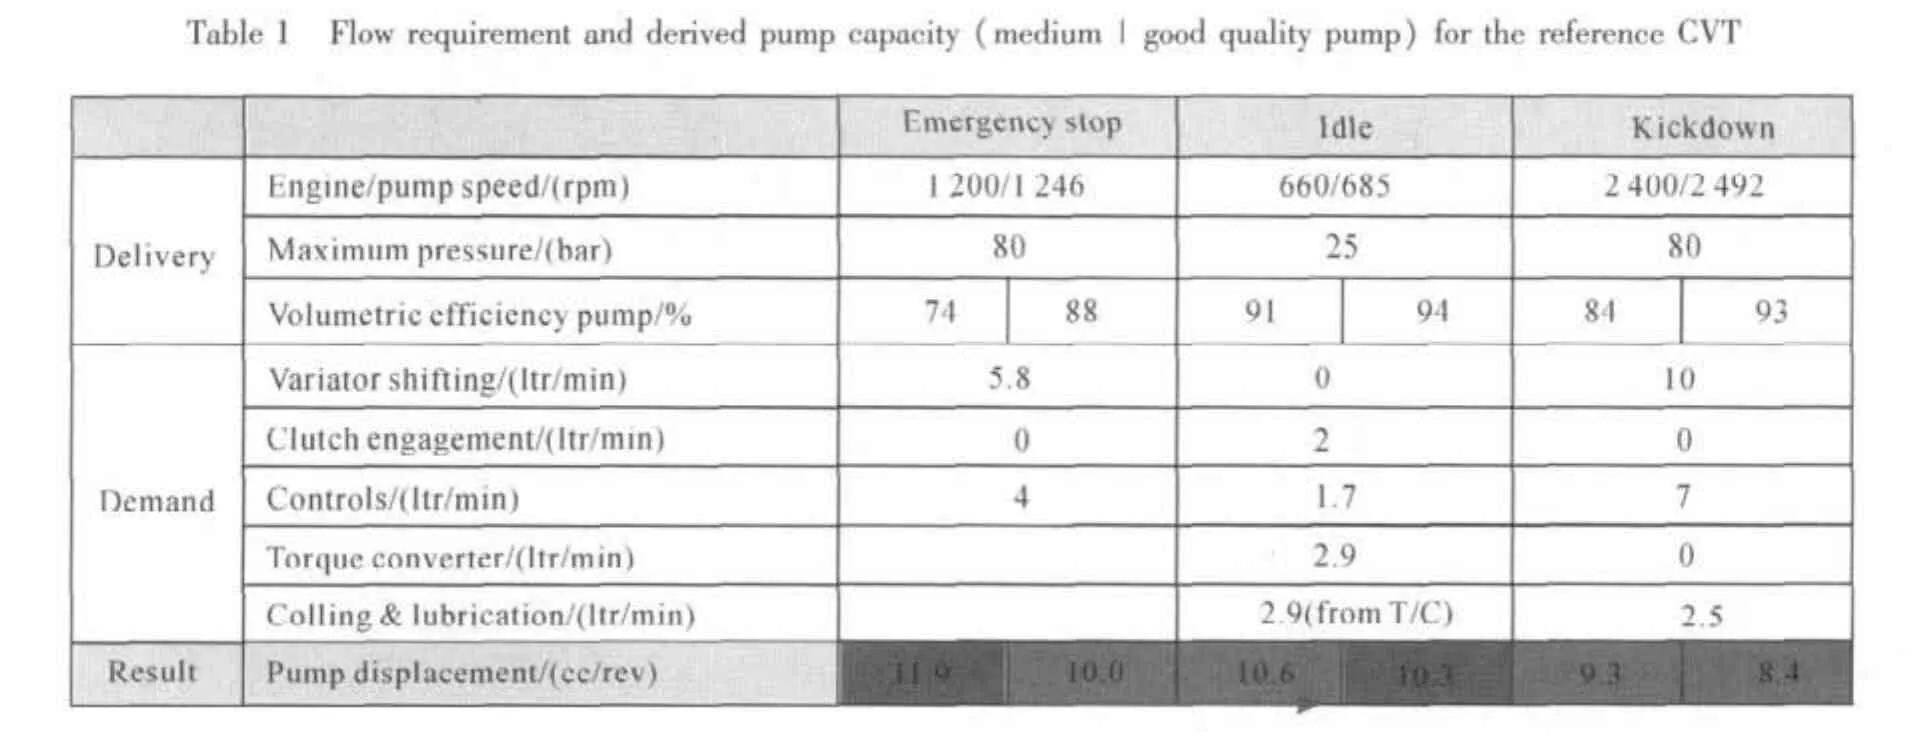
The engine driven pump provides the hydraulic energy for automation and actuation of the transmission.It delivers flow proportional to engine speed.The torque Tpumpconsumed by the pump depends on the pressure drop over the pump Δppump,its displacement volume/capacity Vthand its hydro-mechanical efficiency ηhmas in Eq.1.Pump capacity is determined by the flow Qpumprequired during an event like an emergency stop when the variator rapidly must shift from Overdrive(OD)to Low at a low pump speed npump.

Table 1 shows an example for the reference CVT.The second critical event is idle during which pump speed is low and flows as required for engaging a clutch can lead to shortages.The capacity of the pump is based on the maximum outcome of the critical events.It delivers a wasted surplus of oil in all other circumstances.
?
At low pump speed and high pressure the quality of the pump in terms of volumetric efficiency ηvolis important[6].Table 1 includes an example of a 16%difference in pump capacity between a good and medium quality pump.This causes the critical event to switch from an emergency stop to idle.Pump capacity thereby reduces from 11.9 to 10.3 cc/rev which leads to a 0.8%fuel consumption benefit over the relevant cycles.Each cubic centimetre of pump capacity that can be spared roughly saves 0.5%of fuel.
In a CVT the variator requires the highest pressure level.Functions like the clutch,torque converter and lubrication require lower pressures.All oil is supplied by a single pump and is pressurised to variator pressure first.The pump thereby delivers a surplus of flow at a surplus of pressure for most functions.In doing so it has a large impact on CVT efficiency.
2.3 Variator
The variator enables the CVT to steplessly change ratio between Low and OD.It consists of a metal pushbelt that runs over a primary and secondary pulley,each with a fixed and movable sheave.The movable sheaves are actuated by hydraulic pistons that provide clamping and ratio adjustment of the belt.Torque is transmitted by the friction between belt and pulley.
The belt contains about 400 elements of approximately 1.8 mm thickness supported by two sets of 9 to 12 rings.The large number of elements leads to a smooth and continuous running.In operation,clamping forces and torques work on the belt and result in the following sources of loss.
1)Bearing losses in the bearings of the primary and secondary variator shaft.
2)Friction losses between element and pulley.
3)Internal belt friction.
Figure 5 shows the axial clamping force on the elements to result in a radial component that is supported by the rings.The sum of radial forces exerted by the elements on the pulley is supported by the pulley shaft bearings and leads to bearing losses.Losses between elements and pulley follow from relatively small amounts of slip in the contact.Elements and rings rotate at different radii at the pulleys,causing a relative velocity between elements and inner rings and between the rings themselves.This relative velocity leads to internal belt losses.The clamping force is the main initiator for the level of losses of these three phenomena.A reduction of the clamping force leads to a reduction of the losses as illustrated in figure 5.

Figure 5 Forces working in the plane of the element on the elements and rings in the pushbelt
The clamping force Fclampdepends on the primary torque Tpri,the pulley angle λ,the primary running radius of the belt rpriand the coefficient of friction μ between belt and pulley.Some parameters are not exactly known.The primary torque and the coefficient of friction are rough estimations.Also the torque disturbances from engine or road are unknown.In order to deal with the inaccuracies and disturbances,a safety Sfon the clamping force is used as in Eq.2.

The currently applied absolute safety strategy Sf.abs=1.3 adds 30%of the maximum engine torque to the pri-mary torque over the entire torque range.At low torque the relative safety Sf.relthat uses the primary torque as a reference reaches much higher values.The minimum clamping force as enforced by the minimum pressure in the hydraulic circuit can also increase safety at low torque.Figure 6 shows the clamping force requirement at 1 500 rpm in OD with an absolute safety Sf.abs=1.3 and optimal relative safety Sf.rel=1.In this case the clamping force for the optimal strategy is limited by the minimum clamping force.In the 10~15,NEDC and FTP72 cycle the time-share during which this limitation is present is large.

Figure 6 Force,safety and efficiency for strategies Sf=1.3 and Sf=1.0 at 1 500 rpm in OD(cycle independent)and distribution of engine torque over the 10~15,NEDC and FTP72 cycle(histograms)
Safety affects variator efficiency.Figure 7 shows this relationship as measured for several variator ratios.The results have been used to verify the loss breakdown for the components of the variator over three cycles.About 60%to 65%is lost in the contact between belt and pulley.Belt internal losses account for 15%to 25%.The bearings consume 10%to 20%.

Figure 7 Variator efficiency as a function of relative safety at 1 500 rpm(measurement result test rig).Breakdown of variator losses for several cycles(simulation result)
Besides safety,losses in the contact between belt and pulley are influenced by design properties of the variator like the play between the fixed and movable sheave and the axial pulley stiffness.Both properties influence the amount of slip in the contact[7].
2.4 Hydraulic circuit
The hydraulic circuit directs actuation power from the pump to the CVT functions.The sub-circuit of the variator has an important influence on power losses.The two most commonly used circuits are shown in Figure 8.The dependent and independent pressure circuit typically are integrated in a cascade system where the variator is prioritized over an auxiliary pressure level that supplies the DNR and lock-up,and a lubrication pressure level used for cooling and lubrication.At present the reference CVT is fitted with a dependent pressure circuit.Measures have been taken to enable adaptation to the characteristics of an independent pressure circuit.
In the dependent circuit,secondary pressure equals pump pressure.The primary pressure is derived from secondary pressure and can not rise above this level.The occasionally large primary/secondary force ratio requirement(FpFs)of the variator puts a constraint on the primary piston area which for that reason needs to be about a factor 2.4 larger than the secondary piston area.The fact that the minimum pressure can not get below auxiliary or lubrication pressure is a second restriction to the achievable span of control.
These constraints do not apply to the independent pressure circuit.Both piston pressures can assume highest pressure which facilitates variator control.As each piston can be connected to sump,the pressures can be reduced to relatively low values of 1 to 2 bar[8]which enlarges the span of control even further.

Figure 8 Dependent(left)and independent pressure circuit
A disadvantage of the independent pressure circuit is the filling of the primary piston when shifting towards OD.Unlike the dependent circuit,the secondary piston does not return flow.The pump must supply the entire flow.To realise a shift speed that equals the shift speed of the dependent circuit,the primary piston area must be reduced.This raises primary pressure above secondary pressure near OD.The pump must supply this higher pressure plus the offset pressure between the line and variator pressure.Both increase the pump loss.
The ability to control low clamping forces is important for fuel consumption.As shown in Figure 6,a high minimum clamping force causes a safety increase at lower torques.The minimum clamping force depends on the achievable minimum variator pressure and on the piston area.A small piston area decreases the minimum clamping force but leads to a high maximum piston pressure at maximum torque.The limitation of maximum circuit pressure for reasons of leakage therefore results in a lower limit for the piston area.
2.5 DNR unit-Torque fuse
The DNR unit of the reference CVT is located at the road side of the variator.It consists of a planetary gear set with a drive clutch and a reverse brake.When in Drive,the drag loss of the disengaged brake is a typical loss.
Usually the DNR unit is positioned at the engine side of the variator.Locating it at the road side introduces a fuel consumption advantage.In case the drive clutch is used as a torque fuse,torque peaks from the road no longer can reach the variator.Variator safety can be lowered which increases variator efficiency and reduces required pump power.
For the reference CVT a 2.1%reduction of fuel consumption over the NEDC cycle has been measured.The torque fuse concept currently is applied in the Mercedes-Benz A/B-class vehicles where a reduction of 2.7%has been reported[9].
3 Potential for Fuel Consumption Improvement
In the previous section it was shown that the variator and the actuation system are primarily responsible for the losses inside the CVT.The concepts for the reduction of power losses are based on the following wishes:
1)reduction of slip losses and friction losses in the variator;
2)reduction of required actuation power;
3)improved balance between demanded and provided actuation power;
4)more efficient generation of actuation power.
In this section the following measures will be discussed.
1)measures inside the variator by the reduction of clamping force/safety;
2)measures to improve the hydraulic circuit.
3.1 Control strategy-reduction of clamping force/safety
The reduction of variator losses is primarily achieved by the reduction of clamping force.The optimal strategy can be realised by applying new insights showing that the pushbelt is able to withstand substantial amounts of slip over a long period of time without significant wear[10].The limits for excessive wear depend on the slip speed and clamping force settings as shown in Figure 9.Based on this insight a new control system has been designed and implemented in the reference CVT.The system uses the slip between belt and pulley as the control parameter.

Figure 9 F/v diagram with experimentally determined slip limits for a 24/9 pushbelt at 1 500 rpm and current and new control strategy
Slip is determined by comparing the geometrical ratio with the speed ratio of the variator.The geometrical ratio can be reconstructed from a measured geometrical variator characteristic.In the reference CVT the running radius of the pushbelt at the primary pulley is measured.From literature also the measurement of the axial position of one of the movable pulley sheaves is known[11].
The slip is controlled by a Single Input-Single Output(SISO)controller that adjusts the secondary piston pressure based on the slip error.The set-point for slip is chosen at the optimal variator efficiency.
At this moment only the secondary piston is used to control slip.The controller therefore is not able to take the interaction between variator ratio and slip into account.Due to this limitation,slip control is only active during 34%to 50%of the time share of the evaluated cycles.The remaining time the controller applies conventional control at a reduced safety level.During idle,slip control is not active because the speed ratio can not be de-tected.Instead,the safety is reduced based on the estimated engine torque.
The reference CVT was installed in a Mercedes-Benz A190.Certified fuel consumption measurements were performed for three cycles and two constant speeds.Reductions between the current strategy with absolute safety Sf.abs=1.3 and the new strategy are listed in Table 2.

?
The new control strategy leads to considerable fuel consumption reductions of 5%to 5.5%,values that match with previous calculations[10].For larger engines even more improvement is expected.The results are also anticipated to rise further in case slip control is expanded over the full cycle.Activities are undertaken to develop a Multi Input-Multi Output(MIMO)control that takes the interaction between ratio and slip into account.Parallel activities focus on the development of a robust slip sensor.
For the variator,developments include a more detailed investigation of the operational area of the pushbelt.For the hydraulic circuit,measures must be taken to satisfy control requirements,like an increase of the clamping force range and improved response.
The combined efforts create a more robust control system in which the influence of unknown parameters and disturbances is minimised.The critical parameter slip will be known for all situations and provide a higher degree of robustness for the pushbelt variator and the CVT.
3.2 Further measures inside the variator
Besides the reduction of safety,the decrease of the internal losses of the pushbelt is a second measure in the variator.Efforts are undertaken to reduce these losses.Benefits however are limited.The theoretical situation where the internal losses of the belt are reduced to zero achieves a maximum reduction of fuel consumption of 0.8%to 1%for the usual cycles.This result decreases in case the present control strategy is replaced by the new control strategy.
3.3 Hydraulic circuit
Paragraph 2.2 concluded that the pump delivers a surplus of flow at a surplus of pressure.The following concepts reduce the power demand by more dedicated hydraulic circuits.
3.3.1 Smart independent pressure circuit
As stated earlier the independent pressure circuit has certain advantages over the dependent pressure circuit.The offset between pump and variator pressure is a disadvantage.In an optimal setting this line pressure offset is reduced to zero in case the highest piston pressure always is controlled by the line pressure valve.In the transition point the line pressure valve switches control between the piston pressures.The lower pressure is controlled by the respective piston valve.The results of this improvement are shown in Figure 10.
For the reference CVT this measure leads to a fuel consumption reduction over the relevant cycles of about 0.25%for each bar that the pressure offset can be reduced.The concept does not require any hardware changes as can be seen in Figure 11.

3.3.2 Electrically powered pump placed in series with the main pump
In this concept,shown in Figure 11,an electrically powered pump(E-pump)is used to supply the variator.The main pump supplies oil at auxiliary pressure which typically is a factor 5 lower than variator pressure.Required pump power is almost linearly dependent on pump pressure and therefore also reduces by this number.
During a typical cycle or during driving at constant speed the hydraulic power demand to the E-pump is low due to the limited flow requirement of the variator.This positive effect is somewhat reduced by the low efficiency of the electric drive(motor,alternator,power conversion)that increases the electric power need.
The electric power need can surpass 2.5 kW during a kickdown.Present 12 V systems can not deliver this power.In such a situation the electric motor is supported by an increase of the main pump pressure.This reduces the pressure drop over the E-pump and keeps the electric power demand low.The E-motor can therefore be limited to a nominal power of 250 W.
The E-pump disconnects the variator flow requirement from engine speed while the main flow is no longer pressurised at the highest pressure level in the CVT.
These effects cause a significant reduction of actuation power.Calculations show a 2.4%to 2.6%reduction in fuel consumption for the relevant cycles driven with a conventional actuation strategy.For the new slip control strategy this effect reduces to about 1%.
The E-pump is an add-on component and as such increases system cost.In order to extend its functionality it can be included in a start-stop feature.
3.3.3 Start-stop
Start-stop systems offer a large fuel consumption benefit and already are available in CVT equipped vehicles[12].Fuel consumption improvements for the test vehicle are calculated to lie at 12.1%for the 10 ~ 15 cycle and 5.9%for the NEDC cycle.These results are based on the assumption that an engine start requires a fuel quantity equivalent to ten seconds of idling.
3.3.4 De-clutch at rest
In case the manual selector of the transmission is kept in Drive during standstill,the drive clutch remains engaged.The variator pressure stays high to support the torque from the slipping torque converter.The engine consumes extra fuel to compensate for torque converter and oil pump losses.Disengagement of the clutch during standstill reduces torque converter losses but also enables the reduction of variator pressure and related pump losses.De-clutch at rest,also referred to as neutral control,is measured and calculated to lead to a reduction of fuel consumption of 2.8%and 1.6%for the 10 ~15 and NEDC cycle respectively.In some CVT applications,de-clutch at rest is already applied[13].
4 Results
The discussed concepts for improving fuel consumption have resulted in a research program incorporating measurements and simulations.All measurements were performed in an A190 A-class vehicle with 180 N·m maximum engine torque combined with the reference CVT.
The CVT was fitted with sensors for measuring output torque of the CVT,pressures in the hydraulic circuit and shaft speeds.The measured signals were used as input for a CVT model that included component models of pump,torque converter,variator and final stage.These models were verified on test rig level.With the CVT model the engine torque could be calculated.An engine map enabled fuel consumption calculations and made a comparison between measured and calculated values possible.For the evaluated cycles and constant speeds it was found that measurement and calculation showed satisfactory resemblance to use the model for the evaluation of new concepts.
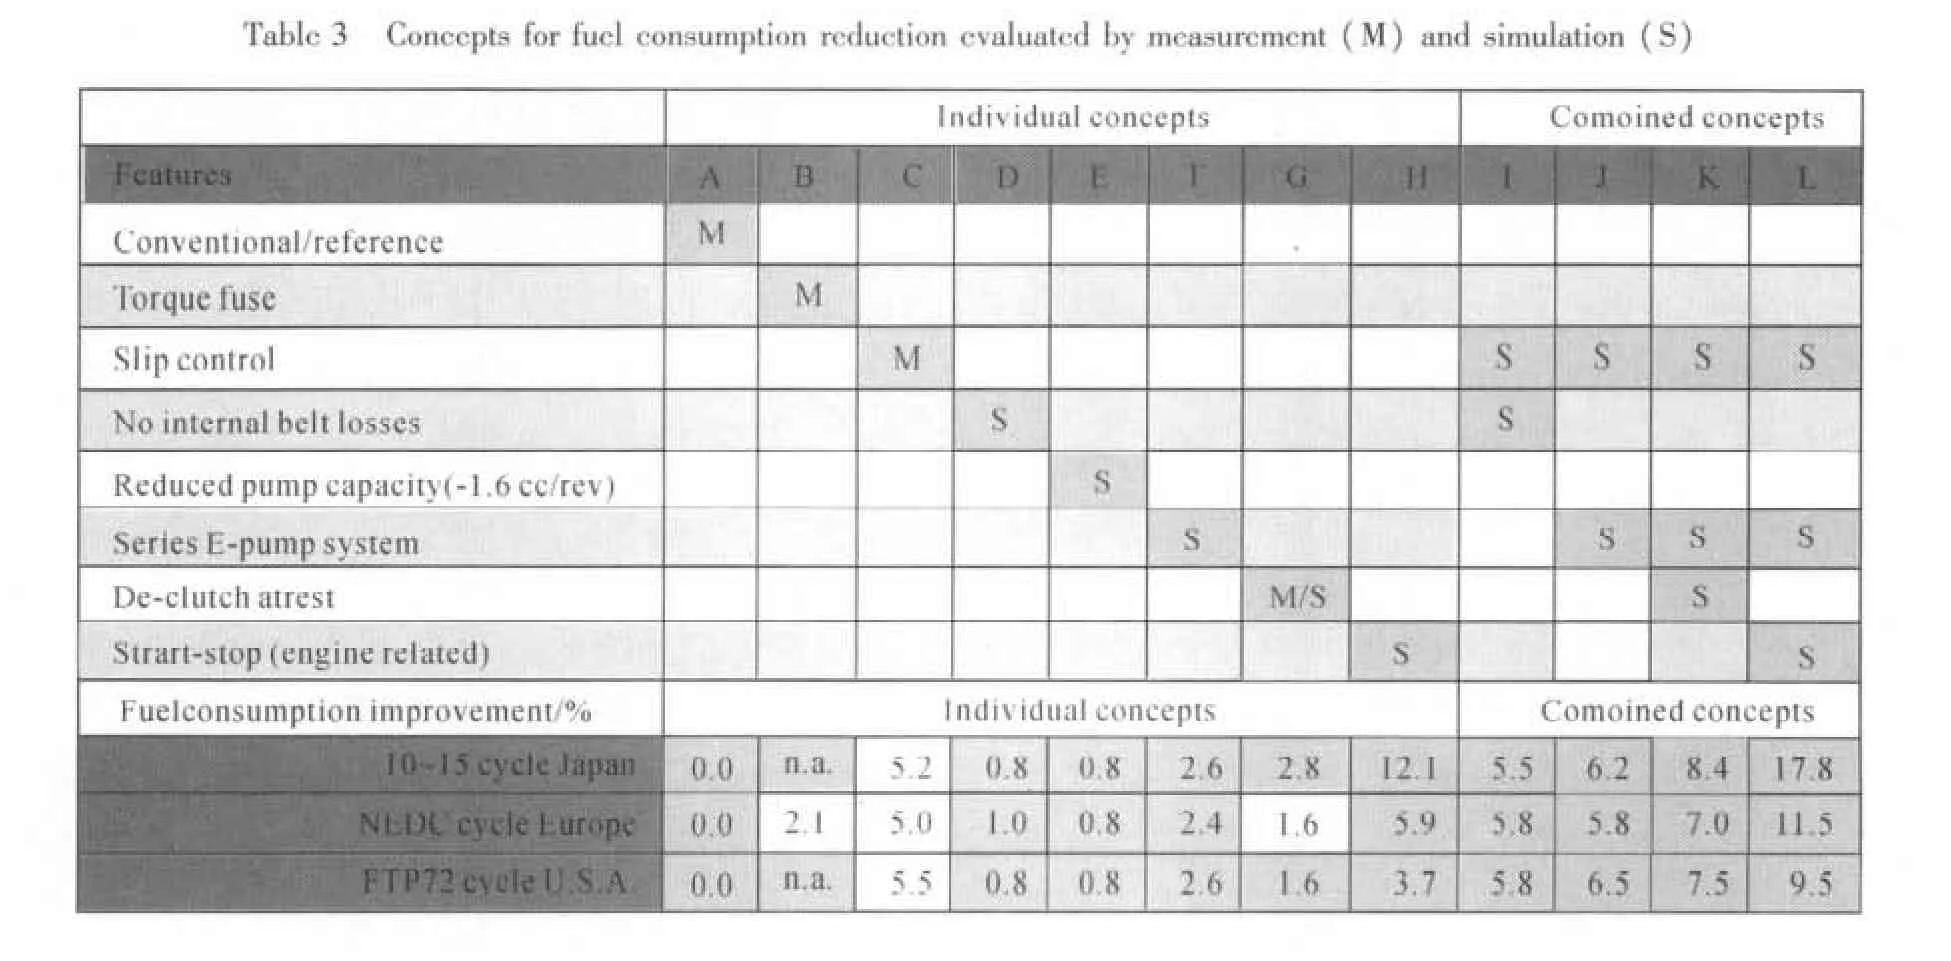
By altering the CVT model the impact of the discussed concepts for improvement could be assessed.The fuel consumption results of this assessment are shown in Table 3 and Figure 12.Some of these results have already been addressed in the previous sections.
Figure 12 shows the calculation results for the power losses of the main components.The numbers between brackets represent the fuel consumption results of Table 3.
The results show that from the measures inside the CVT,slip control offers the largest potential for fuel consumption reduction as it affects both variator and actuation system losses.The reduced pressure requirement of the variator however decreases the potential of measures inside the hydraulic system and the variator itself.The potential of the series E-pump system is for example reduced from 2.6 to 1.0 percent.The potential of the declutch at rest option is less affected by slip control as it mainly tackles the torque converter losses.
?
The optimisation of the internal losses of the pushbelt shows limited potential and does not affect the other system components.A measure like start-stop that lies outside the CVT offers a potential of 3.7%to 12.1%.
A combination of the measures slip control,series E-pump and start-stop ultimately leads to fuel consumption reductions of up to 17.8%,a figure that approaches reduction levels established by mild hybrid applications.The E-pump required for start-stop is usefully applied to also enhance the reduction of fuel consumption while driving.
From Figure 12 it is clear that the optimisation features all target their specific component.The E-pump system only influences pump losses.De-clutch at rest and start-stop target torque converter and pump losses during standstill.Slip control targets all losses with exception of the losses of the torque converter.Obviously a combination of these features offers the largest potential.
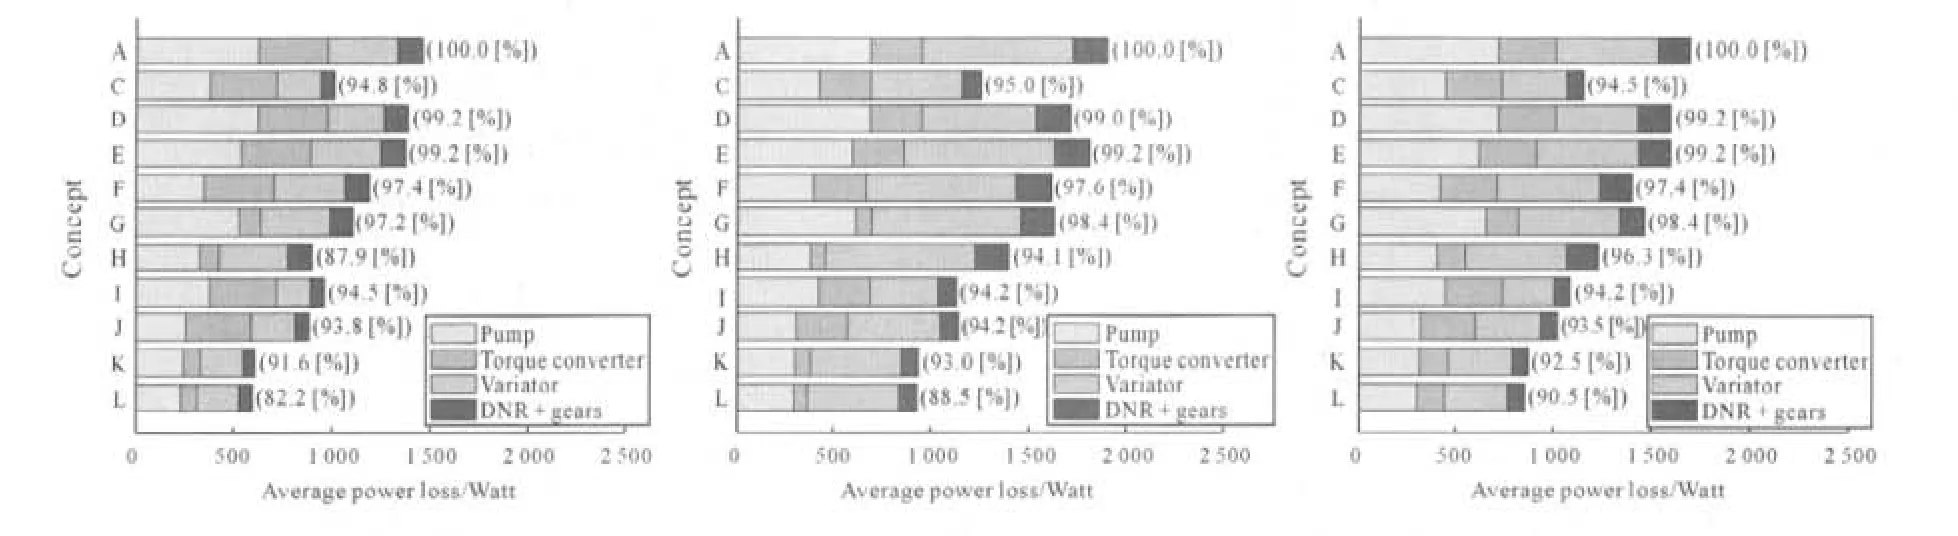
Figure 12 Power losses and fuel consumption results(between brackets)for 10~15,NEDC and FTP72 cycle
The optimisations lead to a reduced torque demand to the engine which results in a drop in engine efficiency.Further fuel consumption reductions can be achieved in case the CVT and engine control are approached integrally.This remains a topic for further investigation.
5 Conclusions
1)Fuel consumption data from the Japanese and European market show that vehicles equipped with a CVT based on the pushbelt principle currently are the benchmark.
2)The pushbelt CVT still offers a large potential for the reduction of fuel consumption by the introduction of features like slip control,an improved hydraulic actuation circuit and de-clutch at rest or start-stop.
3)The concept of slip control has been implemented in a prototype pushbelt CVT that was installed in a vehicle with a 1.9 ltr gasoline engine.
4)The fuel consumption of this vehicle has been measured.A comparison with the identical CVT with conventional control shows a 5.2%,5.0%and 5.5%reduction of fuel consumption for the Japanese 10~15,European NEDC and American FTP72 cycle respectively.
5)Improvements to the actuation system are calculated to further raise these measurement results towards a fuel consumption reduction of 8.4%,incorporating measures like an electrically driven support pump and declutch at rest.
6)An electrically driven support pump optionally enables start-stop functionality.When combined with slip control this leads to fuel consumption benefits of up to 17.8%.
7)Future work focuses on expanding the operational area of slip control and on the practical realization of this feature towards production.
[1]Van Schaik,Marco.New Phase 7 pushbelt design to cover all FWD applications[M].Paris:CTI congress,2005.
[2]Ishida,Shigeo.Recent innovations in transmission development[C]//Keynote presentation 4thCTI congress.Berlin:[s.n.],2005.
[3]Maeder,Klaus-Martin.Continuously Variable Transmission:benchmark,status and potentials[C]//Keynote presentation 4thCTI congress.Berlin:[s.n.],2005.
[4]Yamamoto,Masahiro.Hydraulic system,shift and lock-up clutch controls developed for a large torque capacity CVT[C]//paper 04CVT-07,CVT congress.[S.l.]:[s.n.],2004.
[5]Ohashi.Development of high-efficiency CVT for luxury compact vehicle[J].SAE paper ,2005(1):1019.
[6]Van der Sluis,Francis.A new pump for CVT applications[J].SAE paper,2009(1):3207.
[7]Sue,Armin.Betriebsverhalten stufenloser Umschlingungsgetrieben unter Einfluss von Kippspiel und Verformungen[D].Hannover:Dissertation University of Hannover,2009.
[8]Nishigaya Masabumi.Development of Toyota's‘New Super CVT[J].SAE paper,2010(1):872.
[9]Schultheiß.Torque fuse Regelung der Abtriebskupplung eines CVT[J].VDI Bericht 1917,2009(3):287-305.
[10]Van der Laan.Improving VDT pushbelt efficiency by control strategies based on new variator wear insight[C]//paper 04CVT-039 CVT congress.[S.l.]:[s.n.],2009.
[11]Veenhuizen.Variator slip control implemented in a production vehicle with pushbelt CVT[C]//3rdCTI congress.Würzburg:[s.n.],2004.
[12]Takahara.CVT control system for Toyota intelligent idling stop system[J].SAE paper,2008(1):1635.
[13]Tsukuda.Toyota new belt CVT for 1.3 ltr FWD cars[J].SAE paper,2006(1):1305.
