Simulation of Morphologies and Mechanical Properties of A/B Polymer Blend Film*
2011-03-22ZHAOXuezhe赵学哲DENGShengwei邓声威HUANGYongmin黄永民LIUHonglai刘洪来andHUYing胡英
ZHAO Xuezhe (赵学哲), DENG Shengwei (邓声威), HUANG Yongmin (黄永民)**, LIU Honglai(刘洪来) and HU Ying (胡英)
Key Laboratory for Advanced Materials and Department of Chemistry, East China University of Science and Technology, Shanghai 200237, China
1 INTRODUCTION
Polymer blending is an effective method for developing new polymer materials for special applications. This technology may serve as a multi-purpose approach for the development of new membrane materials, with their properties modified over a wide range. Many of polymer blends are heterogeneous on mesoscale due to the micro-phase separation between polymers, though macroscopically homogeneous. It is well known that the micro-phase separation structure of polymer blend is controlled by its composition. For the thin film of polymer blend, following structural sequence occurs as the volume fraction increases:spherical, single cylindrical, straight lamella and twisted lamella [1-5]. The macroscopic properties of polymer blends depend on the concentrations of constituents, which in turn determine the meso-structures such as the dispersion of minor component and interfacial phases. Most theoretical efforts have focused on predicting exact macroscopic properties of blends in terms of properties of pure components. The microphase separation and the mechanical behavior of copolymer as well as polymer blends have been extensively studied [6-12]. Buxton et al. have investigated the micro-phase separation of polymer blends by using Cahn-Hilliard (CH) model, the lattice Boltzmann model (LBM) and the molecular dynamics (MD)method, and considered the deformation and fracture of these systems based on the micro-mechanical lattice spring model (LSM) [8-12]. These researches are significant in the prediction of macroscopic properties of blends from their components and properties of pure polymers.
Recently, most of work is focus on the bulk phase of homogeneous or filled materials, but the research on film phase of heterogeneous materials is rare, especially for phase-separated film systems, which present morphologies and mechanical properties different from those of bulk system because of their boundary conditions.
In this work, we report the morphologies and the mechanical behavior of phase-separated polymer blend films.
In order to obtain the morphologies of polymer blends, the Monte Carlo (MC) simulation is employed[13-16]. MC simulation is a computationally efficient method to capture the self-assembled morphologies of polymer blends. Macromolecular self-assembly has attracted much interest as an efficient means to create structures at nanometer scales. Confinement effects by boundaries influence the self-assembly process and may generate novel micro-structures with potential applications. Then the micro-domains and morphologies self-assembled in a polymer blends confined between two planes are investigated systematically. Here,the MC simulation is not only important to investigate the morphologies, but also crucial to determine the mechanical behavior. The morphology obtained from MC simulation is subject to a coarse-graining process and then serves as the input to the micro-mechanical model to determine the mechanical properties of A/B polymer blend film. Finite-element method (FEM)and LSM are the main numerical methods for analyzing the continuum mechanics of a material. LSM has been shown to be algebraically equivalent to a simple FEM [17]. Most FEM micro-structural investigations employ pre-processed mesh generation. Because of this pre-process, FEM simulations are found to be computationally expensive, which limits the level of complexity that can be simulated. In order to simulate more complicated micro-structures and capture the mechanical behavior of polymer blends, LSM is adopted in this work, which is composed of a regular threedimensional lattice network of one-dimensional springs.
The lattice in LSM consists of a network of the nearest and next-nearest neighbor interactions, which are harmonic in nature. These harmonic interactions result in linear forces between nodes. The LSM can therefore be considered as a network of interconnecting one-dimensional springs. The LSM has been shown to be able to capture the elastic fields accurately in comparison with Eshelby’s well-known theoretical solution for the elastic behavior of inhomogeneous materials and used to simulate the deformation of multi-particulate systems [18]. Through LSM, we can obtain the local deformation fields and the global Yang’s modulus of polymer blend films.
In the following sections, we first briefly describe the MC simulation, which is used to obtain structural information regarding the morphologies of polymer blends. Then we detail the LSM applied to simulate the mechanical behavior of polymer blend film with given morphology. The results for the morphologies and mechanical behavior along with the volume fraction of polymer blend are presented. The effect of cavity on the mechanical property is also investigated.
2 MODEL AND METHOD
2.1 Morphologies
In order to determine the micro-phase structure of A/B polymer blend film, we adopt the MC simulation on simple cubic lattice based on the bond fluctuation and cavity diffusion algorithms [13-16]. The polymer blend film based on simple cubic lattice model with a size ofLx×Ly×Lzis used in this simulation, whereLx,LyandLzare the box dimensions. In theyandzdirections, periodic boundary conditions are employed, whereas in thexdirection, two impenetrable surfaces are located atx=0 andx=Lx+1. Each lattice site is occupied by either a segment or a vacancy. In the simulation, only the nearest neighbor interaction is taken into account, and the vacancy is neutral without any interaction with the segments and exterior surface. The morphology formation of the polymer blend confined in the film is repeated several runs using the same molecular parameters but starting from different initial configurations. The simulation information is recorded every 1000000 Monte Carlo Steps (MCSs). The system reaches the equilibrium state after 16000000 MCSs, which is identified by comparing all the recorded information.
2.2 Microchemical model
In order to simulate the mechanical behavior of A/B polymer blend film, we adopt the three-dimensional Born LSM proposed by Boxtonet al[19].
Born LSM is a numerical technique for discretizing linear elasticity theory and consists of a network of springs that represent the nearest and next nearest neighbor bonds of a simple cubic lattice. Although the Born spring model is lack of rotational invariance, it is useful in the study of heterogeneous systems because the next nearest neighbor central and next nearest neighbor bond-bending interactions can be locally changed to account for local variations in the stiffness of heterogeneous systems [20, 21]. Especially, Born spring model allows us to determine micro-mechanical property in a computationally efficient manner.
The interconnectivity of a three-dimensional lattice spring model is depicted in Fig. 1. The elastic energy associated with themth node in the cubic lattice is given by [19]

whereumis the displacement of themth node from its original position,Mmnis an element of a symmetric matrixM, which describes the interaction between nodesmandnthrough central and noncentral force constants. The central force constant energetically penalizes the spring extension, while the noncentral force constant penalizes the rotation of springs from their original orientation. The summation is over all nearest and next nearest neighboring nodes.
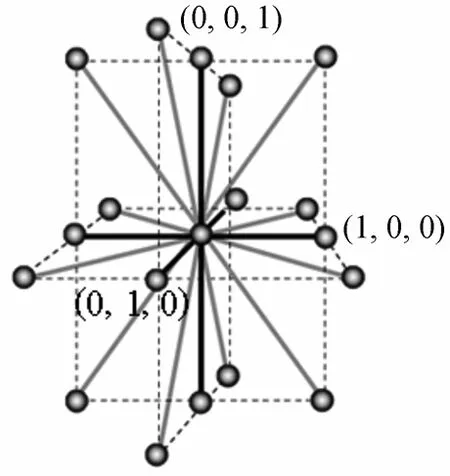
Figure 1 The interconnectivity of a three-dimensional lattice spring modelthe nearest neighbor bonds; the next nearest neighbor bonds
The central force constantkand noncentral force constantctake the following forms,
whereEandνare Young’s modulus and Poisson’s ratio, respectively [8-12, 19].
The elastic force acting on themth node is a linear function of the displacement because of the harmonic form of energy in Eq. (1). The force acting on themth node, due to the local displacement of the spring between nodesmandn, is given by

If the forces are applied to the boundary nodes with the spring constants specified, the constraint that all these linear forces must balance at each node at equilibrium results in a set of sparse linear equations.The nodal displacement can be obtained through solving a set of these equations. We now derive a set of these sparse linear equations. Fig. 2 shows various vector quantities for masses in a lattice.

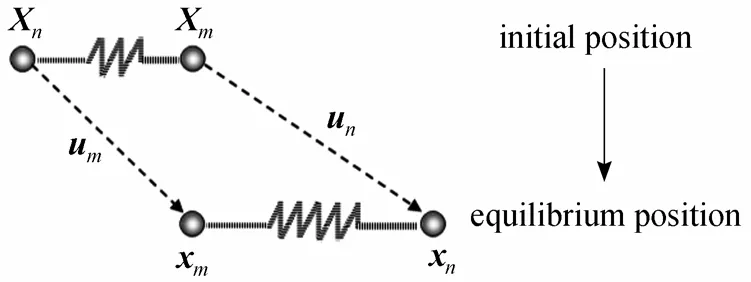
Figure 2 Various vector quantities for masses in a lattice

whereNcellis the total number of springs in a cell and Σ represents a sum over the nearest and next nearest neighboring nodes. For a three-dimensional cubic cell with nodemat the center, nodemis surrounded by six nearest neighbors and twelve next nearest neighbors,soNcellis 18. Eq. (6) represents a set of sparse linear equations. The solution is obtained by using a conjugate gradient method [9, 22] to find the equilibrium configuration without net force at each node.
Figure 3 shows two-dimensional views of interconnectivity of lattice spring model.
The stress and strain tensors are calculated from the forces and the displacement. The strain tensor is obtained by using a finite difference approximation of displacement field, which is the solution from a central difference approximation of the form

whereu(i,j,k)is the displacement field at coordinatesi,jandk, andhis the initial distance between adjacent nodes. Alternatively, forward or backward approximations are considered at system boundaries. The stress acting on a node (the center of a cubic unit cell) is defined as
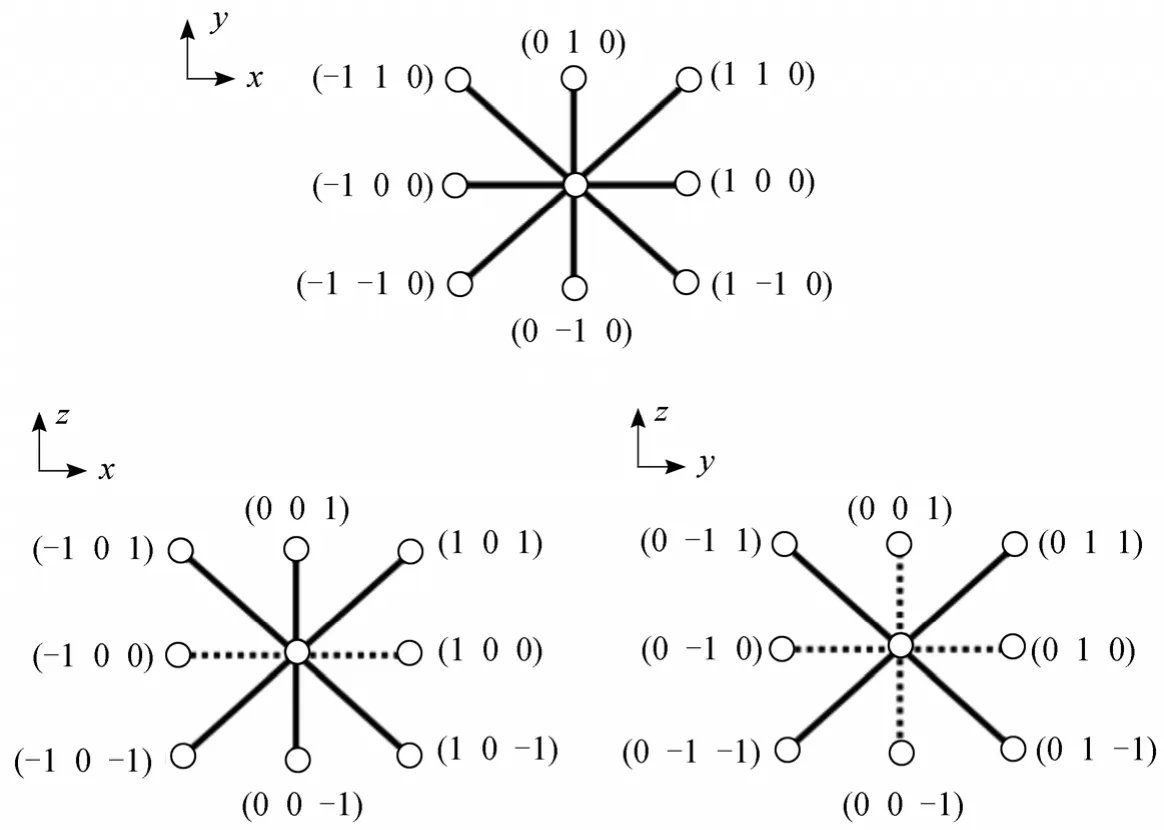
Figure 3 Two-dimensional views of interconnectivity of lattice spring model the nearest and next nearest neighbor springs; duplicated springs
wherelmandlnrepresent the partial lengths of the spring that belong to the respective domains andl=lm+ln[9, 22]. As has been shown, the mechanical properties of polymer blend are directly related to the characteristics of polymer.
3 RESULTS AND DISCUSSION
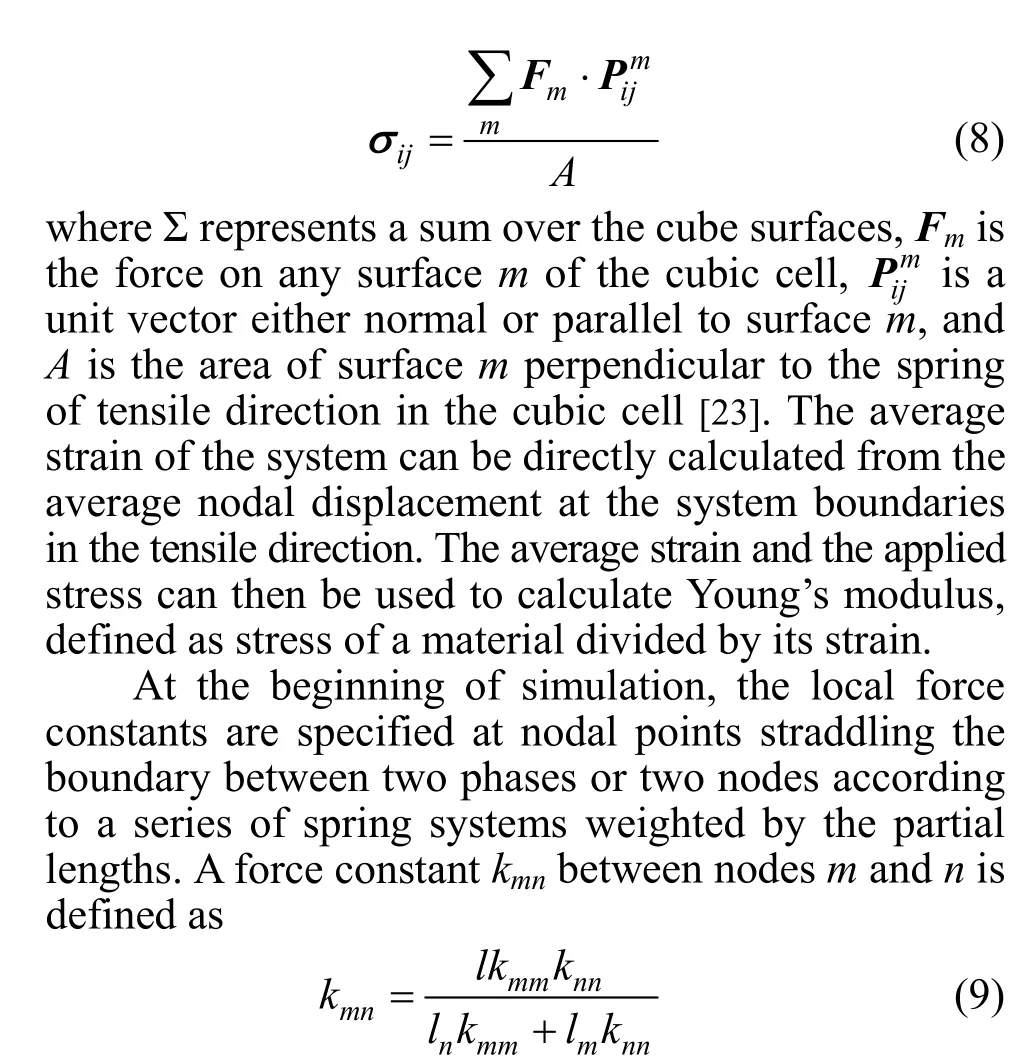
The morphologies of A/B polymer blend films confined between two walls are investigated by MC simulation on a cubic lattice withL×66×66 sites in size. The chain lengths of polymer A and polymer B are set equal to 20 and 10 respectively.fAis defined as the volume fraction of polymer A andfBas that of polymer B in the polymer blend. The repulsive interaction energy between different segments,EA-B, is taken as 0.5kTand the interaction energies between two identical segments,EA-A=EB-B=0 [6, 7]. We assume that there is no interaction between cavity and segments. For convenience,kTis set as the unit of interaction energy, soEA-B=0.5. In the following figures, segment A is expressed as black bead, B as gray bead, and the color of the cavity is white. The morphology obtained from MC simulation serves as the input to the LSM, to determine the mechanical properties of A/B polymer blend in a thin film. The film system is deformed along thex,yorz-direction through the application of a strain at the system boundaries as shown in Fig. 4.
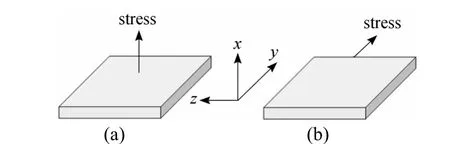
Figure 4 Illustration of the force applied in the direction perpendicular (a) or parallel (b) to the film surface
For convenience, besides assigned specially,Young’s modulus of pure polymer A and pure polymer B are taken as 3.740×10³MPa and 2.85×10³MPa,respectively. Poisson’s ratios of polymer A and B phases are set as 0.404 and 0.390, respectively. This represents different elastic disparity for polymeric systems. The system is equilibrated at a global deformation that corresponds to a strain of 4%.
3.1 Effect of composition of polymer on morphology and mechanical property
Here we focus on the influence of the composition of polymer blend on the morphology and mechanical property. The volume fraction of polymer A,fA, is varied from 0.1 to 0.9. The film thicknessLis fixed at 10.
The result of simulation shows that the morphology of A/B polymer blend film is strongly dependent on the composition of the polymer blend. It is observed that whenfAincreases from 0.1 to 0.5, the cylindrical polymer A phase is surrounded by the continuous skeleton of B phase, and the size of the cylindrical polymer A domain increases with the increase offA. WhenfAincreases to 0.6 or further, polymer B phase is surrounded by a continuous skeleton of A phase, the polymer A phase becomes continuous and the polymer B phase becomes the cylindrical phase with regular size. The results are in good agreement with the experimental results observed by Xieet al[24]. The predicted values are in good agreement with those by experiments. Fig. 5 shows the morphologies of the film withL=10, whenfA=0.3 andfA=0.7.
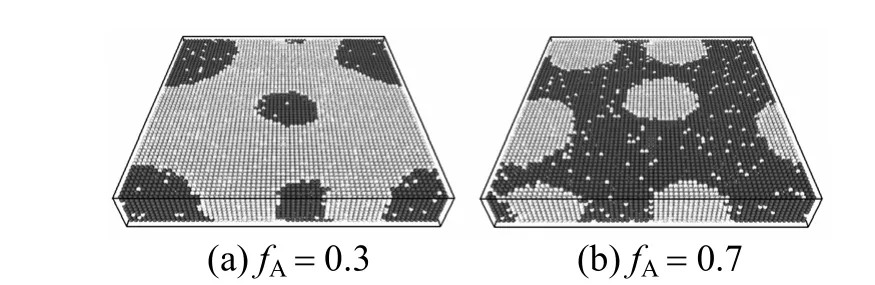
Figure 5 Morphologies of A20/B10 polymer blend film with L=10 and fC=0.9091● polymer A node; polymer B node; cavity
There is no chemical bond between polymer A and polymer B, so it is feasible to prepare a porous polymer A (or polymer B) membrane through expelling polymer B (or polymer A) by a selective solvent.Moreover, by varying the volume fraction of polymer A, the porous membranes with different pore sizes can be obtained.
It is well known that the volume fraction of A/B polymer blend has a great influence on its mechanical property. The effects of volume fraction in the polymer blend film on the reinforcement are investigated from the percentage increase in Young’s modulus.
Figure 6 The percentage increase in Young’s modulus as a function of volume fraction of polymer A(Simulation condition: L=10, fC=0.9091, with stretching direction perpendicular to the surface)
In Fig. 6, we plot the percentage increase in Young’s modulus relative to the polymer B film withL=10. Young’s modulus is the stress of a film divided by its average strain. It varies with the increase of volume fraction of polymer A in the blend, when the force is applied in the direction perpendicular to the surface. The general trend is as expected: increasing the volume fraction of polymer A increases the stiffness of the system. Polymer A is efficient for reinforcing the composite, because it is stiffer than polymer B.
The variation of volume fraction results in different micro-structures, which directly influence the distribution of strain and stress. In order to investigate the relationship between morphology and stress, we deform the film system with a strain at the system boundaries, along thex-direction or they-direction shown in Fig. 4. When the force is applied in thexdirection, the linear elastic system is strained in thexdirection. The springs that possess a component in thexdirection are extended more than the springs normal to thexdirection. For instance, the springs in the (100)direction are more strained than the springs in the (110)direction because the former is directly oriented alongxin Fig. 3. The interfacial boundaries between two phases or two nodes are assigned intermediate spring constants through a simple linear rule of mixture, such as Eq. (9). This disparity in elastic moduli results in complex elastic fields, which result in an interesting mechanical behavior of the thin film of polymer blend related with morphologies. The tensile deformation in thexdirection is applied to the samples with different morphologies shown above. This corresponds to the boundary condition of uniform plan strain, while the system satisfies periodic boundary condition in theyandzdirections parallel to surface.
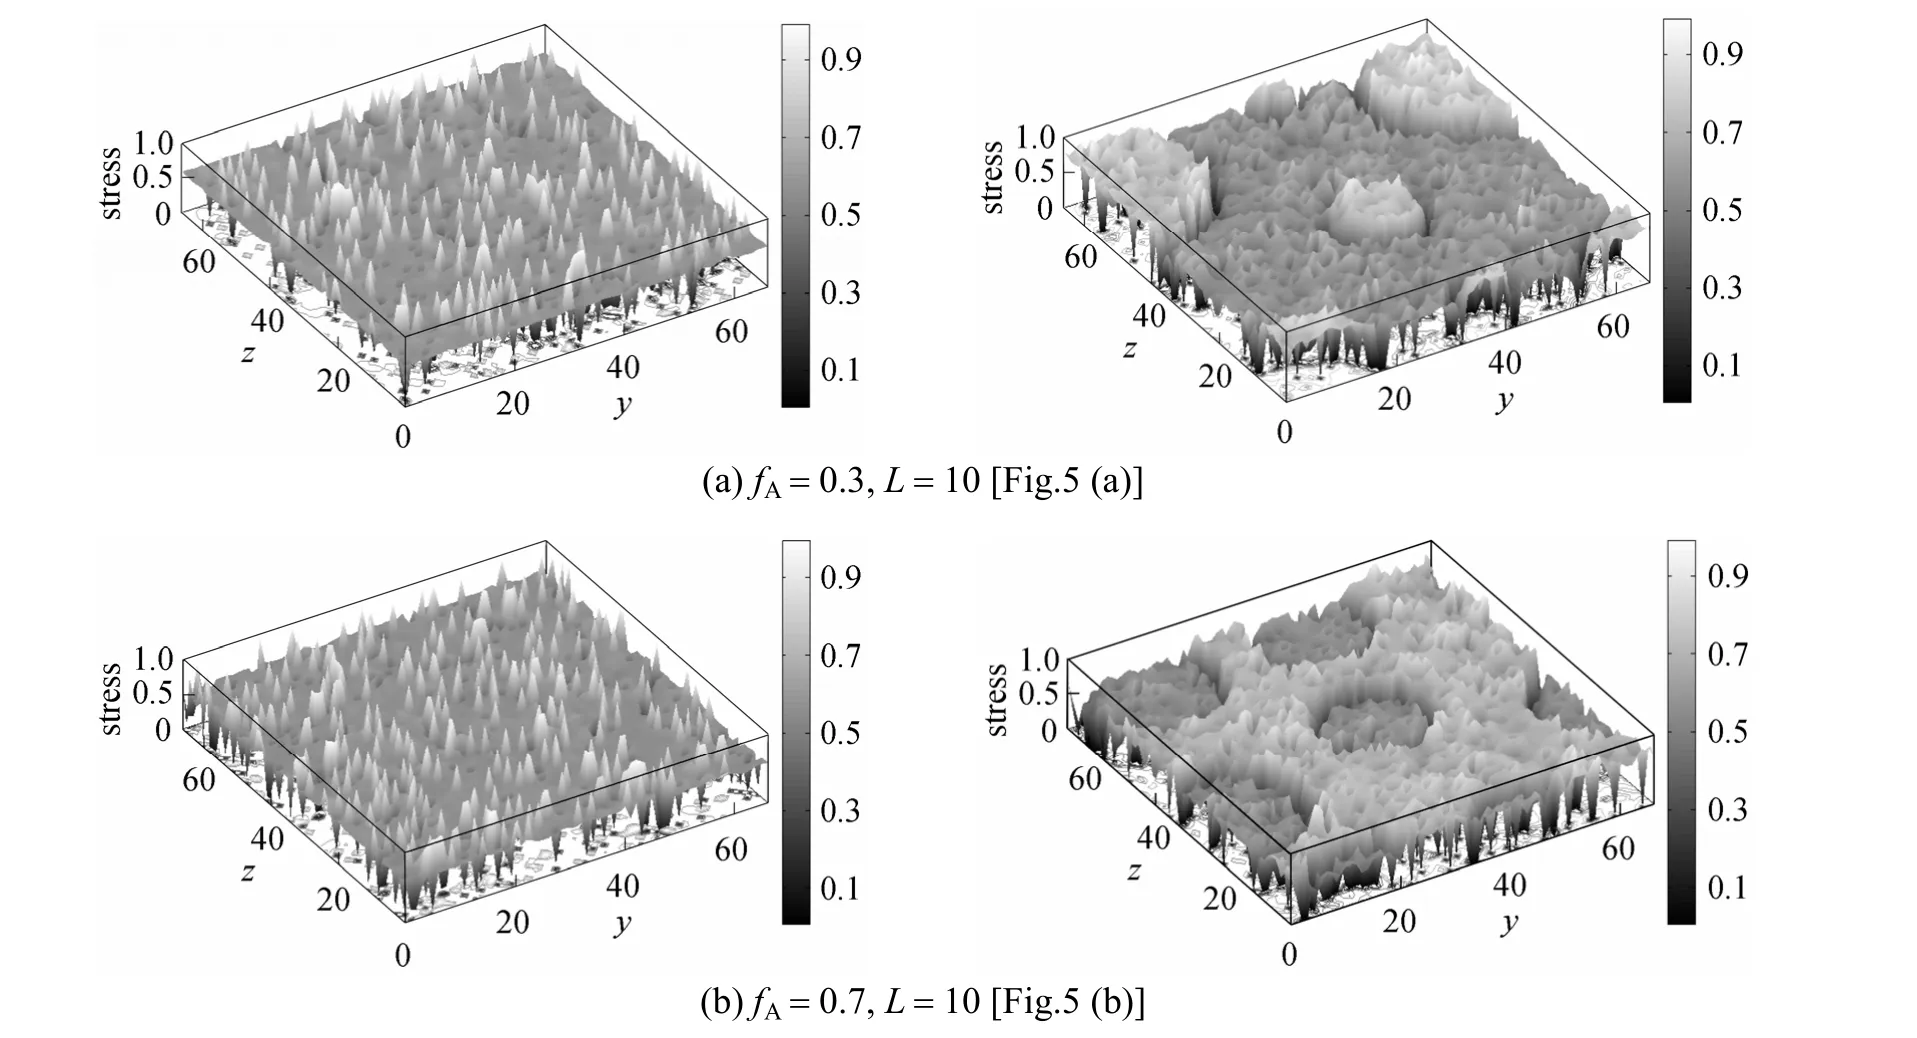
Figure 7 Two-dimensional profiles of normal strain (εxx) and stress (σxx) for different morphologies at x=L/2
Figure 7 depicts the profiles of the normal strainεxxand the stressσxxfor different morphologies in Fig.5. The maximum strain and stress are rescaled to 1,and the lighter regions correspond to higher strains and stresses. The stress field matches the morphology of polymer blend nearly perfect, indicating that the stress fields are directly influenced by the morphology with the elastic constants used in LSM, while the strain fields are nearly random, indicating that they are hardly affected by the morphology, because the strain field around a cavity is relatively larger than that of A and B phases. Thus the influence of elastic disparity between A and B phases on strain field is neglected in our simulation system. If the system has a large elastic disparity between A and B phases or small volume fraction of cavity, the shape of strain field between A and B phases will become more distinct, which will be shown later.
In order to investigate the mechanical behavior in the direction parallel to the film surface, we deform the systems of Fig. 5 with a strain at the system boundaries. When the force is applied in theydirection, the linear elastic system is strained in theydirection.
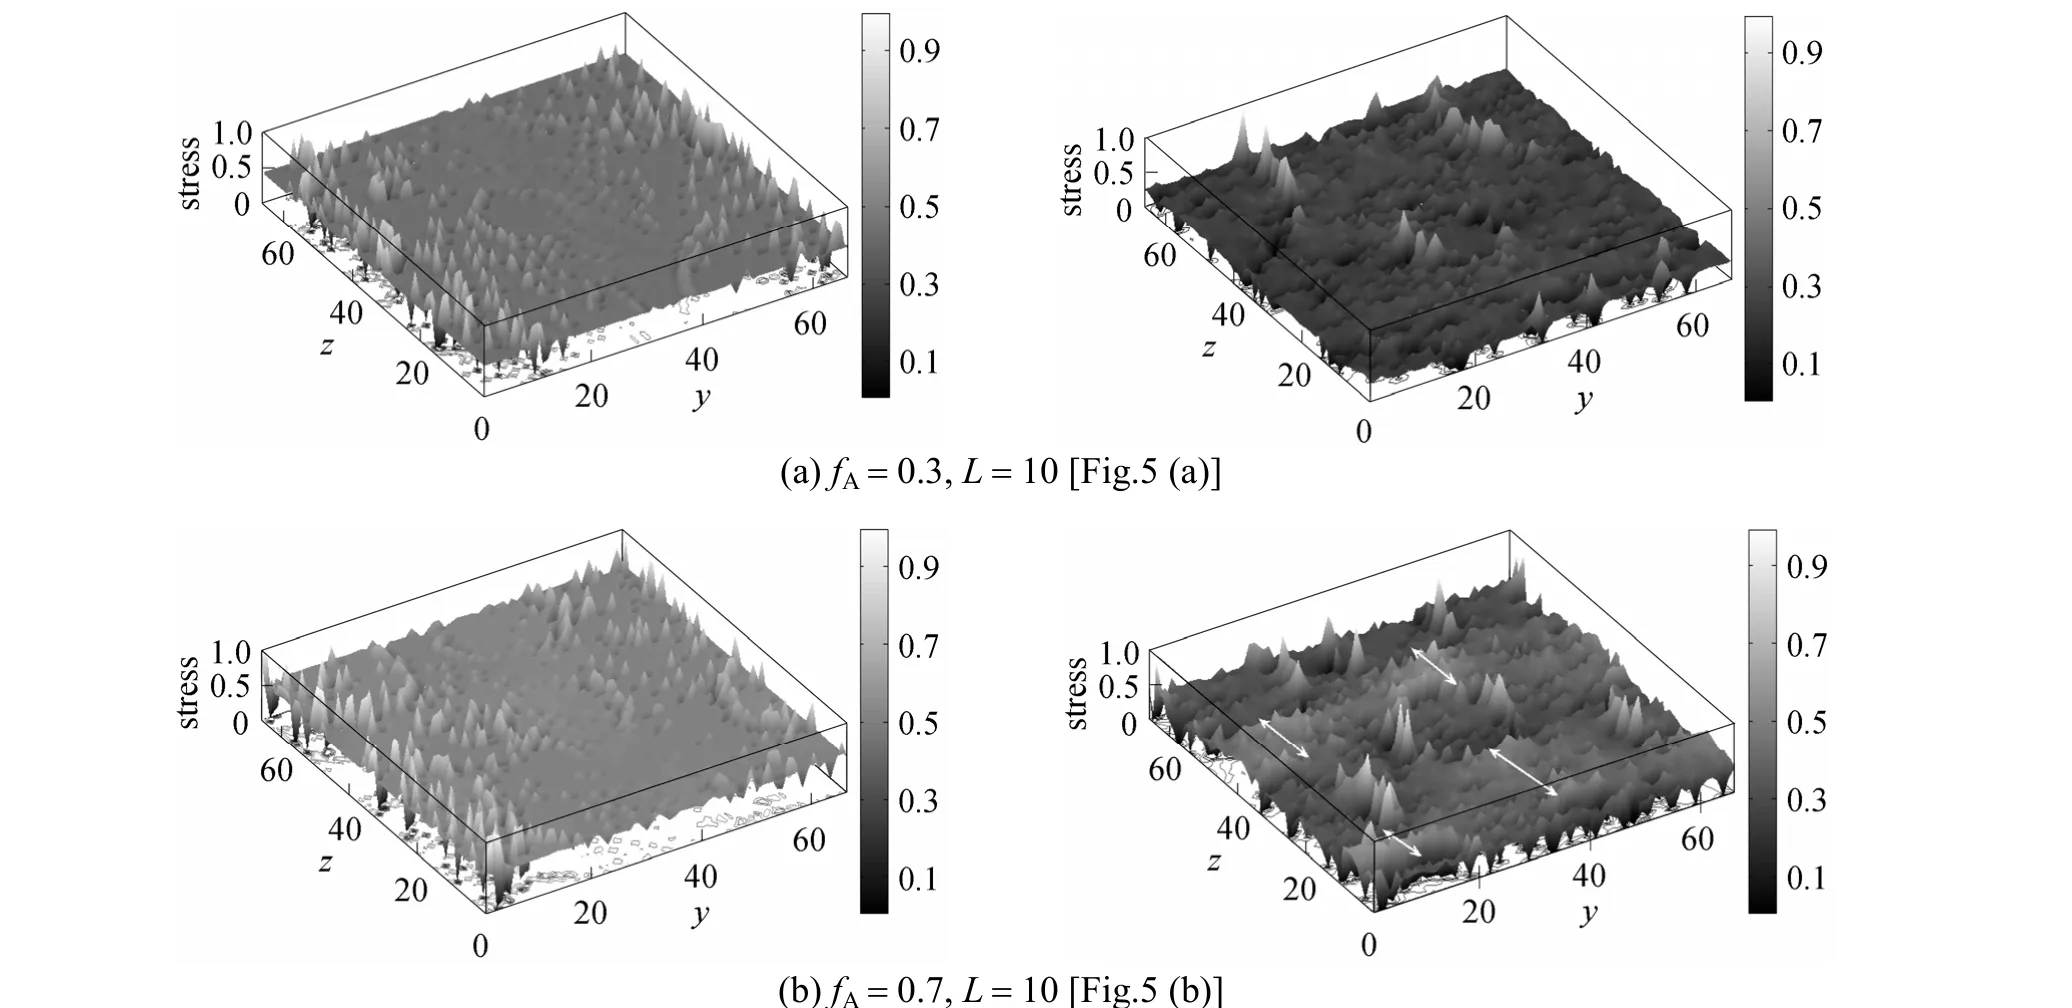
Figure 8 Two-dimensional profiles of normal strain and stress for different morphologies in the direction parallel to the film surface at x=L/2
Figure 8 shows the normal strain field and stress field when the force is applied in theydirection. The maximum strain and stress are also rescaled to 1. This corresponds to the strain periodic boundary condition[22] in theydirection parallel to surface, while the system satisfies the periodic boundary condition in thezdirection and has the free surface. Different from the stress field in Fig. 7 (b), the stress field in Fig. 8 (b) is loosely related to the morphology of polymer blend.The reason is that phase A and phase B are directly forced by the two walls in the case of Fig. 7 (b), while in the case of Fig. 8 (b), the force is applied in theydirection, so the inner phases of the film are affected through the neighboring phases. When polymer B is surrounded by the stiffer polymer A [Fig. 8 (b)], the stress field is in the middle regions between B phases.In the regions [double arrow, as shown in Fig. 8 (b)]with the shortest distance between boundaries of B phases, which is normal to the direction of the applied force, the system has large stress, except for stress around cavities.
As shown in Figs. 7 and 8, the morphologies have little influence on the strain fields, but the direction of the force applied to the film has observable effect.The force applied in thexdirection perpendicular to the film surface leads to a nearly random distributed strain profile, while that in theydirection parallel to the film results in a wave-like periodic distribution.
In order to estimate the effect of composition on the distribution of stress, the sample variance with asymbol is defined as follows:

whereσiis the stress of theith node andnis the total number of nodes.
The sample variance is an important factor to estimate the fracture of heterogeneous materials. The fracture in the system with a large sample variance appears more easily than the system with a small sample variance, when the systems have the same stiffness.

Figure 9 Sample variance vs volume fraction of polymer A■ Lz=10; ○ Lz=15
Figure 9 displays the sample variance with the increase of volume fraction of polymer A. When the force is applied in thexdirection, perpendicular to the film surface as shown in Fig. 9 (a), the sample variance of stress increases with the increase offA, reaches a maximum whenfAis between 0.6 and 0.7, and then decreases. The sample variance of systems usually has a quadratic curve of symmetric type with the increase of volume fraction of polymer A, when the length of polymer A is the same as that of polymer B. Fig. 9 shows a maximum but with a right deflection in an inhomogeneous system with micro-phase separation.The thickness has only a minor effect. When the force is applied in theydirection as shown in Fig. 9 (b), the variation of sample variance is similar to the case of Fig. 9 (a), though the systems have a small deviation from quadratic curve. Fig. 9 (b) shows that the sample variance is sensitive to the variation of volume fraction because of the stretching direction. These results hint us that the fracture may be easily occurred in the region with the maximum of sample variance.
In order to investigate the relationship between strain field and morphology near the maximum, we study the case offA=0.6. Besides the above situation,we further add a new condition that Young’s modulus of the pure polymer A phase is 100 times stiffer than that of the pure polymer B phase. Fig. 10 shows the strain and stress when the force is applied in thexdirection. For the case offA=0.6, compared with the nearly random distribution in Fig. 7, the shape of strain field does change and exhibits a stronger influence by the morphology. In the cases of (a) and (b),Young’s modulus of the pure A polymer phase is 1.31 times stiffer than that of the pure polymer B phase. In the cases of (c) and (d), Young’s modulus of the pure polymer A phase is 100 times stiffer than that of the pure B polymer phase. When the system has a large elastic disparity between polymer A and polymer B, as shown in Fig. 10 (c), the shape of strain field matches the morphology of the film.
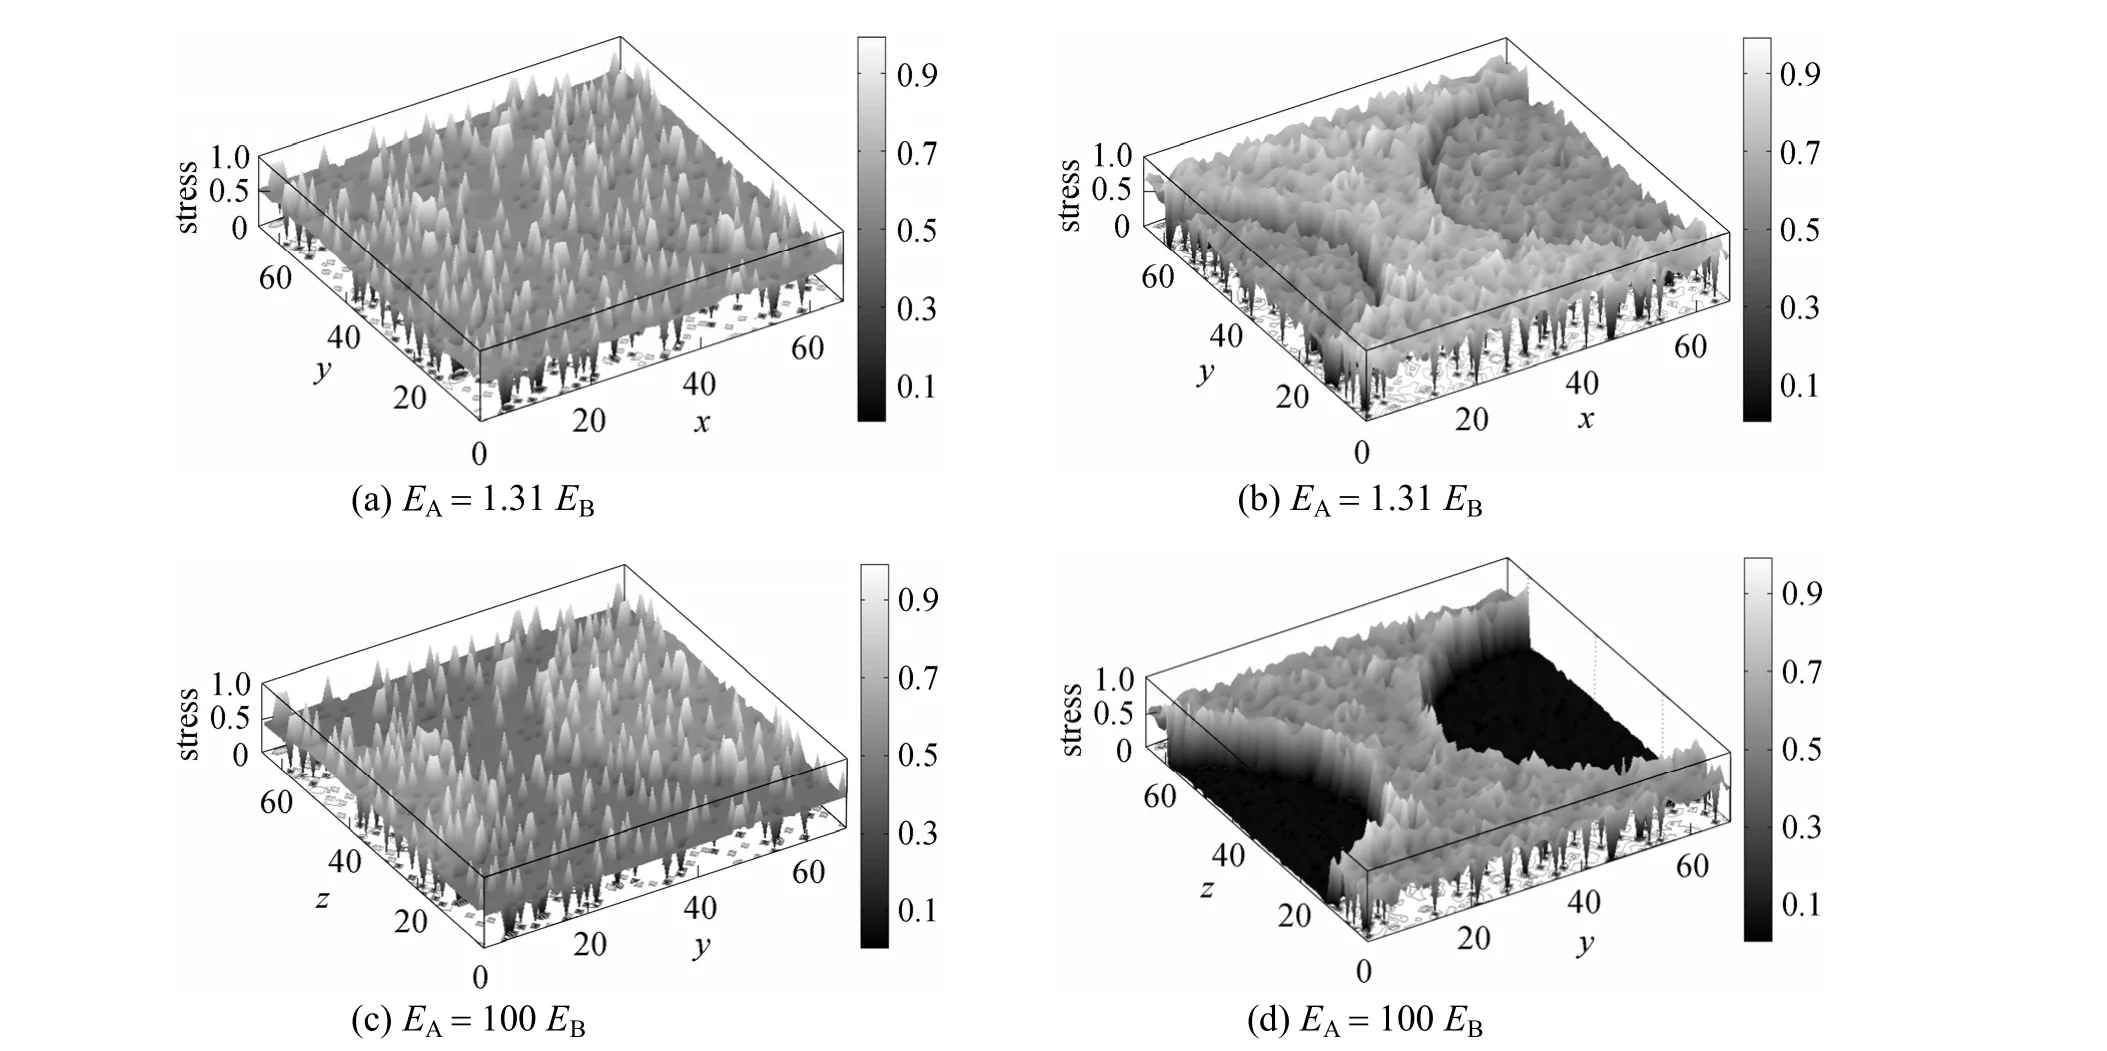
Figure 10 Two-dimensional profiles of normal strain [(a), (c)] and stress [(b), (d)] in the direction parallel to the film surface at x=L/2, fA=0.6, L=10
Above simulation results enable us to predict the mechanical behavior along with the composition of blends and stretching direction of film, though the results are obtained with the elastic approximation.
3.2 Effect of the cavity of polymer film on morphology and mechanical property
In the MC simulation based on bond length fluctuation and cavity diffusion algorithm, a certain number of cavities are included in system. To study the mechanical behavior particularly, it is important to consider the effect of cavity. MC simulation results show that the quantity of cavities affects the simulation time, but has no influence on the equilibrium morphology. In order to evaluate the effect of the cavity content on the mechanical property of the film, we change the volume fraction between cavity and polymer blend. The volume density of the polymerfDis defined asfD=(1-fC), wherefCis the volume fraction of cavities. Young’s modulus estimated is related to the A/B polymer blend film without cavities.
Figure 11 shows the volume-density dependence of the relative Young’s modulus. The relative Young’s modulus increases with the volume density. This is reasonable since in the A/B polymer blend containing the rod that are ten times stiffer than the polymeric matrix (both A and B), the global Young’s modulus has the tendency to increase with the increase of the rod volume fraction [9, 10].
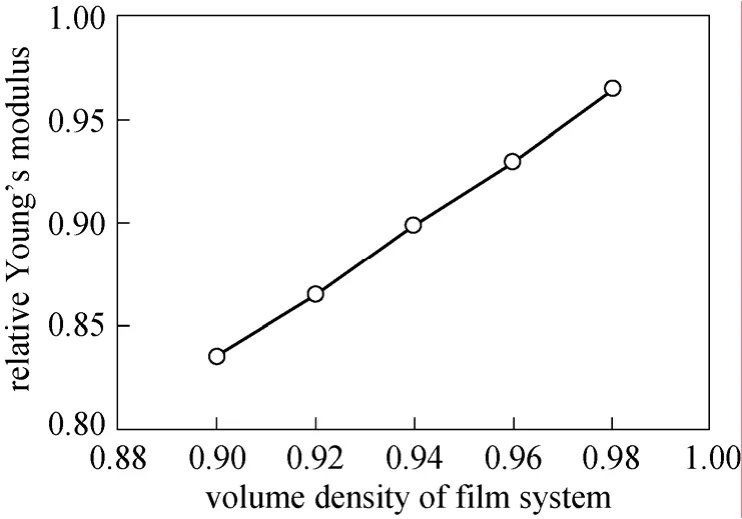
Figure 11 Relative Young’s modulus as a function of volume density of film system(Simulation condition: fA=0.3 , L=10, with stretching direction perpendicular to the surface)
The polymer in the vicinity of a cavity experiences higher stresses and strains. When deformation occurs in an uneasy direction (xory), the forces act on each node throughout the bonds between nodes, due to the presence of cavities, so that the imbalance of displacement in lattice concentrated in the vicinity of cavities results in a notable change in both strain and stress fields. If the cavities are stacked, an area bearing the increasing deformation of the matrix forms,while the remainder of the material undergoes smaller deformations in response to the applied force.
Figure 12 shows the normal strain field and stress field when the force is applied in thexdirection for a blend film with cavities. Fig. 12 (a) shows the sharp peaks of strain in the vicinity of a cavity. The imbalance in displacement of nodes caused by the cavities not only changes the strain field, but also changes the balance of the force between nodes in lattice. Fig. 12(b) shows the change of stress around a cavity. It indicates that the stress is concentrated around the cavity with a shape of tube. The enhanced stress concentrations and strain peaks in the vicinity of cavities are expected to influence the fracture behavior for these systems.
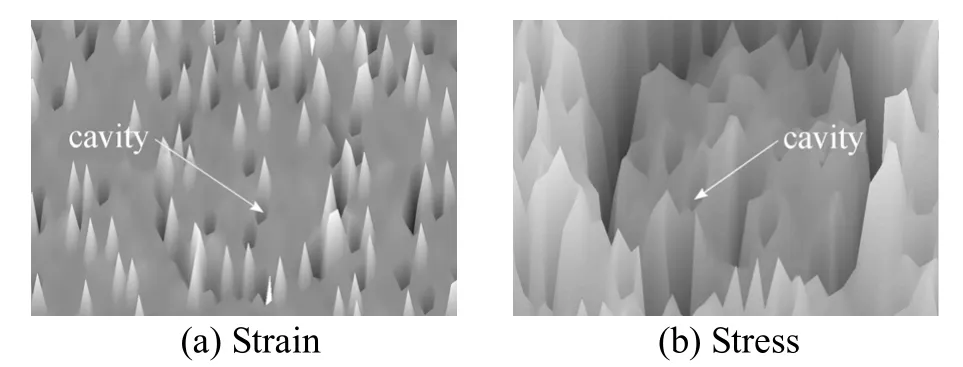
Figure 12 The change of strain (a) and stress (b) around cavity [Fig.7 (b)](Simulation condition: fA=0.7, fC=0.9091, L=10 and x=L/2,with stretching direction perpendicular to the surface)
Figure 13 shows the normal strain field and stress field when the force is applied in the y direction for a blend film with cavities. Different from the shape of a tube, the stress around a cavity shows sharp peaks in Fig. 13 (b). The stress is concentrated at the point of a curve with a tangent parallel to the applied force,while apart from this point, the stress decreases suddenly. The stress along the curve with a tangent perpendicular to the applied force changes slightly. This result accurately explains the theoretical solution [25]for the behavior of cavities in polymer materials. The enhanced stress concentrations around cavities are responsible for the onset of crack propagation and the premature failure of the entire system.
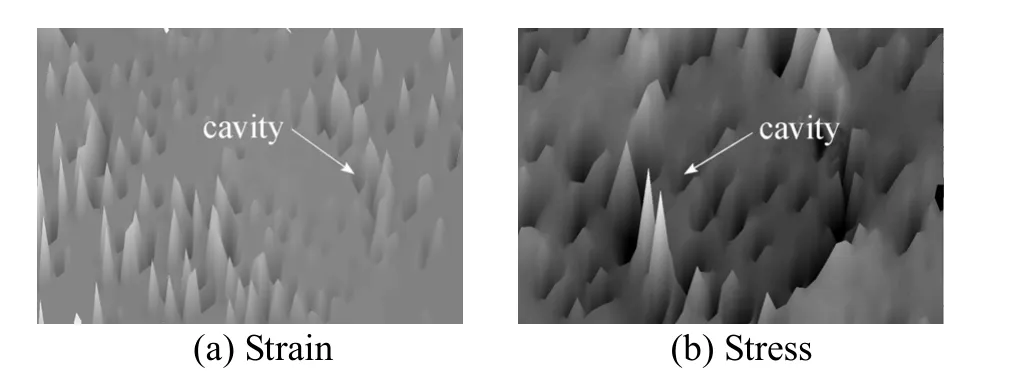
Figure 13 The change of strain (a) and stress (b) around cavity [Fig.8 (b)](Simulation condition: fA=0.7, fC=0.9091, L=10 and x=L/2, with stretching direction parallel to the surface)
4 CONCLUSIONS
Two computational models (MC and LSM) are coupled in a method to investigate the morphologies and the mechanical properties of A/B polymer blend film.
Through the MC simulation, effects of the volume fraction on the self-assembled micro-structure of thin films confined between two walls are determined.When the volume fraction of polymer A is smaller than that of polymer B, orvice versa, morphologies are mainly spheres or cylinders of the relative minor component dispersed in the continuum medium of major component.
By using the LSM, the effect of volume fraction on the mechanical property is investigated. The general trend is that the increase of volume fraction of polymer A increases the stiffness of the systems because polymer A is stiffer than polymer B. When the force is applied in the direction perpendicular to the film surface, the stress-field distribution almost perfectly matches the morphology of the film, while the strain-field distribution is nearly random. When the force is applied in the direction parallel to the film surface, the effect of morphology is blurred but still shows some similarity, whereas the strain field appears a periodic pattern along the direction of force.
The volume fraction of polymer A influences the sample variance of stress, so that the intensity of polymer film can be controlled. The right-side deflection of maximum of sample variance is observed in the micro-phase separation system whenfAis between 0.6 and 0.7.
The influence of the cavity on the strain and the stress fields of the polymer blend film needs paying attention. The increase of the cavity volume fraction decreases the Young’s modulus relative to the A/B polymer film without cavities. The vicinity of cavities experiences higher stresses and strains due to the imbalance of force between nodes, which is responsible for the onset of crack propagation and the premature failure of the entire system.
In summary, the combination of MC and LSM provides an efficient method for investigating the mechanical property of polymer blends.
NOMENCLATURE

1 Brown, P.J., Ying, S., Yang, J., “Morphological structure of polyetherketone membranes for gas separation prepared by phase inversion”, AUTEX Research J., 2, 101-107 (2002).
2 Eidelman, N., Simon, C.G.Jr., “Characterization of combinatorial polymer blend composition gradients by FTIR microspectroscopy”,J. Res. Natl. Inst. Stand. Technol., 109, 219-231 (2004).
3 Bonnie, O.L., Adam, P.H., John, L.B., Andreas, S., Andrew, D.,“Phase segregation in polystyrene-polylactide blends”, Macromolecules, 42 (5), 1679-1684 (2009).
4 Wang, B.Q., Cai, J., Liu, H.L., Hu, Y., “Monte Carlo simulations of density profiles for hard-sphere chain fluids confined between surfaces”, Chin. J. Chem. Eng., 9 (2), 156-161 (2001).
5 Peng, C.J., Li, J.K., Liu, H.L., Hu, Y., “Monte Carlo simulations for the adsorption of symmetric triblock copolymers”, Chin. J. Chem.Eng., 12 (3), 357-362 (2004).
6 Yu, B., Sun, P., Chen, T., Jin, Q., Ding, D., Li, B., Shi, A.C., “Confinement-induced novel morphologies of block copolymers”, Phys.Rev. Lett., 96, 138306 (2006).
7 Yu, B., Jin, Q., Ding, D., Li, B., Shi, A., “Confinement-induced morphologies of cylinder-forming asymmetric diblock copolymers”,Macromolecules, 41, 4042-4054 (2008).
8 Buxton, G.A., Balazs, A.C., “Modeling the dynamic fracture of polymer blends processed under shear”, Phys. Rev. B, 69, 054101(2004).
9 Buxton, G.A., Balazs, A.C., “Predicting the mechanical and electrical properties of nanocomposites formed from polymer blends and nanorods”, Mol. Simul., 30, 249-257 (2004).
10 Shou, Z., Buxton, G.A., Balazs, A.C., “Predicting the self-assembled morphology and mechanical properties of mixtures of diblocks and rod-like nanoparticles”, Composite Interfaces, 10, 343-368 (2003).
11 Travasso, R.D.M., Buxton, G.A., Kuksenok, O., Good, K., Balazs,A.C., “Modeling the morphology and mechanical properties of sheared ternary mixtures”, J. Chem. Phys., 122, 194906 (2005).
12 Buxton, G.A., Balazs, A.C., “Micromechanical simulation of the deformation and fracture of polymer blends”, Macromolecules, 38,488-500 (2005).
13 Huang, Y.M., Liu, H.L., Hu, Y., “Morphologies of diblock copolymer/homopolymer blend films”, Macrom. Theory Simul., 15,321-330 (2006).
14 Carmesin, I., Kremer, K., “The bond fluctuation method: A new effective algorithm for the dynamics of polymers in all spatial dimensions”, Macromolecules, 21 (9), 2819-2823 (1988).
15 Larson, R.G., Scriven, L.E., Davis, H.T., “Monte Carlo simulation of model amphiphile-oil-water systems”, J. Chem. Phys., 83 (5),2411-2420 (1985).
16 Larson, R.G., “Self-assembly of surfactant liquid crystalline phases by Monte Carlo simulation”, J. Chem. Phys., 91 (4), 2479-2488(1989).
17 Ashurst, W.T., Hoover, W.G., “Microscopic fracture studies in the two-dimensional triangular lattice”, Phys. Rev. B, 14, 1465-1473(1976).
18 Eshelby, J.D., “Elastic inclusions and inhomogeneities”, Prog. Solid Mech., 2, 89-140 (1961).
19 Buxton, G.A., Cleaver, D.J., Care, C.M., “A lattice spring model of heterogeneous materials with plasticity”, Modell. Simul. Mater. Sci.Eng., 9 (6), 485-497 (2001).
20 Yan, H., Li, G., Sander, L.M., “Fracture growth in 2d elastic networks with born model”, Europhys. Lett., 10, 7-13 (1989).
21 Caldarelli, G., Castellano, C., Petri, A., “Criticality in models for fracture in disordered media”, Physica, A, 270, 15-20 (1999).
22 Ostoja-Starzewski, M., Sheng, P.Y., Jasuik, I., “Damage patterns and constitutive response of random matrix-inclusions composites”, Eng.Fracture Mech., 58, 581-606 (1997).
23 Monette, L., Anderson, M.P., “Elastic and fracture properties of the two-dimensional triangular and square lattices”, Modelling Simul.Mater. Sci. Eng., 2, 53-66 (1994).
24 Xie, Z.M., Sheng, J., Wan, Z.M., “Mechanical properties and morphology of polypropylene/polystyrene blends”, J. Macromol. Sci.Phys. B, 40 (2), 251-261(2001).
25 Sitzer, M.R., Stavsky, Y., “Stress concentrations around holes in anisotropic laminated plates”, J. Appl. Math. Phys., 33 (5), 684-692(1982).
猜你喜欢
杂志排行

Chinese Journal of Chemical Engineering的其它文章
- Adsorptive Recovery of Uranium from Nuclear Fuel Industrial Wastewater by Titanium Loaded Collagen Fiber*
- Salting-out Extraction of 2,3-Butanediol from Jerusalem artichoke-based Fermentation Broth*
- Investigation of Mg2+/Li+ Separation by Nanofiltration*
- Vapor-Liquid Equilibrium of Ethylene + Mesitylene System and Process Simulation for Ethylene Recovery*
- Purification and Characterization of a Nonylphenol (NP)-degrading Enzyme from Bacillus cereus. Frankland*
- Sponge Effect on Coal Mine Methane Separation Based on Clathrate Hydrate Method*