最大熵法分析寡聚核苷酸链内碰撞的荧光相关光谱
2010-12-11尹延东周晓雪赵新生
尹延东 周晓雪 赵新生
(北京大学化学与分子工程学院化学生物学系,分子动态与稳态结构国家重点实验室,北京分子科学国家实验室,北京 100871)
最大熵法分析寡聚核苷酸链内碰撞的荧光相关光谱
尹延东 周晓雪 赵新生*
(北京大学化学与分子工程学院化学生物学系,分子动态与稳态结构国家重点实验室,北京分子科学国家实验室,北京 100871)
准确地由荧光相关光谱(FCS)的实验数据提取动力学信息一直是一个挑战.本文对比了三种主要的方法:依赖于模型的多指数函数法,经验的拓展指数函数法和不依赖于模型的最大熵法.多指数函数法的物理意义直接但在复杂体系中难以应用和解释.拓展指数函数法简单易行但其物理意义含混不清.最大熵法不依赖于具体的物理模型但拟合结果对实验噪音很敏感.经研究我们发现一个好的选择是将最大熵法和多指数函数法结合在一起使用.对寡聚核苷酸链内碰撞荧光相关光谱的研究发现,在单链DNA中可以形成碱基对时,有两个并行的链内碰撞反应.以前的拓展指数函数法分析则不能提供这样的信息.我们建议在荧光相关光谱研究中审慎地使用最大熵法.
荧光相关光谱;弛豫时间分布;拓展指数函数;最大熵法;寡聚核苷酸;光致电子转移
Fluorescence correlation spectroscopy(FCS)has become an established tool in the study of diffusion,photophysics and photochemistry,and conformational dynamics of bio-molecules in a time range from sub-microsecond to millisecond[1].The accurate mathematical formula for an FCS curve is well-known[1].In practice,however,it is often found that for a complicated system the fitting of the experimental data by the accurate formula is questionable due to the lack of necessary information to uniquely confine and define the fitting parameters.To surmount such difficulties,the stretched exponential function is usually employed to fit the non-exponential decay data of unknown systems[2-5].Although often numerically successful,the parameters drawn from the fit can only indicate the extent of heterogeneity and complexity,while the physical significance is often vague and sometimes misleading.
Maximum entropy method(MEM)is a general strategy for data analysis when information is extremely limited.By preserving the maximum uncertainty in the estimation of parameters consistent with the data,MEM provides a model-free fitting to resolve corresponding distributions.It was first introduced and developed for the reconstruction of astronomical images[6]and has been applied later on many dynamical problems,including the lifetimedistributioninfluorescencemeasurements[7]andthemolecular size distribution in FCS experiment on diffusion[8].Enlightened by previous work[6-8],we now test the reliability of MEM applied to the analysis of FCS data when chemical reactions are involved.We will show that due to inevitable fluctuation in the experimental data,MEM also can not unequivocally recover the relaxation time distribution of the chemical reactions.Nevertheless,assisted by MEM more dynamic information can be extracted from the experimental FCS curves than the stretched exponential method does.
Intra-chain collision is a fundamental motion of biomolecules. All biochemical reactions based on the conformational change of the biomolecules involve intra-chain collision.Oligonucleotide is a good model for the investigation of the dynamics of intra-chain collision,and there are a large number of studies about the mechanism of hairpin DNA folding and DNA hybridization using FCS technique[3,5,9-10].It is believed that the hairpin folding includes loop formation as an initial step and successive propagation of base-pairing for the stem.The work by Sauer′s group focused on the loop formation process through applying quenching of MR121(an oxazine fluorophore)by guanosine[4]through photoinduced electron transfer(PET).It is found that the single-stranded DNA(ssDNA)without complementary nucleotides exhibits mono-exponential decay and non-exponential decay appears upon the incorporation of as little as one complementary base pair.Analysis with the stretched exponential function shows a small β value for ssDNA carrying one base pair and an even smaller one when two base pairs exist,where β is associated with the heterogeneity of the system.However,the origin of the small β value and the mechanism remain unclear.To clarify the question left over from their paper,we carried out FCS study of a similar system based on quenching of tetramethyrhodamine (TMR)by guanosine[11-12]through PET.Assisted by MEM,we find that the relaxation time distribution has two peaks.The fast peak is assigned to the collision without base pair formation, while the slow one is believed to be associated with base pairing.
1 Theoretical background
For a molecule diffusing freely in a solution and having n independent chemical reactions,the FCS curve probed by a focused Gaussian laser beam has the form[1]:

In Eq.(1),GD(t)is the contribution from diffusion,GR(t)is the contribution from the chemical reactions.
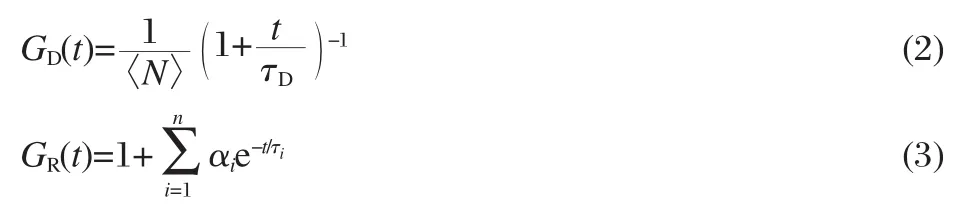
where〈N〉is the average number of the molecule in the laser focal volume,τDis the characteristic diffusion time across the focal point,τiis the eigen value on the relaxation time of the ith eigen vector of the coupled master equations of reactions,and αiis the weighting factor for the ith eigen vector.
When there is heterogeneity in the system,the eigen values will spread out from the discrete ones,and Eq.(3)should be modified to

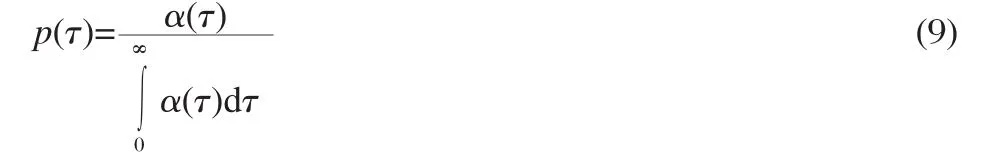
where α(τ)is the distribution function of the eigen values,which in principle can be found from the fit of the experimental data by minimizing χ2,an estimation on the goodness of the fit, defined by

where M is the number of FCS data points and rjis the deviation of the jth data point from the fitting.However,it is often the case that the same criterion of χ2is satisfied by more than one α(τ),especially when the data have larger noise.Therefore,the uniqueness of α(τ)is not guaranteed and the physical meaning of so reconstructed α(τ)is equivocal[13].
One way to surmount the difficulty is to introduce the stretched exponential function[13]:

where β is associated with the heterogeneity of the system e.g., the static disorder,and τ0is the eigen value on the relaxation time.Then,the mean relaxation time can be calculated through

where Γ(β-1)is the gamma function.It is found that this simple function can often fit FCS curves satisfactorily and is widely applied in FCS data analysis.However,its physical picture is rather vague,and the same problem exists if one try to recover α(τ)from Eq.(6).
Here,we determine α(τ)in Eq.(4)by implementing MEM.According to the maximum entropy principle,the most probable distribution is the one with the maximum information entropy (S),which describes the uncertainty of the system and is defined as

where
We apply the widely used MEM algorithm proposed by Skilling and Bryan[6]to search for the α(τ)that has the maximum S and minimum χ2.
2 Materials and methods
2.1 Computer simulation
We carried out comparative studies on the three major fitting methods using computer simulation.Certain distribution functions,α(τ),were pre-assumed to generate FCS curves according to Eq.(1)by incorporating“experimental”noise.Then,we fit the simulated FCS curves by multiple exponential decay function (MultiExp),stretched exponential function(StreExp),and MEM-based distribution function(MemExp)separately to see how well these methods could fit the simulated curves and whether Mem-Exp could recover the pre-assumed distributions.The parameters used in our simulation were chosen based on actual experimental conditions.For instance,the characteristic diffusion time, τD,was set to 200 μs and the pre-assumed α(τ)was distributed from 0.01 to 100 μs.The noise was added at each t by generating a random number from a Gaussian distribution with its standard deviation proportional to the modified Koppel error value[14]. The MemExp fitting was facilitated by adopting a web-available program,MemExp[15-16].
2.2 FCS measurement
Synthetic 9-base oligonucleotide sequences labeled with a 5′-TMR were purchased from Sangon Company,China.The sequences and their abbreviations used in this paper are listed in Table 1.
As described previously[12],FCS measurements were conducted on a home-built dual-channel inverse fluorescence microscope equipped with a CW Ya-Ge laser(532 nm)(SUW Tech. China)as excitation source.The laser beam was collimated and focused into the sample solution through an oil-immersion objective(100×,NA 1.4,Nikon,Japan)by a dichroic beam splitter(Z532/633,Chroma Technology,USA).The laser power was kept low at 30 μW before entering the aperture of the objective to minimize the triplet state formation of TMR.The emitted fluorescence was collected by the same objective,passed through appropriate filters(595-50,Chroma Technology,USA),and focused through a 30-μm-diameter pinhole.The fluorescence photonsweredividedintotwo channels by a non-polarizing 50/50 splitter(XF121,Omegafilters,USA),then focused onto two avalanche photodiodes(APDs,SPCM-AQR-14,Perkin-Elmer,USA). The signals of the two APDs were recorded in cross correlation mode using a computer implemented correlator(Flex02-12D, www.correlator.com,China).About 40 μL sample solution was sealed between a chamber cover(GraceBio,Sigma,USA)and a cover glass,which had been carefully cleaned in a piraha solution(V(30%H2O2)∶V(H2SO4)=7∶3)for more than 30 min at above 90℃.The concentration of oligonucleotides labeled by TMR was 10 nmol·L-1for the FCS measurements.

Table 1 Abbreviations of oligoncleotides
All measurements were performed at room temperature(25℃) in aqueous solution of 100 mmol·L-1NaCl,0.01%Tween 20 (Sigma,Germany)and 1×TE,which was diluted from 20×TE (Molecular Probes,USA),pH 7.5,containing 0.2 mol·L-1Tris-HCl,0.02 mol·L-1ethylene diamine tetraacetic acid(EDTA). Water(18.2 MΩ·cm)used in all experiments was treated through PALL.The procedure of fitting the experimental data was the same as that described in Sec.2.1.
3 Results and discussion
3.1 Comparisononfittingmethodsthroughsimulation
First,we generated simulated FCS curves by mono-exponential decay function of different relaxation time for chemical reactions at different noise levels defined by
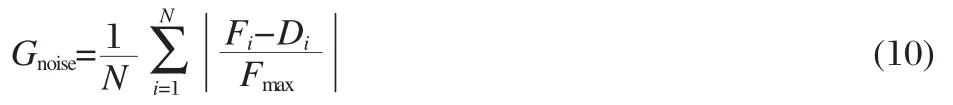
where Fiis the FCS curve without noise and Diis that at a certain noise level.We fitted the curves with MultiExp,StreExp, and MemExp,respectively.At each noise level,50 random noise added FCS curves were produced and fitted.A set of the fitting results are shown in Fig.1.To clearly show the major feature of chemical reaction,here and later the contribution by the diffusion(Eq.(2))is removed from the FCS curves.When there was no any noise,all the three methods recovered the preset relaxation time well.β in StreExp was close to 1 and the width in MemExp was very narrow.As the noise level increased,the fitting parameters would fluctuate around the true values,the higher the noise level the wider the fluctuation.In some cases,the β value in StreExp could be obviously smaller than 1,and the width in MemExp could be quite broad.The mean value of the peak of the relaxation time distribution and its standard deviation(shown as the error bar)and the mean value of the width and itsstandarddeviation(shownastheerrorbar)inMemExparepresented in Fig.2.We conclude that the peak can be quite faithfully recovered by MemExp even at high noise level,while the interpretation on the width should be cautious.
In the next,we produced simulated FCS curves by continuous relaxation time distributions.The pre-assumed distributions are taken to be multiple Gaussian function in logarithm of time,

For each distribution,we generated 20 simulated FCS curves with random noise added at the level comparable to our experimental situation and fitted them with MultiExp,StreExp,and MemExp,respectively.We found that all the three methods could fit the curves equally well,with an example illustrated in Fig.3.The left column of Fig.3 shows the pre-assumed distribution,the recovered distribution by MemExp when there was no noise,a couple of typical good and bad recovered distributions by MemExp when noise was added.We found that MultiExp would offer quite accurate position for the peak,and StreExp could qualitatively indicate the complexity of the system through the β value.However,MultiExp could not provide the information on the width of the distribution and StreExp could not help to tell and to differentiate possible components.Mem-Exp,on the other hand,could identify the components without pre-assumed models.When there was one or two Gaussian components,MemExp could predict both peak and width reasonably well for most random noise curves,but for the cases with three components,the width of the recovered distributions would often obviously deviate from the input.Also it is worth mentioning that both MutiExp and MemExp could provide weighting factors quite well for different components,but Stre-Exp did not have such information directly available.
To summarize the results on our simulation,it is concluded that with the existence of experimental noise,some of the fitting parameters could deviate severely from the true values in all the three methods,and one should be cautious when interpreting the physical significance of β in StreExp and the width in MemExp. Indeed,a faithful recovery of all aspects of a relaxation time distribution from a FCS curve still imposes great challenge. Nevertheless,it seems to us that MemExp stands out as the best.

Fig.1 Simulated mono-exponential decay FCS curves and their fita)A set of the FCS curves generated at noise level comparable to our experimental situation and the fitting by MemExp.The quality of fit by MultiExp and StreExp was the same as that by MemExp.b)The relaxation time distribution recovered by MemExp from the fit in a).
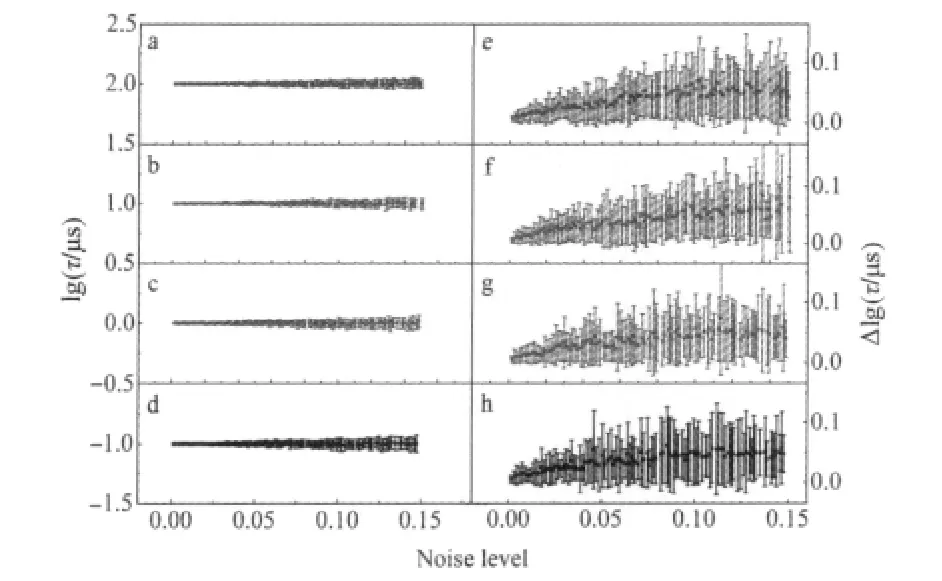
Fig.2 Statistics on the parameters for the MemExp fitting on mono-exponential decay FCS curves at different noise levelsa-d)The mean value of the peak of the relaxation time distribution and its standard deviation when relaxation time was 100,10,1,0.1 μs,respectively. e-h)The mean value of the width of the relaxation time distribution and its standard deviation when relaxation time was 100,10,1,0.1 μs,respectively.
3.2 Fitting of experimental FCS in ssDNAs
The experimentally obtained FCS curves of the four ssDNAs listed in Table 1 are shown in Fig.4.The time scale of the reaction was well separated from that of translational diffusion, which allowed us to remove the diffusion component thoroughly through the fitting.All data in Fig.4 display fast decay occurring on microsecond time scale.With a low excitation power(30 μW)in our experiment,the influence of triplet state formation and other possible photophysical process of TMR were fairly avoided,and the decay came mainly from the quenching of TMR by guanosine at the other end of ssDNA due to the intrachain collision[12].It is clearly seen that with the increase of the matched base pair,the decay slows down and the amplitude en-hances at the same time.

Fig.3 MemExp fit of continuously distributed α(τ)a-c)pre-assumed and recovered distributions.Solid curves are pre-assumed distributions,triangles are recovery by MemExp with no noise,circles are a typical good recovery when noise is added,and squares are one of the worst recoveries at the same noise level.Straight lines with the error bars are the results by MultiExp.d-f)the FCS curves corresponding to the left with a typical fit.All the fittings had the comparable quality.The input parameters were τ1=2 μs,σ1= 0.2,A1=0.1 for the mono-peak distribution,τ1=0.3 μs,τ2=2 μs,σ1=σ2=0.2,A1=A2= 0.1 for the double-peak distribution,and τ1=2 μs,τ2=10 μs,τ3=50 μs,σ1=0.2, σ2=0.3,σ3=0.2,A1=A3=0.1,A2=0.15 for the three-peak distribution.
As the same as in simulation,all the three methods,MutiExp, StreExp,and MemExp,offered fitting with comparable quality. The fit by MemExp is shown in Fig.4.The fitting parameters from StreExp are listed in Table 2,and those from MultiExp are listed in Table 3.The relaxation time distributions extracted from MemExp are shown in Fig.5.
The StreExp fit showed the same trend as that in the literature[4]:the mean relaxation time increases from 0CG to 1CG-1 and 1CG-2,and to 2CG,because the base pairing slows down the intra-chain collision.However,our β values are quite different from the one with a similar ssDNA structure in Ref.[4],partly because our FCS curves consist of the contribution from the singlet-triplet transition of TMR and partly because the β value is strongly dependent on the experimental random noise based on experience of simulation in Sec.3.1.
The MemExp fit predicts that all FCS curves contain two major kinetic components(Fig.5).The dominant peak at 0.37 μs in the relaxation time distribution of 0CG came from the G-quenching of TMR by intra-chain collision,and the minor one at 2.4 μs is assigned to the relaxation of the singlet-triplet transition of TMR,because it still existed when there was no dG to quench TMR,and when laser power was increased this contribution would increase as expected for a singlet-triplet transition (data not shown).The fast peak in other three oligonucleotides should also come from the G-quenching of TMR as in 0CG.It is interesting to observe the progressive increase of the weighting factor for the slow component as the number of CG pair increased.Because the contribution from the singlet-triplet transition of TMR should remain constant at a constant laser power, the different weighting factors among different oligonucleotides indicate a reaction path in which the base pairing plays an important role.
Guided by the results from the MemExp fit,we applied doubleexponential fit to the experimental FCS data and the fittings were equally good.As illustrated in Fig.5,the MultiExp fit provided consistent results with MemExp in terms of the peakposition and relative amplitude.

Table 2 Fitting parameters from StreExp

Table 3 Fitting parameters from MultiExp
3.3 A physical picture on the intra-chain collision
The oligonuleotides in our experiment are similar to the ones used by Sauer and co-workers[4].In their work,the data are fitted by the StreExp method.Although they have made extensive discussion regarding the reaction kinetics,the physical picture embedded in different β values remains unclear.Our treatment of the data by MemExp as well as by MultiExp exhibited clear evidence for two independent processes which have not been observed by Sauer and co-workers.Conceivably,when the two ends of the ssDNA chain collide with each other,there are two path ways if it is possible to form base pairs as is in the case of 1CG-1,1CG-2,and 2CG(Fig.6).The first path way is the collision and quenching between TMR and dG bases without the chance of forming C-G base pair,and the second one is the collision and quenching when C-G base pair is formed.Obviously, the first reaction has a smaller relaxation time which gives rise to the fast peak,while the second one is much slower which makes up contribution to the second peak.In the latter,the formation of the base pair is the rate-determining step.


Comparing the distribution functions among 0CG,1CG-1, 1CG-2,and 2CG,it is found that although the amplitude of the slow component increases substantially in 2CG due to the increased stability of the hairpin structure,the peak shift towards the longer timescale is not profound.Our data indicate that one base pair will generate a much slower collision path than that without base pair formation,but the effect of a second base pair to the reaction rate is not significant.Although the same conclusion is also reached by Sauer and co-workers through comparing their average relaxation time[4],the criterion of average relaxation time is not reliable.The average of all the components together instead of a specific one alone is not an accurate indicator for the individual component.In current case,due to the existence of the singlet-triplet transition,the average relaxation time (Tables 2 and 3)would tell us different story from that by looking into respective relaxation time of individual component(Fig. 5).The change of the average relaxation time here mainly reflects the change of the weighting factors of the two components.In this example,the advantage of MemExp over StreExp is clearly demonstrated.
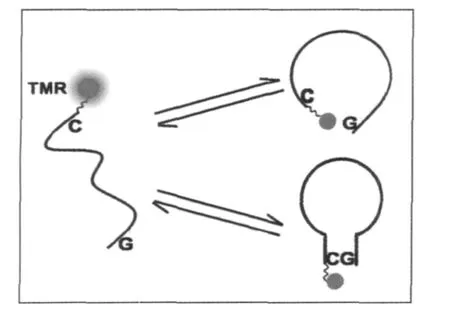
Fig.6 Schematic view of dynamic processes of intra-chain collision when base-pairing is possible
4 Conclusions
In this paper we compared three major fitting methods,MultiExp,StreExp,and MemExp,applied to the FCS data analysis. A good choice seems to be fitting the experimental data by MemExp first and then checking the results by MultiExp with appropriate number of exponential components based on Mem-Exp.In our example we have unraveled that two independent processes exist in the intra-chain collision of an ssDNA when base pair formation is possible.With the development of efficient MEM algorism,the MEM approach is now applied in many fields.We recommend the MEM method be implemented in FCS data analysis,although caution should be exercised in the practice.
1 Krichevsky,O.;Bonnet,G.Rep.Prog.Phys.,2002,65:251
2 Ying,L.M.;Wallace,M.I.;Klenerman,D.Chem.Phys.Lett., 2001,334:145
3 Wallace,M.I.;Ying,L.M.;Balasubramanian,S.;Klenerman,D. Proc.Natl.Acad.Sci.U.S.A.,2001,98:5584
4 Kim,J.;Doose,S.;Neuweiler,H.;Sauer,M.Nucleic Acids Res., 2006,34:2516
5 Chen,X.D.;Zhou,Y.;Qu,P.;Zhao,X.S.J.Am.Chem.Soc., 2008,130:16947
6 Skilling,J.;Bryan,R.K.Mon.Not.R.Astr.Soc.,1984,211:111
7 Swaminathan,R.;Krishnamoorthy,G.;Periasamy,N.Biophys.J., 1994,67:2013
8 Sengupta,P.;Krishnamoorthy,G.;Balaji,J.;Periasamy,N.;Maiti, S.Biophys.J.,2003,84:1977
9 Bonnet,G.;Krichevsky,O.;Libchaber,A.Proc.Natl.Acad.Sci. U.S.A.,1998,95:8602
10 Jung,J.;Orden,A.V.J.Am.Chem.Soc.,2006,128:1240
11 Wang,W.J.;Chen,C.L.;Qian,M.X.;Zhao,X.S.Sens.Actuator B:Chem.,2008,129:211
12 Qu,P.;Chen,X.D.;Zhou,X.X.;Li,X.;Zhao,X.S.Sci.China Ser.B:Chem.,2009,52:1653
13 Berberan-Santos,M.N.;Bodunov,E.N.;Valeur,B.Chem.Phys., 2005,315:171
14 Koppel,D.E.Phys.Rev.A,1974,10:1938
15 Steinbach,P.J.;Ionescu,R.;Matthews,C.R.Biophys.J.,2002, 82:2244
16 Steinbach,P.J.;Ionescu,R.;Matthews,C.R.J.Chem.Inf. Comput.Sci.,2002,42:1476
October 26,2009;Revised:December 23,2009;Published on Web:February 5,2010.
Maximum Entropy Method for Analyses of Fluorescence Correlation Spectra of Oligonucleotide Intra-Chain Collision
YIN Yan-Dong ZHOU Xiao-Xue ZHAO Xin-Sheng*
(Beijing National Laboratory for Molecular Sciences,State Key Laboratory for Structural Chemistry of Unstable and Stable Species,Department of Chemical Biology,College of Chemistry and Molecular Engineering, Peking University,Beijing 100871,P.R.China)
It has been a challenge to accurately extract dynamic information from experimental fluorescence correlationspectroscopy(FCS)data.Inthispaper,wecomparethreemajorfittingmethods:the model-dependent multiple exponential function(MultiExp),the empirical stretched exponential function(StreExp),and the exponential function based on the model-free maximum entropy method(MemExp).MultiExp has straight forward physical significance but it is difficult to implement and interpret in a complex system.StreExp has simple form and is easy to use but its physical picture is obscure.MultiExp is model free but its results are sensitive to experimental noise.A good choice seems to be a combination of MemExp and MultiExp.In our example,we have unraveled that two independent processes exist in the intra-chain collision of a single-stranded DNA when base pair formation is possible,which has not been observed by previous investigators.MemExp is recommended for the FCS data analysis,although caution should be exercised in the practice.
Fluorescence correlation spectroscopy; Relaxation time distribution; Stretched exponential function; Maximum entropy method; Oligonucleotide; Photoinduced electron transfer
*Corresponding author.Email:zhaoxs@pku.edu.cn;Tel:+86-10-62751727.
The project was supported by the National Natural Science Foundation of Chinca(20673002,20733001,20973015)and National Key Basic Research Program of China(973)(2006CB910304,2010CB912302).
国家自然科学基金(20673002,20733001,20973015)和国家重点基础研究发展规划项目(973)(2006CB910304,2010CB912302)资助
O643
