Analysis of Mechanics During Berthing of Engineering Ships
2010-02-27JIANGZhiyuXIEZhonganGUMintong
JIANG Zhi-yu,XIE Zhong-an,GU Min-tong
(School of Naval Architecture,Ocean and Civil Engineering,Shanghai Jiao Tong University,Shanghai 200240,China)
1 Introduction
It is conventional to observe berthing and collision between large engineering ships.To cushion the impact force,rubber fenders are generally adopted.They go through deformation as well as transmit impact load to the side structures of the anchored ship during the berthing process.To guarantee safety,neither ship structure nor rubber fender should experience failure or damage.By some complicated methods,the response of the berthing ship in the time domain can be solved[1-2].Consequently,the berthing force and the energy absorption are obtained.In other ways,approximated analyses[3-5]are carried out.
Rubber fenders,hanging outside the ship side,are characterized by material nonlinearity.If the impact load becomes too large,fenders deform overly and may wreck damage.Accordingly,the capability of the anchored ship to endure berthing depends closely on the behaviors of the rubber fenders as well as the stiffness of its side structures and the kinetic energy carried by the berthing vessel.The advent of nonlinear FE technologies and software makes it possible to simulate rubber behavior and acquire creditable results[6].
In this paper,a simplified model applicable to the berthing of engineering ships is first presented.In addition,formulas to estimate the maximum berthing are derived based on ener-gy equivalence and several assumptions.Further,we conduct numerical experiment of the berthing and collision between a 2 000m3self-propelled split-hopper barge and a 4 500m3/h self-propelled cutter suction dredger.Through this example,the berthing force and the energy transmitted are analyzed,compared and the optimum type of rubber fender is found.The derived formulas are verified as well.
2 Physical modeling of ship berthing
2.1 Berthing scenario
As shown in Fig.1,the hopper barge berths with approaching velocity V0in the η-direction towards the dredger which is fixed in the water by its spud.After their first contact,the barge’s dynamic motion involves swaying,yawing and rolling and so on due to the eccentricity of the barge’s center of gravity to the collision point.Afterwards,the two vessels will contact several times until the berthing process is terminated.Since the majority of energy and momentum is dissipated in the first collision,the analysis is restricted to the first impact.Fig.2 illustrates the assumed collision region,which is in the weakest section of the dredger.
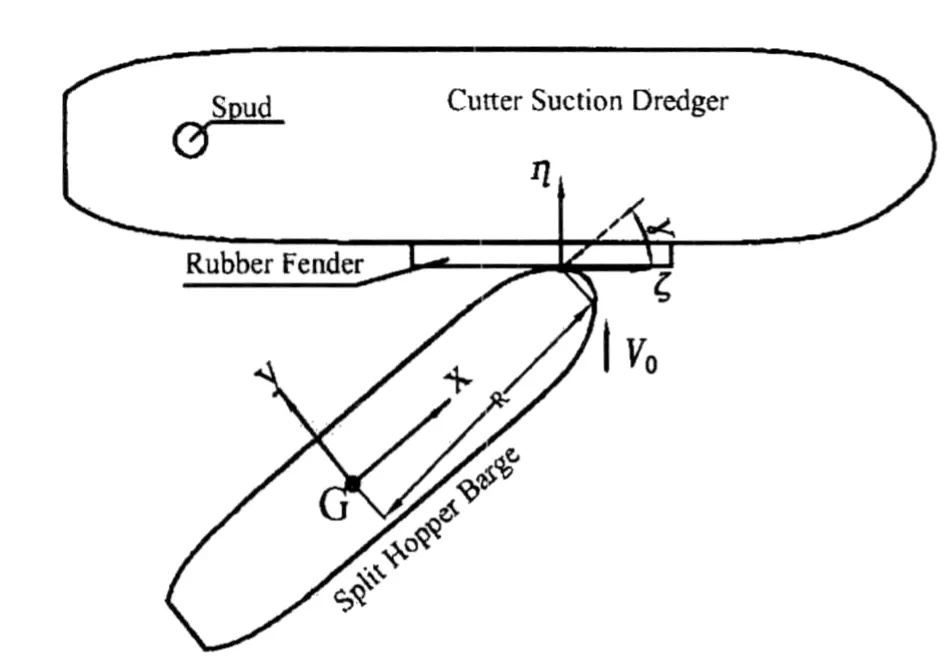
Fig.1 Coordinate system,configuration of the engineering ships

Fig.2 Collision region

Tab.1 Dimensions and load conditions of the studied engineering vessels
2.2 Energy equations
When the first collision occurs,the initial kinetic energy can be expressed as

where M is the effective mass of the berthing ship,IGis the inertia moment,V0,ω0denote the initial translational and rotational velocity respectively.
During berthing,the berthing barge transforms its kinetic energy into:
(1)Elastic deformation energy of the fender

where F denotes the berthing force,S denotes the pressing distance.
(2)Structural deformation energy of side structure of the dredger and the bow of the barge

where K and η represents structural stiffness and displacement.
(3)Work done by the berthing ship in rotational motions:

where H and R denotes the horizontal and vertical distance between the contact point and center of gravity of the barge,shown in Fig.1; Φ and θ represent the angle of heeling and swinging.
(4)System vibration[5,7]

Among these,the deformation energy of the rubber fender counts for vast majority of it.To simplify the problem safely,we further assume that all of the initial kinetic energy is turned into three parts:the deformation energy of the fender;the deformation energy of the side structures of the dredger and the vibration energy of the barge in the η-direction.

2.3 Estimation of the effective berthing energy
It should be noted that only part of the initial kinetic energy of the berthing vessel takes effect.Impact energy in formula(1)can be rewritten as(Refs.[8-9]):

here Cmis the added mass coefficient,generally taken as 0.4 for sway motion[10-11].To improve the accuracy,we calculate the added mass coefficients based on hull shapes of the barge at each section.This method is presented in Ref.[5].Thus,the coefficient alongside the ship length is obtained,see Fig.3.The overall added mass coefficient,0.139 6,is calculated by integration along the length.MVis the displacement of the berthing ship,which is 1 552.8t for light condition[12].Ceis the parameter that takes into account the position of the collision point,and it can be expressed as:

where Kvdenotes the rotational radius of the ship,Rvis the distance between the contact point and gravity center of the berthing vessel,γ is the angle between V0and the vector of centerline.As can be illustrated by Fig.4,the maximum value of Ceis 0.528.

Fig.3 Distribution of Cmalong length

Fig.4 Relation between Ceand γ
Csand Ccare generally assumed to be 1[4].
Therefore,effective berthing energy corresponding to a given initial velocity can be obtained.
2.4 Simplified formula for the maximum berthing force
Since large berthing force remains as the main threat to the structural safety of ship during berthing,it is necessary to evaluate its peak value.As far as the side structure of the dredger deforms within the elastic range and the failure of the rubber fender does not take place,we assume that the berthing system can be approximated as a two degree-of-freedom system illustrated by Fig.5,where berthing ship is approximated as an effective mass,rubber fender as a spring with nonlinear stiffness coefficient k and side structure of the dredger as a spring with linear stiffness coefficient k′.
Let δ be the relative displacement of the two springs:δ=x-u.According to Ref.[13],the berthing force of the rubber fender can be written as


Tab.2 Effective berthing energy

Fig.5 Simplified model of the berthing system
In the above equation,k is the linear stiffness of the nonlinear spring,ε is a nonlinear parameter.The crushing force of the side structure can be written as

Hence,when the first impact ends,Eq.(9)can be expressed as

Equation about the maximum crushing distance of the rubber fender can thus be obtained,

Solving Eq.(14),the positive root,

Eq.(17)indicates that when k and ε keep constant,the maximum berthing force depends on k′,the stiffness of the dredger’s side.The capability of the side structure to endure the impact rises proportionally to k′.Through stiffness analysis,introduced in Ref.[14],the side stiffness of the studied dredger is determined as 1.019×10⁷N/m.
Finally,when the relative stiffness of the side structure to the rubber fender is large enough,namely k/k′≈0,Eq.(17)is reduced to

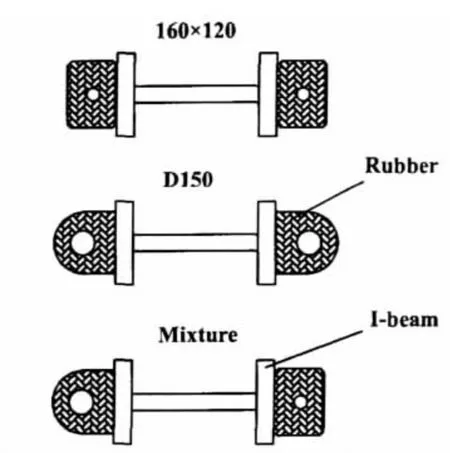
Fig.6 Cross sections of the fender
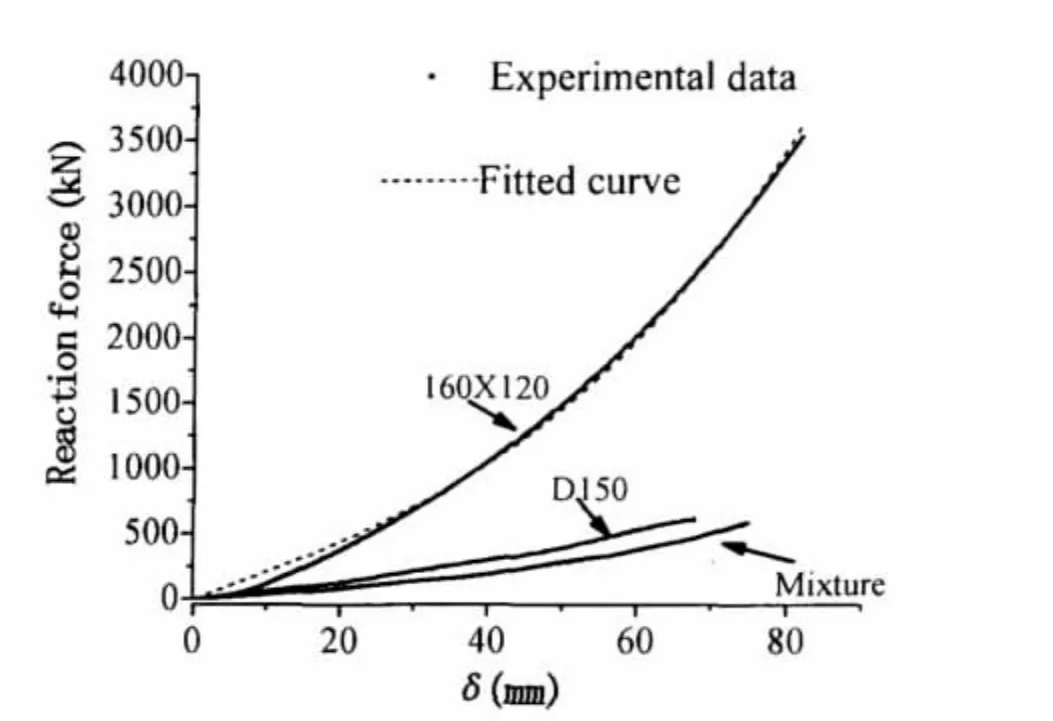
Fig.7 Compression load-deflection curve for rubber fenders
Generally speaking,Eq.(18)can predict the peak berthing force in the absence of k′.It can be further observed that for a certain struck ship,the value of berthing force relies on the behavior of nonlinear spring.As the linear stiffness k and nonlinear parameter ε decrease,the rubber fender grows more flexible and the protective characteristics become more evident.
Fig.6 shows the cross sections of the three types of fender discussed here.The rubber is tied to the I-beam at both ends.Fig.7 and Tab.3 present the experimental curves of the reaction force and the fitted ones from which values of k and ε in Eqs.(17),(18)are determined.

Tab.3 Parameters of the fitted curve
3 FE modeling
Based on the assumptions of Section 2,one hold of the dredger from FR65 to FR81 is built by MSC.PATRAN.There are about 120 000 elements in the whole model(Fig.8).Ship plates are modeled by BLT shell elements and longitudinals by beam elements.As for rubber,solid elements with size around 20mm×20mm×20mm are applied.The berthing barge is simplified as a hitter with dimension of 1 600mm×2 510mm×1 000mm.During simulation,the effective mass of the barge and velocity ranging from 0.3kns to 0.8kns is assigned to the hitter[8-9].Each case runs about 12h for the LS-DYNA solver on a Linux IA64 platform.

Fig.8 Sectional FE-model

Fig.9 Local fine meshes
In LS-DYNA,Mooney-Rivlin model[15-16],defined by two parameters,is selected for the incompressible rubber element:

where W is the strain energy density function,I1,I2,I3are strain invariants in terms of the principle stretches.C,D can be determined by C01,C10.For 160×120 type of rubber(160×120),C10=0.23,C01=0.28;for D150 type of rubber(D150),C10=0.55,C01=0.19.These coefficients are acquired according to Refs.[17-18].
As for ship steel,we take into account the effect of strain rate and consider the Cowper-Symonds stress-strain relation[19]:

where D=40.4,q=5[19].
4 Results and discussion
4.1 Energy absorption
Fig.10 depicts the time history of the system’s energy when the barge approaches with velocity of 0.4kns.From the moment of contact(t≈0.2s)the kinetic energy of the system is gradually converted into internal energy,i.e.the deformation energy of rubber fender and ship side.When the kinetic energy drops to zero at t≈0.8s,the berthing process is treated as ended.
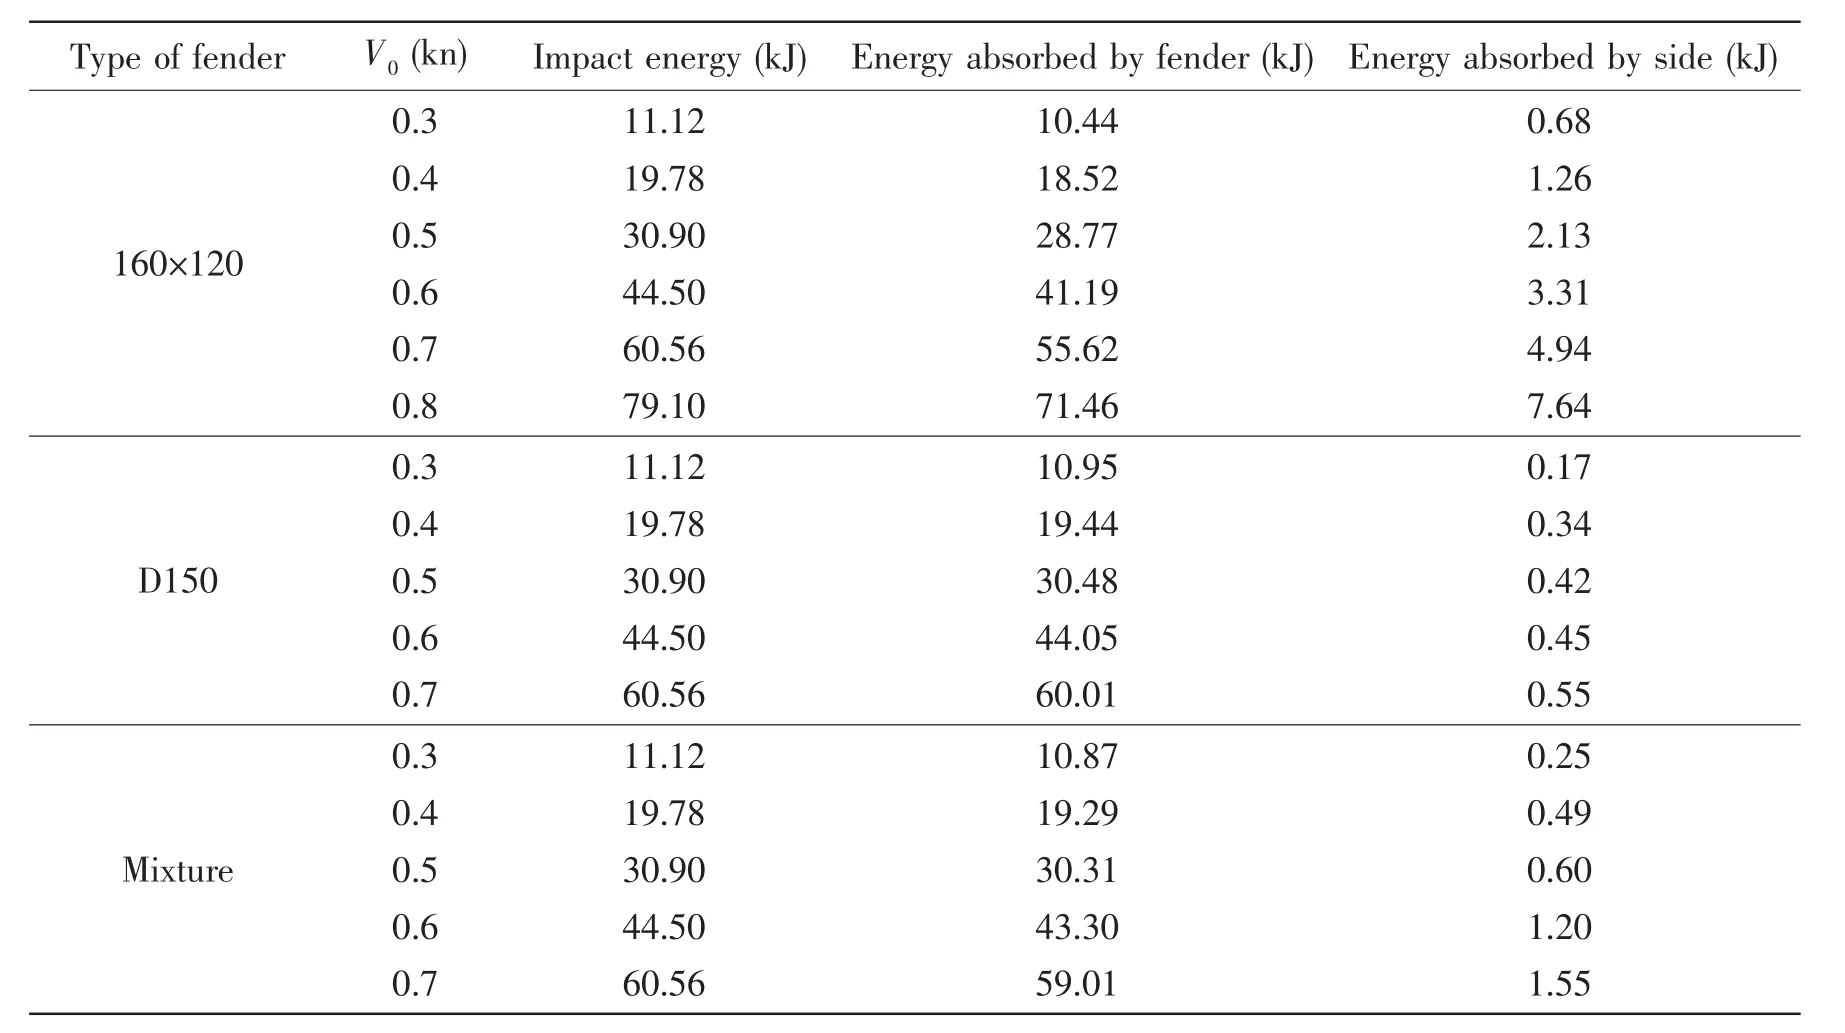
Tab.4 contains the energy absorbed by the rubber fender and the side structures respectively at the last moment of each berthing process.Here we define energy absorption ratio Er=Efender/Etotal,where Etotaland Efendercorrespond to the 3th and 4th column in Tab.4.Eris an indicator of rubber fender’s energy-absorbing capability.Larger Erimplies a better protective role in berthing.
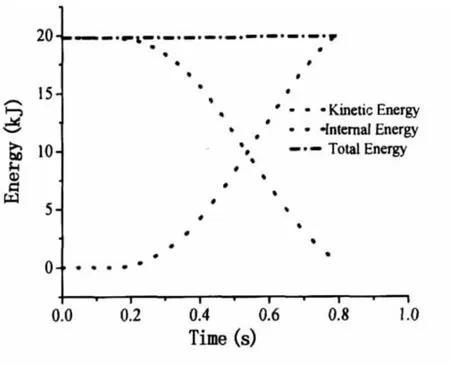
Fig.10 Typical time history of the berthing system’s energy(D150,V0=0.4kns)
Tab.4 Distribution of absorbed energy when berthing finishes
It is shown in Fig.11 that the energy-absorbing capabilities of D150 and Mixture surpass that of 160×120.Erof D150 and Mixture both exceed 0.97.In comparison,Erof 160×120 is lower and decreases with rising berthing velocity.Based on the results of numerical calculation,when V0=0.8kns,the absorbed energy of the fenders counts for barely over 90%of the total.This might be dangerous from the point of view of ship safety.
What worth mentioning is that when V0=0.6kns,D150 becomes ineffective.Similarly,Mixture no longer performs soundly when V0reaches 0.7kns.Such phenomenon reveals that the berthing velocity for these types cannot be too high.
When 160×120 is applied,side structures of the dredger will get more involved in the deformation,converting certain amount of initial kinetic energy into their internal energy.As shown by Fig.12,when berthing speed becomes high,side longitudinals play the biggest role in the energy absorption;next come the web beams and side plates around the collision region.Therefore,it is necessary to optimize dimensions of these structures to combat impact load more efficiently.

Fig.11 Relation of Erand V0
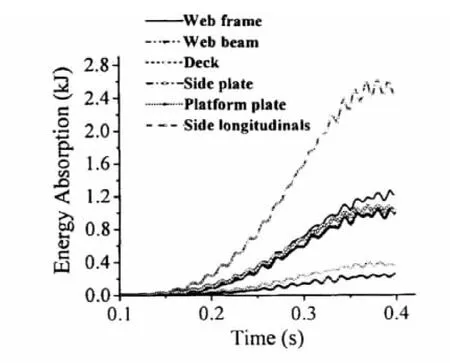
Fig.12 Energy distribution of side structures(160×120,V0=0.8kns)
4.2 Berthing force
Fig.13 presents both the theoretical values and the FE values of the peak berthing force of the three types of fender.Evidently,the berthing force of 160×120 is greater than that of the other two types and grows steadily with the speed.Such relation can be best summarized by a linear relation,see Fig.14:

The major reason for such steady growth of force with velocity is that the effective energy of the berthing energy is not large enough so that the fender still deforms within allowable range.However,when V0approaches 0.8kns,maximum stress in the web frame of the dredger exceeds the yield stress of steel and may cause damage.The values predicted by Eq.(17)and Eq.(18)slightly deflect from FE results,see Fig.13.Therefore,it is safe enough to apply Eq.(18)to predict the maximum berthing force in most cases.
It is also found in Fig.13 that the maximum berthing force of D150 is rather close to that of Mixture when V0is less than 0.6kns.As V0turns higher,their disparity becomes obvious:the force of D150 hardly grows,while the force of Mixture mounts quickly.The stagnant growth of force of D150 could be explained by FE results,which reflects that D150 is fully compressed at V0=0.4kns and becomes invalid at V0=0.6kns.D150’s maximum allowable berthing speed is therefore,0.5kns.The ultimate allowable berthing velocity for Mixture,in contrast,can be extended to 0.6kns.

Fig.13 Maximum berthing force vs.speed

Fig.14 Maximum berthing force vs.speed(160×120)
For Mixture,simplified formulas Eq.(17)and Eq.(18)give fairly good predictions compared with the FE results.For D150,it is still safe and acceptable to apply them at velocity lower than 0.5kns.Since D150 deforms excessively at higher V0and fails,it is not accurate or necessary to apply the assumptions of the proposed formulas(e.g.the cubic relation between force and displacement).
5 Conclusions
The berthing process involves the interaction of two engineering ships and rubber fenders.This paper investigates several mechanical characteristics of the rubber fender and the ship structures through analytical simplification and numerical experiments.
An energy-based model is presented and simplified formulas are proposed to predict the maximum berthing force.According to the results of FE simulation,these formulas provide reasonably accurate predictions of the impact loads as far as failure of rubber fenders does not take place.The predicted maximum load can be applied to the structural analysis of the vessel to improve the structural safety.
Amongst the three types of fenders studied,160×120 leads to large berthing force and comparatively low energy-absorbing ability with the maximum berthing speed of 0.7kns;D150 causes small reaction force but absorbs most of the berthing energy with the safe berthing speed of 0.5kns;Mixture displays properties similar to D150’s,but its maximum berthing ve-locity can be promoted to 0.6kns.Thus,for the concern of ship safety,it is advisable to use Mixture in general occasions.
During berthing,when 160×120 type of fender is used,side structures of the dredger actively participate in the energy absorption.Side longitudinals,web beams,side plates and web frames play a larger role.
Nonlinear FE simulation can be used to simulate the ship berthing process and is especially effective when rubber fender approaches its limit conditions.
[1]Fontijn H L.Fender forces in ship berthing[D].Delft:TU Delft,1988.
[2]Gokdeniz N,Deniz U.Dynamics of ships and fenders during berthing in a time domain[J].Ocean Engineering,2006(33):1919-1934.
[3]Zhu H,Zheng J.A review on the researches of ship collision[J].Advances in Mechanics,1994,24(4):559-568.(in Chinese)
[4]Liu X,Zhang S,Qian F,et al.Study on the response of the collision avoidance process of offload platform[J].Journal of Shanghai Jiaotong University,2007,41(2):189-193.(in Chinese)
[5]Sadao K,Abdel H S.Dynamic response of the ship and the berthing fender system after impact[C].Proceedings of JSCE,1972(200).
[6]Hu Z,Gu Y,Gao Z,et al.Fast evaluation of ship-bridge collision force based on nonlinear numerical simulation[J].Engineering Mechanics,2005,22(3):234-237.(in Chinese)
[7]Preben T P,Li Y.On the global ship hull bending energy in ship collisions[J].Marine Structures,2009(22):2-11.
[8]Ccc first&second harbor consultants Co,Ltd.Load code for harbor engineering[S].1999:41-45.(in Chinese)
[9]Hong Kong Civil Engineering Department.Maritime structures-part 1:Code of practice for design of fendering and mooring system[S].2003:51-54.(in Chinese)
[10]Wang Z,Jiang Z,Gu Y.An added water mass model for numerical simulation of ship/ship collisions[J].Explosion and Shock Waves,2002,22(4):321-326.(in Chinese)
[11]Preben T P,Zhang S.On impact mechanics in ship collisions[J].Marine Structures,1998(11):429-449.
[12]Jiang R,Gu M.Stability report of 2 000m3split-hopper barge[R].Shanghai:Shanghai Jiaotong University,2004.(in Chinese)
[13]Chen H.Study on modeling of shock resistance characteristics of ship power unit[D].Shanghai:Shanghai Jiaotong University.(in Chinese),1996.
[14]Qian F.Study on ship berthing and collision avoidance at sea[D].Shanghai:Shanghai Jiaotong University.(in Chinese),2003.
[15]Li Y,Liu Y,He J.The design of rubber fenders structure by numerical calculation[J].Port Engineering Technology,1997(2):39-45.(in Chinese)
[16]Livermore Software Technology Corporation.LS-DYNA Keyword Manual 970[M].2006.
[17]Jiangyin Hengsheng Rubber&Plastic Products Co,Ltd.Test report of marine rubber products[R].2008.(in Chinese)
[18]Wang W,Deng T,Zhao S.Determination for material constants of rubber Mooney-Rivlin model[J].Special Purpose Rubber Products,2004,25(4):8-10.(in Chinese)
[19]Wang Z,Gu Y.Effect of strain-rate sensitivity on the behavior of ship structure in collision[J].Journal of Ship Mechanics,2001,5(6).40-49.(in Chinese)
杂志排行
船舶力学的其它文章
- Modeling and Simulation of Cavitating Flow over Underwater Vehicle with Large Angle of Attack
- Hydrodynamic Analysis of 3-D Hydrofoil under Free Surface in Time Domain
- Hydroelastic Analysis of SWATH Ship Wave Loads
- Applicability of the Improved Crack Growth Rate Model for a Wide Range of Alloys under Constant Amplitude Load
- Vulnerability Evaluation of Aircraft Guarantee System by Improved Fuzzy Petri Net
- Optimum Design of Cylindrical Shells under External Hydrostatic Pressure
