Spatiotemporal variability of rain-on-snow events in the arid region of Northwest China
2024-04-22YANGZhiweiCHENRenshengLIUZhangwenZHAOYanniLIUYiwenWUWentong
YANG Zhiwei, CHEN Rensheng, LIU Zhangwen, ZHAO Yanni, LIU Yiwen,WU Wentong
1 Qilian Alpine Ecology and Hydrology Research Station, Key Laboratory of Ecological Safety and Sustainable Development in Arid Lands, Northwest Institute of Eco-Environment and Resources, Chinese Academy of Sciences, Lanzhou 730000, China;
2 University of Chinese Academy of Sciences, Beijing 100049, China
Abstract: Rain-on-snow (ROS) events involve rainfall on snow surfaces, and the occurrence of ROS events can exacerbate water scarcity and ecosystem vulnerability in the arid region of Northwest China (ARNC).In this study, using daily snow depth data and daily meteorological data from 68 meteorological stations provided by the China Meteorological Administration National Meteorological Information Centre, we investigated the spatiotemporal variability of ROS events in the ARNC from 1978 to 2015 and examined the factors affecting these events and possible changes of future ROS events in the ARNC.The results showed that ROS events in the ARNC mainly occurred from October to May of the following year and were largely distributed in the Qilian Mountains, Tianshan Mountains, Ili River Valley, Tacheng Prefecture,and Altay Prefecture, with the Ili River Valley, Tacheng City, and Altay Mountains exhibiting the most occurrences.Based on the intensity of ROS events, the areas with the highest risk of flooding resulting from ROS events in the ARNC were the Tianshan Mountains, Ili River Valley, Tacheng City, and Altay Mountains.The number and intensity of ROS events in the ARNC largely increased from 1978 to 2015,mainly influenced by air temperature and the number of rainfall days.However, due to the snowpack abundance in areas experiencing frequent ROS events in the ARNC, snowpack changes exerted slight impact on ROS events, which is a temporary phenomenon.Furthermore, elevation imposed lesser impact on ROS events in the ARNC than other factors.In the ARNC, the start time of rainfall and the end time of snowpack gradually advanced from the spring of the current year to the winter of the previous year,while the end time of rainfall and the start time of snowpack gradually delayed from autumn to winter.This may lead to more ROS events in winter in the future.These results could provide a sound basis for managing water resources and mitigating related disasters caused by ROS events in the ARNC.
Keywords: rain-on-snow events; snowpack; snowmelt; climate change; Spearman's rank correlation; arid region of Northwest China
1 Introduction
Rain-on-snow (ROS) events are specific rainfall events that occur in seasonal snow-covered areas,mainly in late autumn and early spring and occasionally in winter (Ye et al., 2008; Pan et al., 2018).Although ROS events occur in only a few times throughout the year, the impact of ROS events is significant.The occurrence of ROS events increases the water content of snowpack (Colbeck, 1972;Singh et al., 1997; Yang et al., 2023) and causes the breakdown of the intergranular structure of snow surfaces (Heywood, 1988; Conway and Raymond, 1993; Singh et al., 1997).Particularly during the snowmelt period, ROS events significantly reduce the snow albedo (Kattelmann, 1985;Huntington et al., 2004; Yang et al., 2023), resulting in more solar radiation absorbed by snow and accelerating snow melt (Marks, 2001; Garvelmann et al., 2014; Yang et al., 2023).Moreover, this effect is greater during the days following a ROS event (Yang et al., 2023).However, rapid snowmelt increases the amount of liquid water in snow or even results in water seepage from snow,and large amounts of liquid water can form an ice crust when snow or ground refreezes, which can be harmful to foragers and hoofed animals (Putkonen and Roe, 2003; Rennert et al., 2009).Accelerated snowpack melting as a result of ROS events allows snowpacks to be reduced as they begin to melt in spring, while heat-carrying rainwater could infiltrate and warm the ground(Anderson, 1968; Myers et al., 2021), which may alter the energy balance of permafrost (Putkonen and Roe, 2003; Rennert et al., 2009), thereby triggering a range of ecohydrological responses(Cohen et al., 2015).Furthermore, compared to natural snowmelt, ROS events are more likely to lead to floods with significant ring-breaking forces (Eiriksson et al., 2013; Pomeroy et al., 2016;Vahedifard et al., 2017; Musselman et al., 2018; Sezen et al., 2020) and cause disasters such as landslides (Harr, 1981) and avalanches (Stimberis and Rubin, 2011).
Historical evidence suggests that the spatiotemporal characteristics of ROS events are exhibiting large-scale changes in response to warming-induced variations in snowpack and precipitation phase patterns (Barnett et al., 2005).ROS events increase at higher elevations and decrease at lower elevations in the western United States (McCabe et al., 2007; Surfleet and Tullos, 2013; Musselman et al., 2018), which is also true in Switzerland (Morán-Tejeda et al.,2016).The decrease in ROS events at lower elevations in the western United States is partly due to changes in the El Niño-Southern Oscillation and the smaller number of days of snowfall on the ground due to the increased surface temperatures.However, the number of ROS events in New York State, which is located in the northeastern United States, decreases with increasing temperature (Pradhanang et al., 2013).There is an increasing trend in ROS events in western Russia and a decreasing trend in western Canada (Groisman et al., 2003).The decrease in ROS events in western Canada is due to snowpack reduction.All upland basins in Central Europe show a decreasing trend in ROS events from April to May and an increasing trend in most lowland and upland basins in January and February (Freudiger et al., 2014).ROS events in China increase at high elevations and decrease at low elevations, but the trend in ROS events considerably varies at different elevations (Zhou et al., 2023).The above analyses show that ROS events in different countries or regions respond differently to climate warming, and even ROS events in different regions of the same country can exhibit different variations due to topography and climate differences (Maina and Kumar, 2023).
The arid region of Northwest China (ARNC) is an important part of the arid region of Central Asia and exhibits a complex topography, a unique climate, and extremely fragile ecosystems.Seasonal permafrost is widely distributed in the region, and snow is relatively abundant in northern Xinjiang Uyghur Autonomous Region, Tianshan Mountains, and Qilian Mountains,especially in northern Xinjiang, which is one of the three major stable snow areas in China(Wang and Li, 2012; Ke et al., 2016; Tan et al., 2019; Yang et al., 2022).Abundant snowpacks not only comprise a major source of recharge for rivers but also impose a favourable insulating effect on seasonal permafrost (Ling and Zhang, 2003; Gouttevin et al., 2012).Therefore,snowpacks are important for the ecology and hydrology in the ARNC.However, the occurrence of ROS events can lead to rapid melting of a large amount of snowpacks (Yang et al., 2023),which can exacerbate water scarcity issues in the ARNC and disrupt the energy balance of seasonal permafrost, yielding significant ecological and hydrological impacts.To this end, we analysed the spatiotemporal variability of ROS events from 1978 to 2015 using daily meteorological data and daily snow depth data and examined the factors affecting ROS events and possible future changes in such events to provide a systematic basis for managing water resources and mitigating the related disasters caused by ROS events in the ARNC.
2 Materials and methods
2.1 Study area
The ARNC is approximately between 73°-107°E and 35°-50°N (Fig.1).The region is dominated by high mountain ranges such as the Tianshan Mountains, Kunlun Mountains, Altun Mountains,Altay Mountains, and Qilian Mountains, and is surrounded by inland basins such as the Tarim Basin, Junggar Basin, and Hexi Corridor, with China's four major deserts and a large part of the Gobi region, accounting for about 25% of the land area of China.The ARNC lies deep in the hinterland of the Asian continent and exhibits a typical continental climate, with scarce precipitation and extremely fragile ecosystems.Seasonal permafrost is widespread in the region,and most rivers originate from mountainous areas and are mainly recharged by glacial snowmelt.
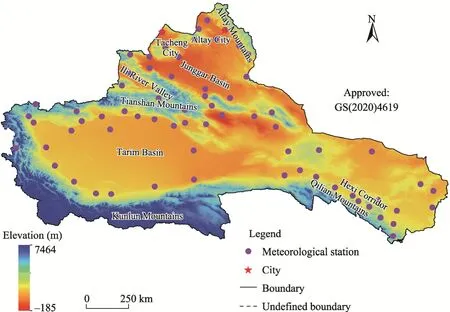
Fig.1 Overview of the arid region of Northwest China (ARNC) based on the digital elevation model (DEM).DEM data were obtained from Hydrological data and maps based on SHuttle Elevation Derivatives at multiple Scales (HydroSHEDS) (https://hydrosheds.org/downloads).Tacheng City is the administration center of Tacheng Prefecture in Xinjiang Uygur Autonomous Region and Altay City is the administration center of Altay Prefecture.Note that the figure is based on the standard map (GS(2020)4619) of the Map Service System(https://bzdt.ch.mnr.gov.cn/), and the standard map has not been modified.
2.2 Data
Daily snow depth data and daily meteorological data from 68 meteorological stations from 1 January 1978 to 31 December 2015 provided by the China Meteorological Administration National Meteorological Information Centre (CMA NMIC) (http://data.cma.cn/) were used to investigate the spatiotemporal variability of ROS events in the ARNC.It should be noted that snow depth data from the CMA NMIC for the meteorological stations after 2015 are no longer published, so the time series in this study is 1978-2015.Meteorological data contain information on the surface pressure, air temperature, precipitation, and relative humidity on a daily scale.A spatial representation of the 68 meteorological stations is shown in Figure 1.However, the elevation corresponding to each meteorological station was obtained from the meteorological data provided by the CMA NMIC.On this basis, we used surface pressure, air temperature, relative humidity, elevation, and precipitation data to differentiate precipitation types, after which the differentiated rainfall data combined with the snow depth data were utilised to investigate the spatiotemporal variability of ROS events in the ARNC.
2.3 Methods
2.3.1 Definition of daily ROS event The definition of ROS events notably influences their spatiotemporal variability levels.Previous studies have disagreed on the definition of ROS events (Groisman et al., 2003; McCabe et al.,2007; Morán-Tejeda et al., 2016; Würzer et al., 2016), but in general, ROS events have mostly been defined based on the specific study region and study purpose.Therefore, to investigate the spatiotemporal variability of ROS events in the ARNC, we defined a daily ROS event in this study as rainfall of ≥1 mm falling on a snowpack with a snow depth of ≥1 cm during a 24-h period by referring to the definition of ROS events proposed by Zhou et al.(2023).
However, the intensity of ROS events satisfying this definition may vary considerably, with ROS events of different intensity levels yielding different levels of danger.Therefore, by referring to the definition of the intensity of ROS events proposed by Freudiger et al.(2014), we used the sum of the daily rainfall and daily snowmelt to characterize the intensity of ROS events in this study (Eq.1).However, the specific intensity of ROS events is not intuitive, and this problem can be better solved by comparing ROS events of different intensity levels through the most commonly employed rainfall intensity, as expressed in Equation 2.
whereIROSis the intensity of the ROS event (mm/d);Ris the rainfall (mm/d); andMis the snowmelt (mm/d).The calculations ofRandMare described in Sections 2.3.3 and 2.3.4,respectively.
2.3.2 Definition of the start time and end time of rainfall and snowpack
Based on the definition of ROS events, it can be seen that changes in rainfall and snowpack may cause changes in ROS events; therefore, this study simply predicts the possible changes in future ROS events in the ARNC through the changes in the start time of rainfall and the end time snowpack in spring as well as the end time of rainfall and the start time of snowpack in autumn in a year from 1978 to 2015.The specific definitions of the start time of rainfall and the end time of snowpack in spring as well as the end time of rainfall and the start time of snowpack in autumn are as follows.
The number of days during a complete year was sorted in ascending order.Notably, the earliest date when rainfall occurred was defined as the start time of rainfall in spring, and the latest date when rainfall occurred was defined as the end time of rainfall in autumn.Furthermore, the number of days within a complete year was sorted in ascending order, with 15 July as the boundary.Notably, the latest date when snow disappeared prior to 15 July was defined as the end time of snowpack in spring, and the earliest date when snow began to fall after 15 July was defined as the start time of snowpack in autumn.
2.3.3 Determination of the precipitation type Many precipitation datasets cannot reflect precipitation types, and air temperature thresholds are often used to separate rain and snow.However, several studies have shown that precipitation type classification methods that incorporate relative humidity outperform strategies that only consider air temperature (Ye et al., 2013; Ding et al., 2014; Jennings et al., 2018; Sun et al., 2022).For instance, Ding et al.(2014) developed a method for distinguishing precipitation types based on parameters such as surface pressure, air temperature, relative humidity, and elevation.This method can achieve high accuracy in precipitation type determination in China (Ding et al., 2014;Sun et al., 2022).In this study, the method of Ding et al.(2014) was used to differentiate between precipitation types, which can be expressed as follows:
wherePtypeis the daily precipitation type;Twis the wet bulb temperature (°C); andTsandTrare the threshold temperatures (°C) for snow and sleet, respectively.Tw,Ts, andTrcan be calculated as follows:
whereTais the daily air temperature (°C);Esat(Ta) is the saturation vapour pressure atTa(hPa),given by Tetens' empirical model (Murray, 1967); RH is the relative humidity (%);psis the surface pressure (hPa);T0is the temperature when one-half of the sum of the probability of snow and the accumulation probability of snow and sleet is equal to 0.5 (°C); ΔTand ΔSare the temperature difference and the temperature scale, respectively, notably varying with relative humidity but not with elevation; andZis the elevation (m).
2.3.4 Calculation of the snowmelt
According to the definition of ROS events in Section 2.3.1, snowmelt is essential for quantifying the intensity of ROS events.Typically, snowmelt can be estimated using a temperature index model, which assumes a relationship between snowmelt occurrence and air temperature:
whereMfis the degree-day factor (mm/(°C·d)), with a value of 3 mm/(°C·d) (Martinec and Rango,1986; Hock, 2003; Freudiger et al., 2014); andTbis the threshold temperature for snowmelt (°C)and exhibits a value of 1°C (Hock, 2003).
2.3.5 Correlation analysis
Spearman's rank correlation test method is a nonparametric technique that is independent of the overall statistical distribution and is often used as a statistical tool to detect monotonic relationships.Since the test operates on the rank of the data, it is relatively insensitive to outliers and does not require data to be collected at regularly spaced time intervals (Helsel and Hirsch,1992), which can effectively avoid the impact of zero values on the trend analysis results.Therefore, Spearman's rank correlation test was employed to analyse the trend in ROS events and its factors as well as the correlation between variables.Notably, the trend in ROS events (or its factors) is reflected by the correlation between the number and intensity of ROS events (or its factors) and year, where a positive correlation indicates an increasing trend, and a negative correlation indicates a decreasing trend.Spearman's rank correlation coefficient (r) can be calculated by Equation 11:
whererdenotes the strength of the correlation between variables, which ranges from -1.00(strong negative correlation) to 1.00 (strong positive correlation), with a value of 0.00 indicating no correlation;nis the number of data pairs; anddiis the rank difference of each data pair (xi,yi)(i=1, 2, …,n).A two-tailed significance test (α=0.05 or α=0.01) was conducted to assess the significance of the correlation between two variables.
2.3.6 Statistical analysis
For statistically assessing the spatiotemporal variability of ROS events, we utilised the sum of the number of daily ROS events within a year at each station to represent the annual number of ROS events, and used the sum of the annual number of ROS events from 1978 to 2015 to represent the total number of ROS events at a given station over the 38-a period.We employed the maximum value of the intensity of daily ROS events in a year to represent the annual intensity of ROS events,and used the maximum annual intensity of ROS events from 1978 to 2015 to represent the intensity of ROS events at the station over the 38-a period.Furthermore, the monthly number of ROS events was derived by summing the number of ROS events on all days during the same month from 1978 to 2015, and the monthly intensity of ROS events was determined as the maximum intensity of ROS events on all days during the same month from 1978 to 2015.
3 Results
3.1 Spatiotemporal distribution of ROS events in the ARNC
3.1.1 Spatial distribution of ROS events at the annual scale
ROS events in the ARNC were mainly distributed in the Qilian Mountains, Tianshan Mountains,Ili River Valley, Tacheng Prefecture, and Altay Prefecture, especially in the Ili River Valley,Tacheng City, and Altay Mountains, which exhibited the most occurrences (Fig.2a).Among the above regions, the intensity of ROS events in the Qilian Mountains reached a maximum of 10-25 mm/d (moderate rainfall level), while the intensity of ROS events in the Tianshan Mountains, Ili River Valley, Tacheng City, and Altay Mountains reached a maximum of 25-50 mm/d (heavy rainfall level) (Fig.2b).However, no ROS events with an intensity level greater than 50 mm/d(rainstorm level) occurred in the ARNC.The distribution characteristic of snowpack was basically conforming with that of ROS events (Fig.2c).In summary, the areas with the highest risk of flooding resulting from ROS events in the ARNC were the Tianshan Mountains, Ili River Valley,Tacheng City, and Altay Mountains.
3.1.2 Spatial distribution of ROS events at the monthly scale
Seasonal differences in snowpack may lead to varying monthly distribution of ROS events.Therefore, we analysed the monthly distribution of ROS events in the ARNC (Fig.3).The ROS events in the ARNC predominantly occurred from October to May of the following year (months without ROS events were not shown), especially from November to March of the following year.In addition, the spatial distribution of ROS events in the ARNC varied at the monthly scale.Specifically, in January, ROS events mainly occurred in the Ili River Valley, Tacheng Prefecture,and Altay Prefecture.In February, ROS events mostly occurred in the Ili River Valley and Tacheng Prefecture.In March, ROS events largely occurred in the Tianshan Mountains, Ili River Valley, Tacheng Prefecture, and Altay Prefecture.In April, ROS events mainly occurred in the Tianshan Mountains.In May, ROS events occurred only occasionally in the Tianshan Mountains.In October, ROS events infrequently occurred in the Tianshan Mountains, Ili River Valley,Tacheng Prefecture, and Altay Prefecture.In November, ROS events primarily occurred in the Tianshan Mountains, Ili River Valley, Tacheng Prefecture, and Altay Prefecture.In December,ROS events mainly occurred in the Ili River Valley, Tacheng Prefecture, and Altay Prefecture.

Fig.2 Spatial distribution of the total number of rain-on-snow (ROS) events (a), intensity of ROS events (b),and average snow depth (c) in the ARNC during 1978-2015.Note that the figures are based on the standard map(GS(2020)4619) of the Map Service System (https://bzdt.ch.mnr.gov.cn/), and the standard map has not been modified.
Furthermore, the intensity of ROS events varied from month to month (Fig.4).In January, the intensity of ROS events only reached the level of light rainfall in most areas, but in the Tacheng Prefecture and Altay Prefecture, the intensity of ROS events reached the level of moderate rainfall.Notably, the intensity of ROS events reached the level of heavy rainfall in parts of the Ili River Valley and Altay Mountains.In February, the intensity of ROS events across the ARNC reached a maximum level of moderate rainfall, mainly in the Ili River Valley, Tacheng Prefecture, and parts of the Altay Prefecture.In March, the intensity of ROS events in the Altay Prefecture increased,reaching the level of moderate rainfall in most areas.Moreover, the intensity of ROS events in the Tianshan Mountains began to increase, even reaching the level of heavy rainfall in some areas.In April, ROS events at the level of moderate rainfall occurred in the Altay Prefecture, Qilian Mountains, and Tianshan Mountains, while ROS events at the level of heavy rainfall occurred in the Ili River Valley.In May, ROS events only in the Tianshan Mountains and Qilian Mountains reached the level of moderate rainfall, and all other regions exhibited lower intensity level.In October, the intensity of ROS events in the Ili River Valley, Qilian Mountains and Altay Prefecture reached the level of moderate rainfall, with some parts of the Tianshan Mountains exhibiting heavy rainfall level.In November and December, ROS events at the level of heavy rainfall occurred in the Ili River Valley, Tacheng Prefecture, and parts of the Altay Prefecture, and ROS events at the level of moderate rainfall mainly occurred in the Tianshan Mountains, Qilian Mountains, and most parts of the Altay Prefecture.
3.2 Trends in ROS events in the ARNC
To ensure the reliability of trend analysis, we selected 38 stations with ROS events in at least 5 a for trend analysis (Fig.5).Figure 5 shows an increasing trend in the number of ROS events at 28 of the 38 stations analysed, with 6 stations exhibiting a significant increase at the 95% confidence level (Fig.5a), suggesting that the number of ROS events predominantly increased across the ARNC.Moreover, as shown in Figure 5b, the stations with increasing trends in the intensity of ROS events were basically the same as those with increasing trends in the number of ROS events.Therefore, the disaster risk of ROS events increased across the ARNC.
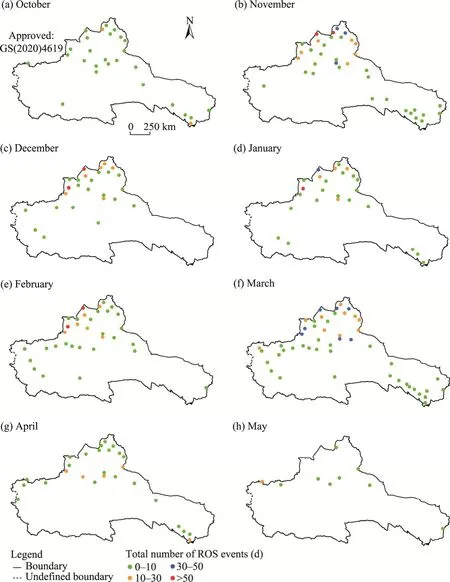
Fig.3 Spatial distribution of the total number of ROS events in October (a), November (b), December (c),January (d), February (e), March (f), April (g), and May (h) in the ARNC during 1978-2015.Stations without ROS events from 1978 to 2015 are not shown in the figure.Note that the figures are based on the standard map(GS(2020)4619) of the Map Service System (https://bzdt.ch.mnr.gov.cn/), and the standard map has not been modified.
3.3 Factors affecting the ROS events in the ARNC
The occurrence of ROS events is closely related to snowpack and rainfall, so we first analysed the trends in the number of snowpack days (with daily snow depth>0 cm) and rainfall days (with daily rainfall>0 mm) across the ARNC and changes in air temperature (average annual temperatures were used here), which greatly impact snowpack and rainfall.The results showed a significant increase in air temperature across the ARNC during 1978-2015 (Fig.6a), but the number of snowpack and rainfall days indicated different trends in different regions.During the study period, the number of snowpack days decreased in the Tacheng City, Altay Prefecture, and northern slopes of the Tianshan Mountains, while the number of snowpack days increased in the other areas (Fig.6b).The number of rainfall days decreased in the Altay Prefecture and Qilian Mountains, but increased in the other areas (Fig.6c).
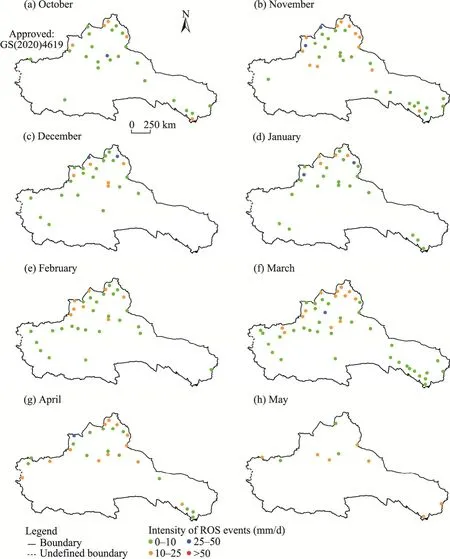
Fig.4 Spatial distribution of the intensity of ROS events in October (a), November (b), December (c), January(d), February (e), March (f), April (g), and May (h) in the ARNC during 1978-2015.Stations without ROS events from 1978 to 2015 are not shown in the figures.Note that the figures are based on the standard map(GS(2020)4619) of the Map Service System (https://bzdt.ch.mnr.gov.cn/), and the standard map has not been modified.

Fig.5 Trends in the number (a) and intensity (b) of ROS events at 38 meteorological stations in the ARNC during 1978-2015.The 38 stations have ROS events occurring at least 5 a.Note that the figures are based on the standard map (GS(2020)4619) of the Map Service System (https://bzdt.ch.mnr.gov.cn/), and the standard map has not been modified.
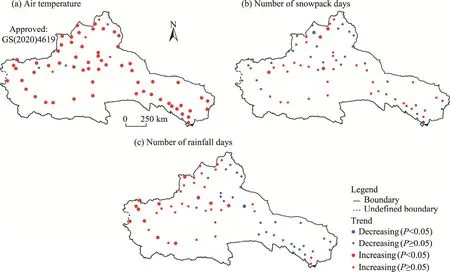
Fig.6 Trends in air temperature (a), number of snowpack days (b), and number of rainfall days (c) at 68 meteorological stations in the ARNC during 1978-2015.Note that the figures are based on the standard map(GS(2020)4619) of the Map Service System (https://bzdt.ch.mnr.gov.cn/), and the standard map has not been modified.
After analysing the trends in air temperature, number of snowpack days, and number of rainfall days in the ARNC, we chose 38 stations with ROS events occurring at least 5 a to analyse the effects of air temperature, number of snowpack days, and number of rainfall days on ROS events(Fig.7).The results revealed that in the ARNC, air temperature was negatively correlated with the number of ROS events at most of the stations (Fig.7a), while the number of snowpack days and number of rainfall days were positively correlated with the number of ROS events (Fig.7b and c).This suggested that the number of ROS events decreases with increasing air temperature and increases with increasing number of snowpack and rainfall days.However, Figures 6a and 7a revealed that the number of ROS events at most of the stations should follow a decreasing trend,but based on Figures 6b-c and 7b-c, the number of ROS events at most of the stations should follow an increasing trend.This is contradictory because the trend in ROS events at each station was only based on one case (Fig.5a).For this purpose, by referring to the method of McCabe et al.(2007) for analysing factors influencing ROS events, we analysed the correlation between the trend in ROS events (correlation between the number of ROS events and year) and the correlation of the number of ROS events with air temperature, number of snowpack days, and number of rainfall days (Fig.8).
There was a significant positive correlation (P<0.01) between the trend in ROS events and the correlation of the number of ROS events with air temperature, withrvalue of 0.60 (Fig.8a).There was a positive but not significant correlation between the trend in ROS events and the correlation of the number of ROS events with the number of snowpack days (Fig.8b).There was a significant positive correlation (P<0.01) between the trend in ROS events and the correlation of the number of ROS events with the number of rainfall days, withrvalue of 0.51 (Fig.8c).
Therefore, it could be concluded that the number of ROS events in the ARNC was more notably influenced by air temperature and the number of rainfall days and less notably influenced by the number of snowpack days.Figures 5-7 showed that the stations with increasing trends in ROS events coincided with those where ROS events were positively correlated with air temperature and the number of rainfall days.
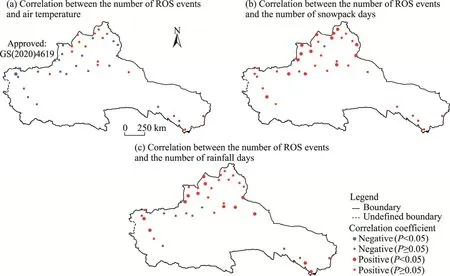
Fig.7 Correlations of the number of ROS events with air temperature (a), the number of snowpack days (b), and the number of rainfall days (c) at 38 meteorological stations in the ARNC.The 38 stations have ROS events occurring at least 5 a.Note that the figures are based on the standard map (GS(2020)4619) of the Map Service System (https://bzdt.ch.mnr.gov.cn/), and the standard map has not been modified.
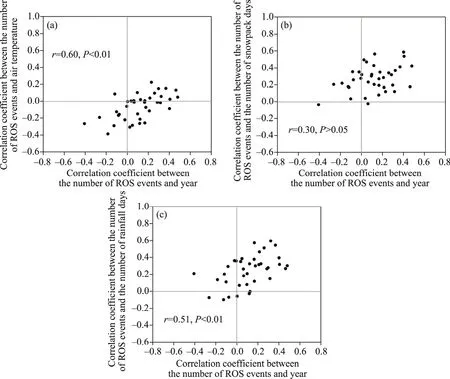
Fig.8 Correlations between the trend in ROS events (indicated by the correlation between the number of ROS events and year) and the correlation of the number of ROS events with air temperature (a), the number of snowpack days (b), and the number of rainfall days (c).Data points correspond to 38 meteorological stations with ROS events occurring in at least 5 a.
Although changes in ROS events were less notably affected by changes in snowpack in snow-rich regions, changes in snowpack may significantly affect ROS events even in snow-rich regions as the global climate continues to warm.This occurred when the number of snowpack and rainfall days decreased with increasing air temperature across the ARNC (Fig.9), and air temperature significantly affected changes in snowpack and rainfall (Fig.10).Therefore, the fact that changes in ROS events in the ARNC are less notably affected by changes in snowpack is a temporary phenomenon.
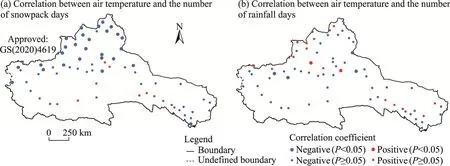
Fig.9 Correlations of air temperature with the number of snowpack days (a) and the number of rainfall days (b)at 68 meteorological stations in the ARNC.Note that the figures are based on the standard map (GS(2020)4619)of the Map Service System (https://bzdt.ch.mnr.gov.cn/), and the standard map has not been modified.

Fig.10 Correlations between the trend in the number of snowpack days (indicated by the correlation between the number of snowpack days and year) and the correlation of air temperature with the number of snowpack days(a) as well as between the trend in the number of rainfall days (indicated by the correlation between the number of rainfall days and year) and the correlation of air temperature with the number of rainfall days (b).Data points correspond to 38 meteorological stations with ROS events occurring in at least 5 a.
3.4 Possible future changes in ROS events in the ARNC
There is a consensus on global warming in academia.Warming leads to changes in regional snowpack and rainfall, which are necessary for the occurrence of ROS events.Therefore, by analysing the changes in the end time of snowpack in spring and the start time of snowpack in autumn as well as the start time of rainfall in spring and the end time of rainfall in autumn in the ARNC during 1978-2015, we could simply predict the possible changes of ROS events in the ARNC in the future, and the results are shown in Figure 11.
In the ARNC, the start time of rainfall and the end time of snowpack gradually advanced from the spring of the current year to the winter of the previous year, while the end time of rainfall and the start time of snowpack gradually delayed from autumn to winter.This change in the start time and end time of rainfall and snowpack suggested that precipitation shifts from snow to rain as the climate warms.Furthermore, while the changes in the start time and end time of snowpack revealed that the snowpack duration decreases, the observed change in snowpack did not significantly affect ROS events.Therefore, more ROS events may occur in winter in the ARNC in the future.This is a response of ROS events to climate change.
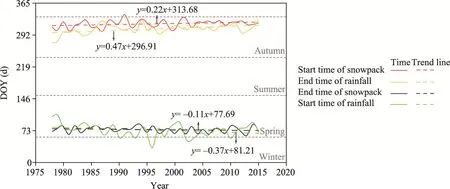
Fig.11 Trends in the start time and end time of rainfall and snowpack in the ARNC from 1978 to 2015.DOY,day of the year.The dotted gray lines in the figure indicate the time boundaries of the four seasons.
4 Discussion
4.1 Spatiotemporal variability of ROS events in the ARNC
Figure 2a shows that ROS events in the ARNC mainly occurred in the Qilian Mountains,Tianshan Mountains, Ili River Valley, Tacheng Prefecture, and Altay Prefecture, which are closely related to the snowpack distribution (Fig.2c).In addition, in northern Xinjiang, the results of this study regarding the spatial distribution of ROS events are generally consistent with those of Lu et al.(2021).The significant effects of air temperature and rainfall and the non-significant effect of snowpack on the spatiotemporal variability of ROS events in the ARNC differ from the analysis results obtained by Zhou et al.(2023).The results of Zhou et al.(2023) suggested that snowpack and rainfall are the main factors affecting ROS events in China.This difference may indicate that the spatiotemporal variability of ROS events is specific to the region, and differences in climate among various regions may lead to different spatiotemporal variations in ROS events and the factors affecting such events.In this study, we analysed the possible future changes of ROS events in the ARNC by considering the changes in the start time and end time of rainfall and snowpack during the year.Although changes in the start time and end time of rainfall and snowpack do not directly indicate future changes of ROS events in the ARNC, rainfall and snowpack provide the necessary conditions for the occurrence of ROS events.Therefore, to a certain extent, the changes in the start time and end time of rainfall and snowpack may influence the spatiotemporal variability of ROS events and affect the spatiotemporal distribution of ROS events in localized areas (Barnett et al., 2005).
However, it should be noted that although the station-based observational data are the most accurate data available, most stations in the ARNC are distributed at relatively lower elevations,and ROS events in some higher elevation (>2000 m) areas could be overlooked.Previous studies have shown that elevation can greatly influence ROS events, with such events occurring more frequently at higher elevations than at lower elevations (McCabe et al., 2007; Musselman et al.,2018; Lu et al., 2021; Zhou et al., 2023).We further explored the effect of elevation on ROS events in the ARNC.As shown in Figure 12, the number of ROS events was negatively correlated with elevation, while the intensity of ROS events was positively correlated with elevation, but none of these correlations were significant.This indicates that the effect of elevation on ROS events in the ARNC is not significant.However, in the ARNC, the number and intensity of ROS events were greater at lower elevations (<2000 m) than those at higher elevations (Fig.12).There are three reasons for this difference.First, the distribution of stations at high elevations in the ARNC is very limited, with most stations distributing below 2000 m, which makes ROS events occurring at high elevations difficult to be counted.Second, the unique topography and climate of the ARNC cause the occurrence of ROS events in this region to differ from that in other regions.Typically, ROS events are more frequent at higher elevations than at lower elevations due to the abundance of snow at higher elevations.However, the Tianshan Mountains in the ARNC and the areas north of the Tianshan Mountains are located in the middle to high elevation regions and contain abundant snow; these regions are among the three major stable snow areas in China (Ke et al., 2016; Tan et al., 2019; Yang et al., 2022), and snow is relatively abundant even in lower elevation areas.ROS events are more likely to occur at lower elevations when snow is equally abundant in both lower and higher elevation areas, because precipitation is more likely to occur in the form of rain at lower elevations when surface snow is abundant.Third, the definition of ROS events also notably influences the study results.When the threshold of the ROS event definition is relatively high, the number of ROS events satisfying the threshold condition is small; however, when the threshold is relatively low, the number of ROS events satisfying the condition includes those with higher thresholds, resulting in a wide spatial distribution (McCabe et al., 2007; Morán-Tejeda et al., 2016;Würzer et al., 2016; Lu et al., 2021; Maina et al., 2023; Zhou et al., 2023).

Fig.12 Impact of elevation on the number of ROS events (a) and the intensity of ROS events (b) in the ARNC
4.2 Limitations and prospects
The limitations of this study mainly stem from the data analysed.The observation data may be the most reliable data available, but across the entire ARNC, the distribution of meteorological stations at high elevations is sparse.This may lead to the underestimation of the number of ROS events at higher elevations, where the abundance of snow provides more opportunities for ROS events to occur.Furthermore, this study only approximately explored the possible factors affecting changes in ROS events in the ARNC.However, the factors affecting the variation in ROS events are complex and diverse.For example, local climate, Arctic Oscillation Index, North Atlantic Oscillation Index, and El Niño-Southern Oscillation can all generate impacts.Therefore,in the future, it is necessary to refine the distribution of ROS events in the high elevation areas of the ARNC with satellite remote sensing data and study the impacts of ROS events on water resources in the ARNC and the underlying disaster-inducing mechanisms.
5 Conclusions
ROS events can accelerate the melting of snowpack, leading to the rapid disappearance of large amounts of snowpack on the surface in a short time period, thus exacerbating water stress in areas where snowmelt is the main source of freshwater, especially in arid regions.Therefore, this study analysed the spatiotemporal variability and driving factors of ROS events in the ARNC from 1978 to 2015 based on daily meteorological data and daily snow depth data from 68 stations, and explored the possible changes of ROS events in the future in the ARNC.The results showed that ROS events in the ARNC were mainly concentrated from October to May of the following year,and occurred mainly in the Qilian Mountains, Tianshan Mountains, Ili River Valley, Tacheng Prefecture, and Altay Prefecture, especially in the Ili River Valley, Tacheng City, and Altay Mountains.The regions with the highest risk of floods caused by ROS events in the ARNC were the Tianshan Mountains, Ili River Valley, Tacheng City, and Altay Mountains.From 1978 to 2015,the number of ROS events in the ARNC tended to increase, which was mainly influenced by air temperature and the number of rainfall days, and the corresponding risk of flooding also increased.Furthermore, In the ARNC, the start time of rainfall and the end time of snowpack gradually advanced from the spring of the current year to the winter of the previous year, while the end time of rainfall and the start time of snowpack gradually delayed from autumn to winter.This change in rainfall and snowpack may lead to more ROS events in winter in the ARNC in the future.This is the response of ROS events to climate change in the ARNC.
This study focused on preliminarily analysing the spatiotemporal variability of ROS events in the ARNC and exploring its causes.In the future, further studies are needed to investigate the impacts of ROS events on water resources in the ARNC and reveal the disaster-causing mechanisms of ROS events in arid regions.
Conflict of interest
The authors declare that they have no known competing financial interests or personal relationships that could have appeared to influence the work reported in this paper.
Acknowledgments
This study was funded by the National Natural Science Foundation of China (42171145, 42171147), the Gansu Provincial Science and Technology Program (22ZD6FA005), and the Key Talent Program of Gansu Province.The authors are very thankful to the anonymous reviewers for improving the paper.
Author contributions
Methodology: CHEN Rensheng; Formal analysis: YANG Zhiwei, ZHAO Yanni, WU Wentong; Writing - original draft preparation: YANG Zhiwei; Writing - review and editing: CHEN Rensheng, LIU Zhangwen, LIU Yiwen;Funding acquisition: CHEN Rensheng, LIU Zhangwen.All authors approved the manuscript.
杂志排行
Journal of Arid Land的其它文章
- Three-dimensional (3D) parametric measurements of individual gravels in the Gobi region using point cloud technique
- Spatiotemporal characteristics of seed rain and soil seed bank of artificial Caragana korshinskii Kom.forest in the Tengger Desert, China
- Afforestation with an age-sequence of Mongolian pine plantation promotes soil microbial residue accumulation in the Horqin Sandy Land, China
- Urban growth scenario projection using heuristic cellular automata in arid areas considering the drought impact
- Effect of coir geotextile and geocell on ephemeral gully erosion in the Mollisol region of Northeast China
- Assessment of runoff changes in the sub-basin of the upper reaches of the Yangtze River basin, China based on multiple methods
