Appreciable Enhancement of Photocatalytic Performance for N-doped SrMoO4via the Vapor-thermal Method
2024-04-10YUNZhiqiangDAIZhenxiangZHULiweiZHENGGanhong
YUN Zhiqiang, DAI Zhenxiang, ZHU Liwei, ZHENG Ganhong
(1.School and Materials Science and Engineering, Anhui University, Hefei 230601, China; 2.School of Physics and Optoelectronics Engineering, Anhui University, Hefei 230601, China)
Abstract: A series of nitrogen-doped SrMoO4 with different Sr/N mole ratio (R=0, 0.05, 0.10, 0.15, 0.20,0.40, and 0.60) were synthesized using urea as the N source via the vapor-thermal method.The photocatalytic degradation ability of all samples was evaluated using methylene blue (MB) as a target contaminant.The band gaps of N-doped samples are all higher than that of pristine ones, which is only 3.12 eV.BET specific surface area SBET and pore volume are increased due to the N doping.And the greater increase of SBET, the faster the photodegradation speed of methylene blue on SrMoO4.More specifically, the degradation efficiency of MB is improved up to 87% in 100 min.
Key words: SrMoO4; photocatalytic property; nitrogen element doping
1 Introduction
Environmental purification is attracting more and more attention due to its far-reaching effect on sustainable development, and utilizing solar energy with semiconductor catalysts is considered to be an effective technique.The scheelite-structured molybdates possess some attractive properties and good application prospects, therefore, they have been extensively studied in recent years[1].Previously,SrMoO4was mainly studied by researchers as luminescent material[2].In 2009 Jinhong Bi and Ling Wu found out that PbMoO4exhibit good photocatalytic degradation performance under ultraviolet light irradiation.However, PbMoO4photocatalyst behaves poor photocatalytic degradation performance under visible light due to large band gaps[3].This band gap of PbMoO4is very close to that of TiO2[4].SrMoO4also belongs to the scheelite-structured molybdates family,and it shares some similarities with PbMoO4[5].For this reason, it can infer that SrMoO4may exhibit better photocatalytic properties once its band gap narrows[6].Doping rare earth elements, metallic elements and non-metallic elements are commonly used to narrow the intrinsic band gap of photocatalyst.Previous investigations were rarely focused on photocatalytic performance of doped SrMoO4.In fact, Jingying Luoet alsuccessfully synthesized Fe-doped SrMoO4in 2019[7], and investigated that the intrinsic band gap of SrMoO4is significantly reduced to 2.93 eV, and the light absorption extended to visible light region
Significant research has focused on further improving the photocatalytic performance of SrMoO4in our previous work.For example, using thermal decomposition of a metal-organic salt in the organic solvent, the well-dispersed uniform SrMoO4nanocrystals were obtained, and the photodegradaiton of methyl blue over SrMoO4sample reaches nearly 100% in 120 min[8].Doping certain Dy into SrMoO4sample, the best performance for photocatalytic degradation of methyl blue of nearly 100% in 120 min under visible irradiation[9]can be obtained.Recently,N-doping has also been proven to be a most effective strategy for enabling TiO2visible-light photocatalytic response[10].As we known, the vapor-thermal method is famous for heating the precursor solution rapidly and uniformaly, and can effectively controls the reaction rate[11].To investigate the influence of non-metallic elements doping on SrMoO4, we synthesized a series of N-doped SrMoO4.In this work, SrMoO4nanoparticles were first synthesized, and then the N doping was carried out in water vapor environment at 180 ℃ using vapor-thermal method.
2 Experimental
SrMoO4was synthesized by a simple hydrothermal method.A certain of Sr (NO3)2and (NH4)6Mo7O24·4H2O were disluted and mixed with stirring.Meanwhile, NaOH solution is used to adjust the pH value to 7 for the mixed solution.Then, the mixture was then transferred to a 1 000 mL Hastelloy autoclave(Parr 4500, USA).The autoclave was heated to 120 ℃for 6 h.The resulting precipitates were then washed repeatedly with absolute ethanol to remove the organic residual and dried at 60 ℃.
The obtained SrMoO4was mixed with 100 mL of deionized water under continous ultrasonication for 10 min.A certain amout of urea was added to the mixture according to the N/Ti molar ratio (RN/Sr)=0.05, 0.10,0.15, 0.20, 0.40, and 0.60, respectively.Following 20 min of ultrasonication, the mixture was transferred to a quartz-goblet and placed inside a 1 000 mL Hastelloy autoclave filled with 150 mL of deionized water.The autoclave was heated to 250 ℃ for 12 h.The obtained products were rinsed 3-4 times with deionized water followed by drying at 60 ℃, and named as N0.05,N0.1, N0.15, N0.2, N0.4, and N0.6, respectively,according toRN/Sr.

Fig.1 Schematic diagram of quartz cup placement
The crystal structure of the samples was investigated by X-ray diffraction (XRD) using an X-ray diffractometer (SmartLab 9 kW, Rigaku Industrial Corporation, Osaka, Japan) with Cu Kα radiation (λ=1.540 6 Å) in the scanning range 10-80° and with a step size of 0.02°.Samples morphologies were observed by transmission electron microscopy (TEM;JEM-2100, JEOL, Tokyo, Japan).The ultravioletvisible diffuse reflectance spectra (UV-vis DRS)of samples were tested on a Shimadazu U-4100 spectrometer (U-4100, Shimadazu Corporation, Tokyo,Japan).X-ray photoelectron spectroscopy (XPS) was performed using a Thermo Scientific ESCALAB 250Xi(Thermo Scientific Inc., USA).The Brunauer–Emmett–Teller (BET) specific surface areas were calculated based on N2adsorption and desorption isotherms measured at 77 K using the gas adsorption apparatus(Autosorb-iQ, Quantachrome Instruments, USA).
The photocatalytic property of N-doped SrMoO4was assessed based on the degradation of methylene blue using a 350 W Xe lamp as illumination.40 mg of photocatalyst sample and 80 mL of methylene blue solution were added in a test tube in each experiment.Before illumination, the mixed solutions were magnetically stirred in the darkroom for 30 min to ensure the adsorption-desorption equilibrium between the SrMoO4sample and MB solution is established.After light irradiation, a sample of the solution was extracted every 10 min.Following high-speed centrifugation, the concentration of MB was analyzed by a UV-Vis spectrometer ( UV-3200S, MAPADA,Shanghai, China) and calculated using a calibration curve.
3 Results and discussion
3.1 Structural properties
Fig.2 porvides the X-ray diffrcation (XRD)patterns for the N0.2, N0.4 and N0.6 samples at room temperature.The diffraction data reveal that these samples are single phase.All these XRD patterns can be well indexed as scheeltie tetragonal structure (I41/a space group), which are in good agreement with the values of the standard card (JCPDS 08-0482).

Fig.2 XRD patterns for N0.2, N0.4 and N0.6 samples
The diffraction peaks are carefully indexed and assigned to the lattice planes of (112), (004),(200), (204), (220), (116), (312), and (316) for the corresponding 2θvalues of 27.56, 29.56, 33.14, 44.96,47.52, 51.26, 55.80, and 72.56, respectively[12].It is obvious that introducing N element does not alter the crystal structure of the SrMoO4sample.
3.2 Morphology
Figs.3(a)-3(d) show the SEM micrographs of pure phase SrMoO4at different magnifications, and Fig.3(a) and Fig.3(b) show that the samples are in wool ball shape.Fig.3(c) and Fig.3(d) show that the sample is formed by a large number of nanoflakes stacked on the top of each other.Figs.3(e)-3(h) show the SEM micrographs of N0.2 at different magnifications, and it can be seen that the doping does not change the sample morphology.

Fig.3 SEM images of samples N0 (a-d) ; N0.2 (e-h)
3.3 X-ray photoelectron spectromoter analysis
XPS measurements were carried out in order to expound the surface electronic states and the surface elemental composition.The measurement results are shown in Fig.4.The XPS spectrum of pure phase SrMoO4is shown in Fig.4(a).There are five kinds of elements peaks in the spectrum, which are Sr, Mo, N,O and C elements.The peak at 284.9 eV comes from the instrument and should be used as the calibration peak for the XPS analysis.The multiple peaks fitting results of N0 samples are shown.The high-resolution Sr 3d spectrum is fitted with two peaks at 133.35 and 135.08 eV, which represents the energy level of Sr 3d5/2and Sr 3d3/2.Similarly, the high-resolution Mo 3d spectrum is fitted into two peaks at 232.68 and 235.84 eV, which represents the energy level of Mo 3d5/2and Mo 3d3/2.As for O 1s, the spectrum is fitted into three different peaks at 530.29, 531.12 and 532.84 eV[7].The peak at 530.29 eV is produced by lattice oxygen (OL)[13]within the perovskite structure, and the second peak at 531.12 eV is attributed to surface hydroxyl species(·OOH), and the third peak at 532.84 eV is related to the adsorbed water (H2O).
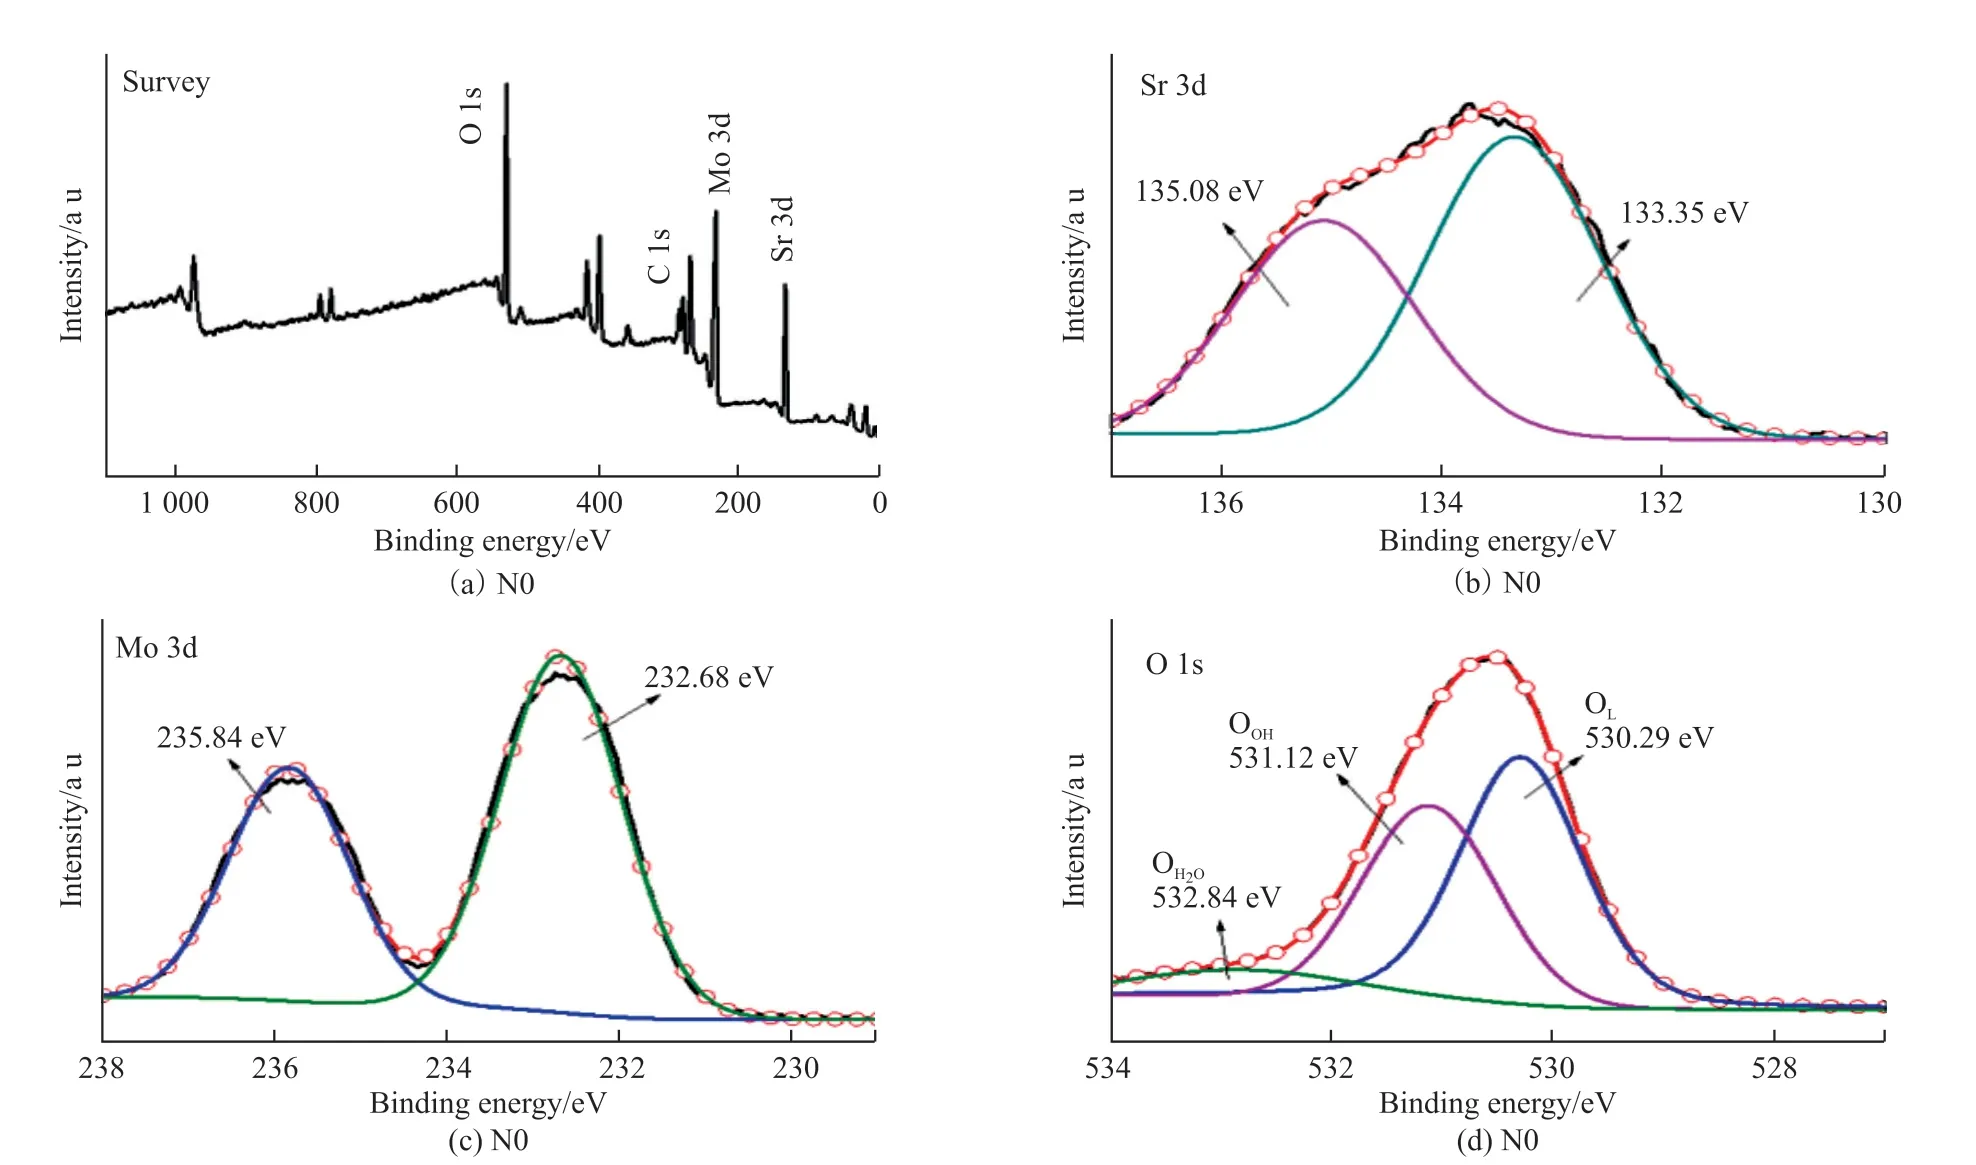
Fig.4 XPS patterns for N0 sample: (a) Survey; (b) Sr 3d; (c) Mo3d; (d) O 1s
XPS measurements of the Mo 3d, O 1s and N1s core level for the other doped samples are also carried out in order to study the divergence of the element valence state with nitrogen doping.The obtained results are exhibited in Fig.5 and Fig.6.Fig.5 (ai) contains Mo 3d, O 1s and N 1s spectra of N0.05,N0.10 and N0.15 samples.For Mo 3d, the doped N0.05 sample can be de-convoluted into five peaks at binding energies (EB) of 231.92, 232.58, 232.91, 234.98, and 235.84 eV, which are originated from Mo4+, Mo5+and Mo6+.The Mo6+binding energy peaks are at 232.58 and 235.84 eV.The doping leads to the emergence of Mo4+and Mo5+binding energy levels.There is one Mo4+energy level peak at 232.91 eV, and two Mo5+energy level peaks at 231.92 and 234.98 eV.Besides,the proportions of the Mo4+, Mo5+and Mo6+ions are calculated as 19.91%, 16.6% and 63.48%, respectively.

Fig.5 XPS spectra of N0.05, N0.10 and N0.15 samples: (a-c) Mo 3d; (d-f) O 1s; (g-i) N 1s

Fig.6 XPS spectra of N0.20, N0.40 and N0.60 samples: (a-c) Mo 3d; (d-f) O 1s; (g-i) N 1s
Fig.5 (d-f) shows the O 1s core level fitted spectra for N0.05, N0.10 and N0.15 samples, respectively.The spectra are also fitted into these above peaks, which are assigned to the lattice oxygen (OL) within the perovskite structure, the surface hydroxyl species (·OOH), and the adsorbed water (H2O) as mentioned before.For N0.05 sample, the lattice oxygen (OL) peak is at 530.10 eV, and the surface hydroxyl species (·OOH) and the adsorbed water (H2O) peaks are at 531.06 and 531.22 eV, respectively.Also, the proportion of OL, ·OOH and H2O are 50.50%, 29.02% and 20.47%, respectively.Fig.5 (g-i) exhibits the N 1s spectra of N0.05, N0.10 and N0.15.The spectra are also deconvoluted into three peaks, which are assigned to the Sr-N bond, N-O bond and N-N bond, respectively[14].For the N0.05 sample,the peaks are at 396.03 (Sr-N), 398.26 (N-O) and 399.82 eV (N-N).The calculated result shows that the proportions of the Sr-N bond, N-O bond and N-N bond are 8.54%, 67.14% and 24.32%.
Changes in the chemical state of elements induced by N-doping are as follows: N-doping induces the change of the chemical state of Mo element, and there exist Mo4+, Mo5+and Mo6+ions in N-doped SrMoO4sample.The change of Mo value suggests that a certain of N elemennt enters the interstitial sites of SrMoO4lattice and replaces O atom in SrMoO4lattice in the reducing or anaerobuc condition.
3.4 BET analysis
The nitrogen-absorption-desorption curves of N0, N0.15, N0.2 and N0.4 samples are shown in Fig.7.The result shows typical hysteresis loop with relative pressure for all samples, which means the porosity is uneven.The specific surface area of these samples are 50.708, 49.439, 75.223 and 57.250 m2/g.Also,the average pore diameter of these samples are 4.42,4.63, 5.86 and 6.08 nm.With increasing N content,the average pore diameter increases.Larger specific surface area often results in stronger adsorption, which is favorable for photocatalysis.
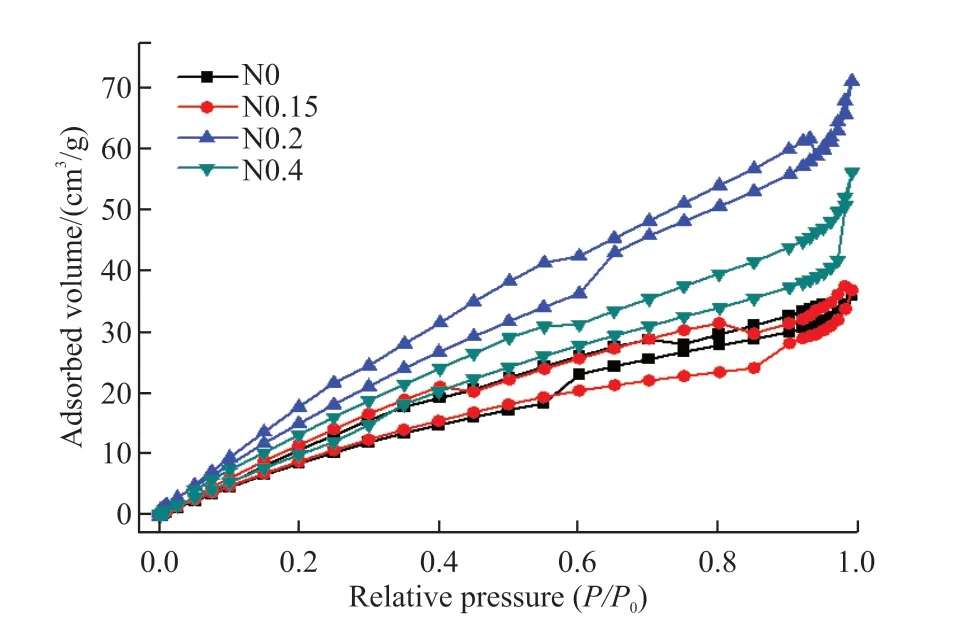
Fig.7 BET absorption-desorption curves for N0, N0.15, N0.2 and N0.4 samples
3.5 UV-vis absorption spectrum analysis and band gap fitting results
UV-vis absorption spectra in the range of 200 to 800 nm of all samples are shown in Fig.8.It is obvious that there is a strong absorption in the range of 200-300 nm, and it is actually related to a charge transfer phenomenon.In the MoO42-ion cluster, electrons are transferred from the oxygen(2p) to the central molybdenum atom[15].In the range of 200-300 nm,compared to the pure phase SrMoO4, the absorption of N0.15, N0.20, N0.40 and N0.60 samples are enhanced,while the absorption of N0.05 and N0.10 samples are reduced.
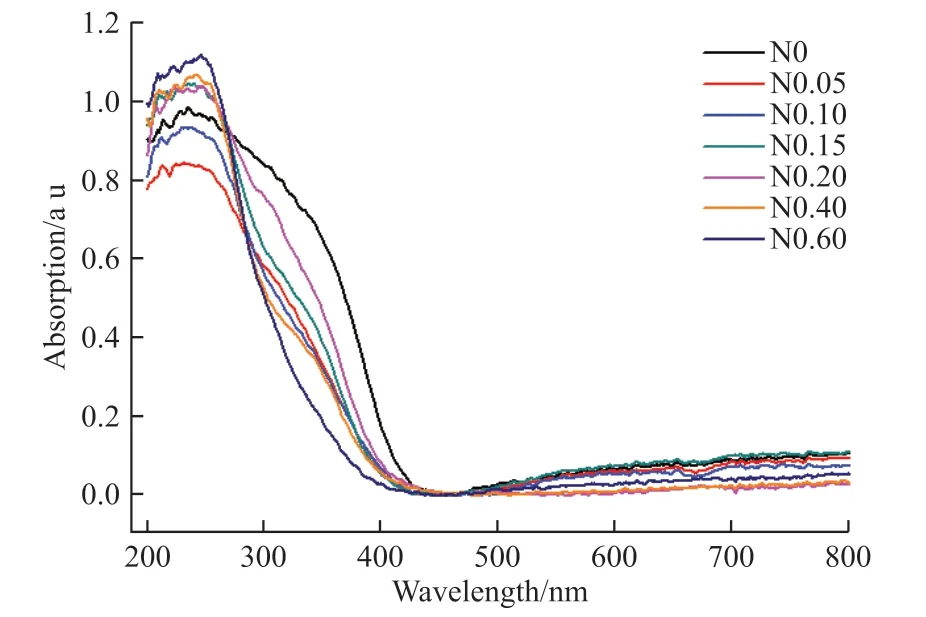
Fig.8 UV-vis spectra for all samples
For N0.05 and N0.10 samples,the population density of the isolated (N 2p) and/or hybrid orbitals(with O 2p) is probably not sufficient to induce a total red-shift of photocatalyst absorption into the visible part of the spectrum[16].However, with increasing N-doping content, the visible light absorption is strongly related to the appearance of the new phase SrMo(O,N)3, as discussed in the XRD part, and as a result, the absorption of visible light is enhanced with N-doping.
A possible origin for absorption enhancement could be because N-doping can enhance the visible light absorption by acting as a photosensitizer.Additionally, oxoygen vancancies in SrMoO4usually cause a “tail” absorption in the visible region[17].The absorption of the N-doped SrMoO4are weakened in the range of 300-400 nm, which indicates that the nitrogen doping may leads to band gap broadening.

Fig.9 The fitted (αhν)2 to hν curve for N0, N0.15, N0.2 and N0.4 samples
According to previous study, the absorption is relevant to energy gap resulting from intrinsic transition.Thus, a calculation method proposed by Wood and Tauc should be applied to calculate the optical band gap[18].The optical band gap is associated with the absorbance and the photo energy by the following equation:αhν=A(hν-Eg)n.
In this equation,α,h,ν,EgandArepersent absorption coefficient, Plank constant, photo frequency,energy gap and a constant, respectively.Constantnis correlatived with the different types of electronic transitions.Generally,ntakes the value of 1/2, 2,3/2 or 3 for a directly allowed, indirectly allowed,directly forbidden and indirectly forbidden transition.According to Lacomba-Peraleset al, SrMoO4belongs to the molybdates family with scheelite-type tetragonal structure, and its electronic transition type is directly allowed.Therefore, in the present study,ntakes 1/2 as the standard value[19].Under the circumstance ofn=1/2,theEgvalues are determined by extrapolating the linear portion of the plot (αhν)2vs hνto zero absorbance.Thus, after fitting, the calculatedEgvalue of N0, N0.05,N0.10, N0.15, N0.20, N0.40 and N0.60 samples are 3.12, 3.74, 3.92, 3.96, 3.75, 4.10 and 4.14 eV.
3.6 Photocatalytic properties
To objectively evaluate the photocatalytic performance of the N-doped SrMoO4, methylene blue(MB) is selected as the ideal organic pollutant.The photocatalytic degradation of MB solution under UVvisible light irradiation can reflect the photocatalytic performance of the catalyst.Fig.10 shows the evolution of MB solution UV-vis spectrum curves, and the figure consists of 11 different curves representing different time intervals.This specific figure only shows one circle of MB solution degraded by sample N0.2.By recording the decrease of absorption intensity at about 664 nm, the temporary concentration of MB solution(C/C0) is measured.CandC0are the concentration at certain time and the initial concentration, respectively.It is observed that as irradiation time grew, the main peak gradually shifted from 664 nm to a shorter wavelength, and its absorption intensity decrease too.In addition, throughout the irradiation time, no new absorption peaks is obeserved, which means no reaction intermediates were formed.

Fig.10 Absorption spectra of methyl blue with irradiation time over N0 sample
Fig.11 shows the variation of the MB solution concentration with irradiation time.After being irradiated for 100 min, the temporary concentration of MB solution had lower to 43%, 30%, 31%, 23%, 16%,19% and 24% for the N0, N0.05, N0.10, N0.15, N0.20,N0.40 and N0.60 samples, respectively.Although the N0 sample has the lowestEgvalue, it is obvious that the photocatalytic performance of pure phase SrMoO4is low, while the N0.2 sample is the best-performing one.In addition, the graph also shows that the adsorption capacity of N0.2 and N0.4 samples are better than the others.As for the decomposition of 0.2 and 0.4 samples before irradiation, it may be attributed to the adsorption of methylene blue samples and the degradation of methylene blue itself.As can be seen from Fig.7,BET values of the two samples are larger than those of the rest.Therefore, combining the aforementioned BET analysis, it can infer that bigger specific surface area and longer average pore diameter often lead to better photoccatalytic properties.To sum up, our study clearly shows that doping nitrogen element is a feasible method to enhance the photocatalytic properties of strontium molybdate.

Fig.11 Plots of C/C0 versus the irradiation time for methyl blue
The first-order dynamics fitting diagram of all samples are shown in Fig.12.Dynamic constantκis assigned to degradation rate, and it is calculated by a pseudo-first-order rate equation: ln(C/C0)=κt.In this equation,CandC0are the concentrations of the MB solutions at irradiation times of 0 andt, respectively.As exhibited in Fig.12, the graph between ln(C/C0)andtpresents a good linear fit.This indicates that the photodegradation process of methylene blue can be classified as quasi first-order kinetic reaction.The constantsκof N0-N0.6 samples are 0.81, 1.16, 1.18,1.46, 1.77, 1.62 and 1.41×10⁻²min-1, respectively,which increased firstly for N0, N0.05, N0.10, N0.15,N0.20 and then decreased for N0.40 and N0.60.Theκof N0.2 was the largest and the photocatalytic performance is the largest.Therefore, the results show thatκis determined by the separation of the photogenerated electron-hole pairs.
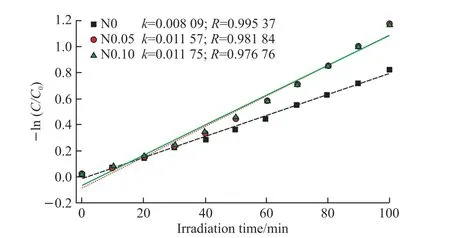
Fig.12 Pseudo first order kinetic fitting datas for the photodegradation of methyl blue
The photocatalytic performance of N-doped samples was weakened compared to that of the N-free sample N0.As we known, the photocatalytic performance was determined by the spectral response range and photo-generated carriers.With N-doping, the band gap is enhanced and the light absorption range is narrowed.Therefore, the photocatalytic performance was not improved.It is still a challenging work to provide direct experimental evidence to elucidate the underlying mechanisms.
To investigate the possible photocatalytic mechanism of SrMoO4samples, Fig.13 is given to illustrate the plausible electron transfer and degradation machanism of MB solution over SrMoO4photocatalyst.Due to the narrowEg, the photoelectrons in the valence band composed of O 1s orbital are excited to the conduction band of Mo 3d orbital, resulting that a number of holes are produced in the valence band.After the transition to conduction band, the photogenerated electrons then react with oxygen and produce O2-radical ions with photosensitization.At the same time, the holes react with water and produce hydroxyl radical ·OH.The MB solution reacts with O2-and ·OH to generate CO2and H2O, hence get dagraded.The reaction formulas are as follow:
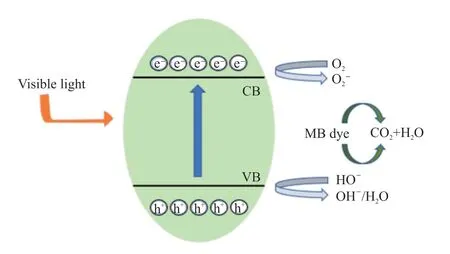
Fig.13 Schematic diagram of charge carrier transfer process and possible photocatalytic mechanism of SrMoO4
4 Conclusions
In this current research, the N-doped SrMoO4samples are successfully synthesized, and the relationship between the doping amount and the photocatalytic properties of the samples is further studied.The results suggest that the XRD diffraction patterns of N-doped samples are in fine agreement with the pure phase SrMoO4reference card, which indicates that the formation of scheelite-type tetragonal structure and the crystal structure does not change.The UV-vis analysis and fitting results also suggest that the band gaps are expanded after doping, which varies from 3.76 to 4.16 eV.The photo-degradation efficiency of the samples is being studied by observing the concentration change of MB solution under visible ray irradiation.It is proved that nitrogen-doping is able to enhace photocatalytic activity of SrMoO4photocatalyst.
Conflict of interest
All authors declare that there are no competing interests.
杂志排行
Journal of Wuhan University of Technology(Materials Science Edition)的其它文章
- Effect of VEGF/GREDVY Modified Surface on Vascular Cells Behavior
- Evolution of Biofilm and Its Effect on Microstructure of Mortar Surfaces in Simulated Seawater
- Synthesis of Organic-Inorganic Hybrid Aluminum Hypophosphite Microspheres Flame Retardant and Its Flame Retardant Research on Thermoplastic Polyurethane
- Surface Metallization of Glass Fiber (GF) /Polyetheretherketone (PEEK) Composite with Cu Coatings Deposited by Magnetron Sputtering and Electroplating
- Effect of Size Change on Mechanical Properties ofMonolayer Arsenene
- Effects of Sinusoidal Vibration of Crystallization Roller on Composite Microstructure of Ti/Al Laminated Composites by Twin-Roll Casting
