Numerical Simulation of the Settling Flux of Biodeposition in a Bay with Cage Culture Through Similarity Theory and a Simplified Pollution Source
2024-03-12LIUYaoCHENYifanandGEChangzi
LIU Yao, CHEN Yifan, and GE Changzi
Marine College, Shandong University, Weihai 264209, China
Abstract The settling flux of biodeposition affects the environmental quality of cage culture areas and determines their environmental carrying capacity. Simple and effective simulation of the settling flux of biodeposition is extremely important for determining the spatial distribution of biodeposition. Theoretically, biodeposition in cage culture areas without specific emission rules can be simplified as point source pollution. Fluent is a fluid simulation software that can simulate the dispersion of particulate matter simply and efficiently. Based on the simplification of pollution sources and bays, the settling flux of biodeposition can be easily and effectively simulated by Fluent fluid software. In the present work, the feasibility of this method was evaluated by simulation of the settling flux of biodeposition in Maniao Bay, Hainan Province, China, and 20 sampling sites were selected for determining the settling fluxes. At sampling sites P1, P2, P3, P4, P5, Z1, Z2, Z3, Z4, A1, A2, A3, A4, B1, B2, C1, C2, C3 and C4, the measured settling fluxes of biodeposition were 26.02, 15.78, 10.77, 58.16, 6.57, 72.17, 12.37, 12.11, 106.64, 150.96, 22.59, 11.41, 18.03, 7.90, 19.23,7.06, 11.84, 5.19 and 2.57 g d−1 m−2, respectively. The simulated settling fluxes of biodeposition at the corresponding sites were 16.03,23.98, 8.87, 46.90, 4.52, 104.77, 16.03, 8.35, 180.83, 213.06, 39.10, 17.47, 20.98, 9.78, 23.25, 7.84, 15.90, 6.06 and 1.65 g d−1 m−2,respectively. There was a positive correlation between the simulated settling fluxes and measured ones (R = 0.94, P = 2.22×10⁻⁹ <0.05), which implies that the spatial differentiation of biodeposition flux was well simulated. Moreover, the posterior difference ratio of the simulation was 0.38, and the small error probability was 0.94, which means that the simulated results reached an acceptable level from the perspective of relative error. Thus, if nonpoint source pollution is simplified to point source pollution and open waters are simplified based on similarity theory, the setting flux of biodeposition in the open waters can be simply and effectively simulated by the fluid simulation software Fluent.
Key words fluent fluid simulation software; pollution source simplification; posterior difference ratio; similarity theory; Spearman correlation
1 Introduction
Cage culture is one of the main breeding modes for fin fish culture, which produces many residual baits and fish feces (Gaoet al., 2008). Biodeposition, such as fish feces,is the most important endogenous organic load for cage culture areas and their adjacent waters (Lapenkovet al., 2023).Massive accumulation in sediments leads to a decrease in dissolved oxygen concentration (Holmeret al., 2003), an increase in nutrients and volatile sulfide contents (Choiet al.,2022; Duet al., 2022), and benthic community succession(Geet al., 2022). Thus, the diffusion and settlement of biodeposition affect the environmental quality of the cage culture area and its adjacent waters and determine the carrying capacity of the cage culture area (Weiseet al., 2009). The settling flux of particulate matter is generally studied by field investigations (Huanget al., 2020) and hydrodynamic models (Wanget al., 2021). The field investigation is based on the determination of settling flux at different locations(Wanget al., 2018), and then the distribution of settling flux is determined. Nevertheless, it is difficult to predict the settling flux and its spatial distribution. Hydrodynamic models can effectively predict the flux, but the construction of hydrodynamic models needs to create equations that accurately describe the movement of particles, which is not easy to accurately describe. Thus it is necessary to propose a simple method to predict the settling flux of biodeposition in cage culture areas.
The physical model is a simulation method that reduces the prototype to a model in a certain scale relationship, and then applies the load associated with the prototype to the model, which can minimize the element of uncertainty.Without clarifying the occurrence process of the simulated object, it scales all the changes in the engineering prototype by using a similar principle, during which the boundary conditions corresponding to the transformation are set (Wei,2001; Yang, 2005). All these processes are based on similarity theory, during which the simulated models and protypes are similar in terms of geometry, kinematics and dynamics. Fluent, a fluid simulation software, is widely used to simulate the diffusion of particulate matter (Aiet al.,2020). Based on the physical model and Fluent, it should be easy to simulate the settling flux of biodeposition (Song,2022; Jianget al., 2023). Moreover, in cage culture areas,biodeposition is nonpoint source pollution without specific release rules, and its simplification will theoretically reduce the difficulty of simulation. Nevertheless, it is seldom to simulate the settling flux of particulate matter based on a combination of similarity theory and pollution source simplification.
The present work takes the simulation of the settling flux of biodeposition in Maniao Bay as an example to study the feasibility of this method. It simulates the settling flux of biodeposition in one bay used for cage culture through similarity theory and a simplified pollution source. It can provide a reference for the development of a simpler and more feasible simulation technology for forecasting the settling flux of particulate matter in open waters.
2 Materials and Methods
2.1 Simplification Principle of Water Area
One of the basic dynamics of particulate matter diffusion in fluid is fluid motion, and the motion of fluid and particulate matter can be described as equations for unsteady incompressible fluid motion and equations for particulate matter motion, respectively (Liu and Liu, 2016).
whereρl, ul, andμlare the liquid density (kg m−3), liquid speed (m s−1) and liquid dynamic viscosity coefficient (N.S m−2), respectively.
If only considering the force caused by the relative motion of solid-liquid phases and ignoring the influence of gravity, buoyancy, velocity gradient and pressure gradient, the equation of motion of spherical solid particles is expressed as Eq. (3) (Cenet al., 1987; Liu and Cheng, 1992; Jiang,1993; Jianget al., 2018).
whereds, ρs, CD, usandur(ur=ul−us) are the particulate matter diameter (m), density of particulate matter (kg m−3),resistance coefficient, particulate matter speed (m s−1) and relative speed of solid and liquid, respectively.
In Eqs. (1) and (3), there are 10 physical quantities, and their basic physical dimensions include length (L), mass(M) and time (T). Based on the dimensional analysis ofπtheorem (Wei, 2001; Yang, 2005), the number of similarity criteria for the movement of solid particles in fluid must follow 7 independent similarity criteria, such as
The dimension of both sides ofπ1is
The single-value conditions that distinguish this process from other processes mainly include similar geometric conditionsL, the size of particlel, while the physical property parameters and the liquid velocity distribution of inlet and outlet should be satisfied. Moreover, the liquid velocity distribution depends on the fluid Reynolds number(Re) and the relative wall roughness (∆/D). Considering the existence of nonqualitative criteria (Eu) and granular Renault criteriathat can be derived from equationsandds/l, there are nine similar criteria to determine the distribution of biodeposition,such asStk,D/L, ∆/DandRes.
It is difficult to ensure that all the criteria numbers are equal; thus, these criteria should be simplified to simulate biodeposition diffusion in one bay. In a stable flow field,the time-homogeneity criterion (H0) can be ignored. If the solid particles of the model and the prototype are the same,the similar criteria ofρs/ρlcan be satisfied. If the particles accelerate in a short time, the relative velocity of the solid and the liquid is negligible,i.e., there is a relationship,us/ul≈ 1. If the particles are small, the ratio of the inertial force to gravity is negligible,i.e., the similarity criterion (Fr) is negligible. If the fluid Reynolds number of the prototype and the model are in the same self-modeling region, Reis not considered.
Based on these simplification principles, if the fluid Reynolds number (Re) is in the self-model zone, the local similarity or similarity ofStk, Res, ∆/DandD/Lcan be realized (Jiang, 1993; Jianget al., 2018). Moreover, the latter two criteria can be satisfied if the relative roughness and geometric proportion are equal. Thus, the following steps are used to solve the problems of model test physical parameters, geometric dimensions, and initial conditions.
1) Because (Stk)m= (Stk)oand (Res)m= (Res)o, there are additional or unqualitative guidelines (Aa),
where the subscriptsm, o, sandlindicate the model, prototype, solid and liquid parameters, respectively. For example,lois the feature length of the geometric dimensions of the experimental prototype.
Based on Eqs. (3) and (4), there is
In the present work, there is an additional criterion,
Ifρsm=ρso, there is a relation,
Ifρlm=ρlo, there is a relation,
Ifρsm=ρso, ρlm=ρlo, the relation can be obtained,
2) The flow speed for the model () can be derived through the Reynolds number similarity criterion,
3) Validation: According to the distribution range of the model and the prototype Reynolds number, judge whether the two models are in the same self-model area (Zheng and Lu, 1980).
2.2 Simplified Principle of Self-Pollution of Cage Culture
According to the basic principle of pollution source simplification, the biodeposition production caused by cage culture is regarded as a regular point source emission. Moreover, the discharge position of biodeposition is the center of the cage culture area, while the discharge of pollutants remains unchanged, and the discharge time is simplified from continuous discharge to one-time discharge of the total emission within 48 h.
2.3 Application of Similarity Theory and Pollution Source Simplification in Maniao Bay
Maniao Bay is a cage culture base in Hainan Province,which is famous for cage culture in China. It covers a water area of 26.2 km2and has irregular half-day tides. The average tidal range is 1.7 m, and the maximum tidal range is 3.2 m. The average water depth is 8.1 m, and the depth of the outside of the bay is 20 m. Moreover, the current speedin theinlet with a cross-sectional area of 8622.4 m2is 0.75 m s−1. Considering the seasonal distribution of temperature in Hainan Province, 25℃ was regarded as the normal temperature in the study area. Under such temperature, the density of sea water (ρlo) and the dynamic viscosity coefficient of seawater (μlo) are 1025 kg m−3and 0.8973×10⁻³N S m−2, respectively (Chen, 2018).
2.3.1 Simplified physical model of Maniao Bay
In the simulated model, the width of the bay mouth and the longitudinal length of the bay were reduced to 1/10 of their real sizes. The bay has clear depth boundaries, and cage culture was carried out in waters with a depth of > 4 m. Thus, the bay was divided into two areas along the isometric line with a depth of 4 m to construct the simulation model. Moreover, the key model parameters were determined as follows. Ifρsm/ρso= 1 andρlm/ρlo= 1, there was a relation,Aa=ds/land the diameter of the simulated particulate (dsm) was calculated as
Thus, the simulated current speed () was calculated as
The particle Reynolds number of the prototype (Rem) was calculated as 856.73. Moreover,
were calculated as 1.275 × 10⁸and 1.350 × 10⁷, respectively.DoandDmwere the equivalent diameter of inlet cross section of the prototype and model tests respectively, which was calculated asD =4 × (a×b) /2 × (a+b)=2a×b/(a+b),wherea, bwere the length and width of the rectangle respectively. Furthermore,DmandDowere calculated as 14.89 m and 15.88 m, respectively.
All these factors mean thatRemandReowere in the same self-model region. Thus, the geometric parameters, physiccal parameters and initial conditions of the simulated Maniao Bay were as follows: simulated current speed of inlet was 7.5 m s−1, water depth was 8 m, area size was 862.24 m2,width was 107.78 m, and equivalent diameter was 14.89 m.Based on these parameters, the geometric model of Maniao Bay (Fig.1) was constructed using Fluent software.Because the geometric model is too large and biased to a thin plate body, a hexahedron that adapts to the flow field,boundary layer processing, grid number, and solution accuracy was set, an expansion layer (Fig.2) in the inlet and outlet surface was added, and the final number of grids was 2276381 (Fig.3).

Fig.1 Top view of the geometric model of Maniao Bay. During a tidal cycle, the left and right sides of the bay alternate as inlets and outlets.
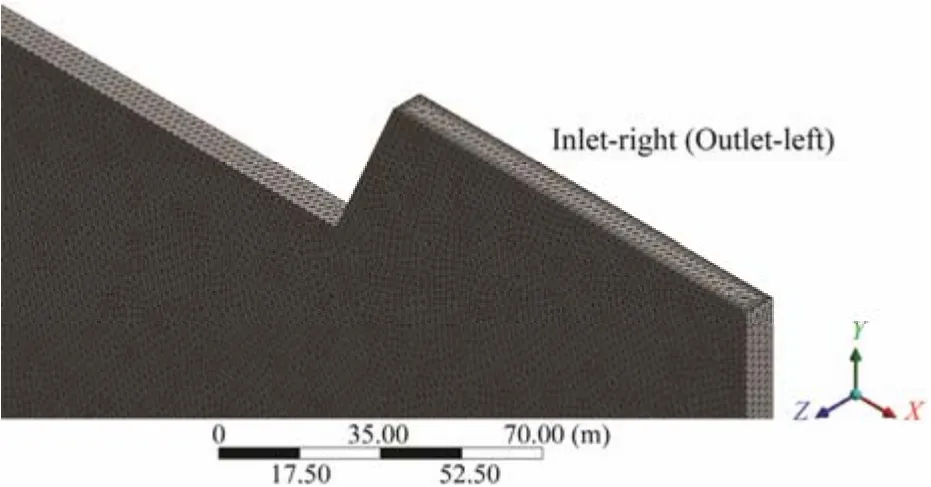
Fig.2 Expansion layer of the geometric model for Maniao Bay.

Fig.3 Top view of the grid division in the geometric model for Maniao Bay.
The water inlet boundary was set as the velocity inlet type. The flow state was turbulent because the Reynolds number was 1.258 × 10⁸, and the turbulence intensity was set as 2%. The outlet was set as the free outflow boundary.The influence of biodeposition gravity was considered, so the gravity option was checked during the simulation. Moreover, the turbulence model was selected ask-ωShear Stress Transport (SST) mode. SST turbulence model usesk-ωmodel near the wall to capture the flow of the viscous bottom layer and usesk-εmodel in outer boundary layer and free shear ask-ωmodel is too sensitive to inlet turbulence parameters. The effect of Reynolds shear stress transport is introduced by Bradshaw hypothesis. SST turbulence model is one of the best comprehensive performances and most widely used eddy viscosity models (Zenget al., 2023).When these equations were discrete, the velocity-pressure coupling was calculated by the simple algorithm. Discrete pressure was performed in a standard format, the rest was conducted by the second-order windward format, and the residual convergence criteria were kept as the default 10−3.
The tide type in Maniao Bay is irregular half-day tide,and the tide direction changes twice a day, during which the tide direction is from east to west and then from west to east, and the time ratio of the two directions is 3:1. During simulation, the change in tide direction was represented by different inlets and outlets.
2.3.2 Simplification of self-pollution caused by cage culture in Maniao Bay
There was a large wind-wave resistant cage culture zone with an annual production of 751 t and a raft cage culture zone with an annual production of 50 t in the bay. All these cage areas were presented by sampling sites P1, P2, P3,P4, P5, Z1, Z2, Z3 and Z4 (Fig.4). Moreover, the simulated pollutant discharge point was the center of the cage culture area, X (Fig.5).

Fig.4 Distribution of cage culture area and sampling sites for biodeposition settling flux (P1 – P5, Z1 – Z4, A1 – A3,B1 – B3 and C1 – C3 are sampling sites).

Fig.5 Center position of the cage culture area in Maniao Bay (X indicates the pollution discharge point).
The measured densities of feces and residual bait were similar, which were 1150 and 1127 kg m–3, respectively. Generally, circular spherical particles, instead of irregular particles, are used in simulations (Chen, 2007). Thus, biodeposition was simulated as circular spherical solid particles with an equivalent diameter of 0.1 cm and a density of 1200 kg m–3. Based on the field investigation, in April, May and June of 2021, the number of fries released in the bay was 5200000, 600000 and 100000, respectively. These fries grew to 500 g within 4 months. Moreover, the amount of residual bait was approximately 10% of the amount of feed bait delivered on the same day (Liu and Chen, 2009), and the measured feces discharge rate of cultured fish was 0.1083%. Thus, the amounts of feces and residual bait produced by cultured fish from June 6 to 8, 2021 were 2439.65 and 98 kg, respectively.
2.3.3 Validation of numerical simulations of settling fluxes of biodeposition
Sampling sites such as P1, P2, P 2, P3, P4, P5, Z1, Z2,Z3, Z4, A1, A2, A3, A4, B1, B2, C1, C2, C3 and C4 were set in the bay to measure the settling flux of biodeposition(Fig.4). From June 6 to 8, 2021, the sediment traps were hung for 48 h by the method of Ge and Fang (2006) to obtain the settling flux of biodeposition (f), while the particulate matter was dried to constant weight at 65℃, and the dried particulate matter was burned at 105℃ for 4.5 h to determine the organic matter content (om). The value offwas calculated by, whereBw, ArandTare the weight of particulate matter collected by the sediment trap, the cross-sectional area of the sediment trap and the sampling duration, respectively.
Moreover, the simulation effect was characterized by residuals (ε), posterior difference ratio (c), small error probability (p) and Spearman’s correlation coefficient (R). The value ofε'was calculated asε'=f '−f, wheref 'was the simulated settling flux of biodeposition. The value ofcwas calculated asc=Sε'/Sf, whereSε'andSfwere the standard deviation of the residual and measured settling flux of biodeposition, respectively.
whereis the mean residual, and the significance level is 5%.
3 Results and Discussion
The simulated volume fraction of biodeposition in Maniao Bay varied with depth (Fig.6). The distribution of biodeposition in the deep-water area was uneven, where a relatively high volume fraction of biodeposition (1.5×10⁻⁴–5.0×10⁻⁴) with a corresponding settling flux of biodeposition of 50 – 150 g d–1m–2occurred in the center position.The volume fraction of the biodeposition in the nearshore water area was evenly distributed, with a volume fraction of 0 – 1.5×10⁻⁴(corresponding biodeposition flux of 0 – 50 g d–1m–2). As shown in Fig.7, the volume fraction of biodeposition was mainly concentrated in the bottom layer(7.5 – 8.0 m). The distribution of biodeposition is mainly affected by the flow direction and velocity, and the distribution of the high volume fraction of biodeposition in the deep-water area is consistent with the distribution of the water flow velocity. This is in line with the results of numerous studies where biodedposition is concentrated near net cages.

Fig.6 Distribution of the volume fraction of biodeposition at the bottom of Maniao Bay.
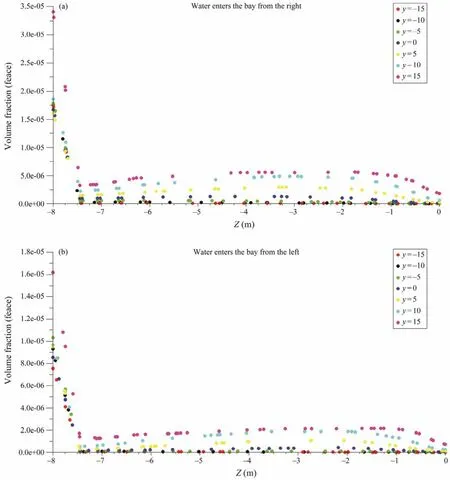
Fig.7 Volume fraction of biodeposition along different depths (Y-axis).
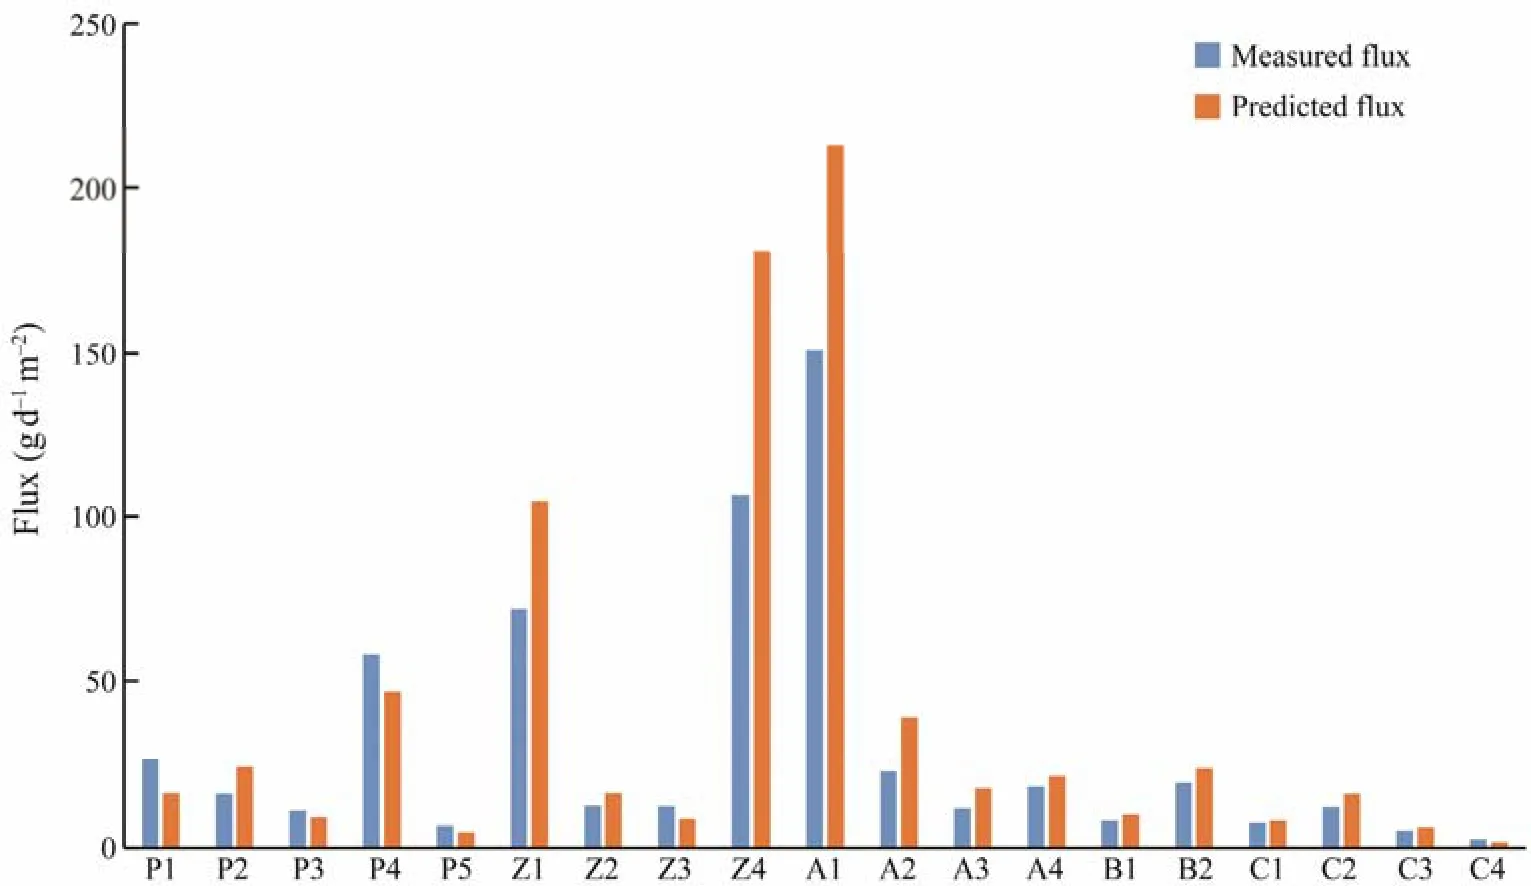
Fig.8 Measured and simulated biodeposition settling fluxes in Maniao Bay.

Fig.9 Spearman correlation analysis between the measured settling flux of biodeposition and the simulated flux in Maniao Bay.
The sediment trap suspended at sampling site B3 was lost;hence, there was no measured settling flux of particulate matter at the sampling site. At sampling sites P1, P2, P3,P4, P5, Z1, Z2, Z3, Z4, A1, A2, A3, A4, B1, B2, C1, C2,C3 and C4, the measured settling fluxes of biodeposition were 26.02, 15.78, 10.77, 58.16, 6.57, 72.17, 12.37, 12.11,106.64, 150.96, 22.59, 11.41, 18.03, 7.90, 19.23, 7.06, 11.84,5.19 and 2.57 g d–1m–2, respectively. The simulated settling fluxes of biodeposition at the corresponding sites were 16.03, 23.98, 8.87, 46.90, 4.52, 104.77, 16.03, 8.35, 180.83,213.06, 39.10, 17.47, 20.98, 9.78, 23.25, 7.84, 15.90, 6.06 and 1.65 g d–1m–2, respectively.
Figs.8 and 9 show the relationship between the simulated biodeposition fluxes and the measured fluxes, during which there was a positive relationship between them (P< 005),which implies that the spatial differences in the settling fluxes of biodeposition had been well simulated. Moreover, theposterior difference ratio of the simulation was 0.38, and the small error probability was 0.94. The posterior difference(Kim, 2019) and small error probability (Moriyama and Ohtani, 2009) are often used to verify the acceptability of simulations. Thus, the posterior difference ratio and the small error probability both reached the eligibility criteria (Table 1) (Zhanget al., 2022),i.e., the difference between the results of the numerical simulation and the measured values reached an acceptable level.

Table 1 Posterior difference accuracy standard
The settling flux of biodeposition is generally determined by field investigation (Ge and Fang, 2006), which can characterize the spatial distribution of biodeposition and reflect the diffusion distance of biodeposition (Tsutsumiet al., 2006). Nevertheless, this method is not suitable for predicting the spatial distribution of biodeposition, and it is difficult to establish the relationship between the diffusion or setting and production of biodeposition. Interpolation methods such as kriging interpolation can be used to characterize the spatial distribution of natural environmental elements (Liu and Chen, 2011); however, its use for the spatial interpolation flux of biodeposition seriously affected by human activities seems to lack a corresponding theoretical basis.
Another commonly used method for simulating biodeposition flux is the three-dimensional hydrodynamic model method (Cardenaset al., 2005). This method requires the construction of equations of motion of particulate matter such as biodeposition in the fluid, which requires an accurate description of the hydrodynamic processes in the study area. This is difficult for studying the areas without historical data about hydrodynamics. It is also extremely difficult for researchers who lack fluid mechanics training.
Nonpoint source pollution is simplified to a point source,and the location of the pollution source is simplified to the center of the nonpoint source pollution discharge area, which is a commonly used technical means in environmental impact assessment (Wanget al., 2004). Thus, it is theoretically acceptable for the present work to consider the discharge of biodeposition from net cages as a regular point source.
The similarity theory is a common technical means for simplifying physical models, and it has a strict derivation process (Zhou, 1997). In the present work, the physical size and current speed of Maniao Bay were determined strictly according to a similar theory. All these factors mean that this simplification process is acceptable in theory.
Fluent fluid simulation software is commonly used to simulate the diffusion and sedimentation of particulate matter (Chenet al., 2011). This method does not need to accurately characterize the fluid movement process and the mechanism how the fluid drives the movement of particles.From the existing research results, this method is simpler compared with the method based on a three-dimensional hydrodynamic model. It can predict the diffusion and sedimentation of particulate matter, so it has the advantage that thein situinvestigation method of biodeposition settling flux does not have.
From the results of the present work, the spatial differentiation characteristics of the biodeposition settling flux have been well simulated. There is little difference between the simulated and observed biodeposition settling fluxes. The result suggests that the method used in the present work can simply and effectively simulate the settling flux of biodeposition.
4 Conclusions
The discharge of biodeposition in the cage culture zone is nonpoint source pollution. Moreover, there is no specific law about it. To simplify the simulation process, the biodeposition production in the cage culture zone was considered as point source pollution. Based on similarity theory,the geometry and flow of the studied waters were simplified. According to these two simplifications, the settling flux of biodeposition in open waters was simulated through Fluent, a fluid simulation software. Comparing the simulated settling flux of biodeposition and the measured flux, the results show that the spatial differentiation of the biodeposition flux was well simulated, and the simulated results reached an acceptable level from the perspective of relative error. Thus, if nonpoint source pollution is simplified to point source pollution and open waters are simplified based on similarity theory, the settling flux of biodeposition in open waters can be simply and effectively simulated by the fluid simulation software Fluent. All these factors determine whether the areas need to be simulated. If the geomorphology and pollution characteristics of the study area are complex, and some necessary data such as water flow velocity are unavailable, the method in the present research can solve this problembe employed to study the diffusion and setting of particulate matter.
Acknowledgements
The authors are grateful to financial support from the National Key Research and Development Program of China (No. 2018YFD0900704), and the National Natural Science Foundation of China (No. 31972796).
杂志排行

Journal of Ocean University of China的其它文章
- Using Natural Radionuclides to Trace Sources of Suspended Particles in the Lower Reaches of the Yellow River
- Eutrophication of Jiangsu Coastal Water and Its Role in the Formation of Green Tide
- Evaluation of the Shallow Gas Hydrate Production Based on the Radial Drilling-Heat Injection-Back Fill Method
- Microstructure Characterization of Bubbles in Gassy Soil Based on the Fractal Theory
- Morphological and Sulfur-Isotopic Characteristics of Pyrites in the Deep Sediments from Xisha Trough, South China Sea
- Deformation Characteristics of Hydrate-Bearing Sediments