Morphological and Sulfur-Isotopic Characteristics of Pyrites in the Deep Sediments from Xisha Trough, South China Sea
2024-03-12CHANGJingyiLIUYujiaLUHailongLUJinganSUXinYEJianliangandXIEWenwei
CHANG Jingyi , LIU Yujia, LU Hailong, , LU Jing’an , SU Xin,YE Jianliang and XIE Wenwei
1) College of Engineering, Peking University, Beijing 100871, China
2) Beijing International Center for Gas Hydrate, School of Earth and Planetary Sciences, Peking University,Beijing 100871, China
3) School of Marine Science, Nanjing University of Information Science and Technology, Nanjing 210044, China
4) MLR Key Laboratory of Marine Mineral Resources, Guangzhou Marine Geological Survey, Ministry of Land and Resources, Guangzhou 510075, China
5) School of Ocean Sciences, China University of Geosciences, Beijing 100083, China
Abstract Pyrite is one of the common authigenic minerals in marine sediments. Previous studies have shown that the morphological and isotopic characteristics of pyrite are closely related to the geochemical environment where it is formed. To better understand the formation mechanism of authigenic pyrite, we analyzed the isotopic composition, morphology, and distribution of pyrite in the sediment at 500 m below the seafloor from Xisha Trough, South China Sea. Mineral morphologies were observed by scanning electron microscopy and Raman spectrography. X-Ray computed tomography was applied to measure the particle size of pyrite. The size of pyrite crystals in the matrix sediment mainly ranged between 25 and 65 µm (av. ca. 40 µm), although crystals were larger (av. ca. 50 μm) in the veins. The pyrites had a fine-grained truncated octahedral shape with occasionally well-developed growth steps, which implies the low growth rate and weak anaerobic oxidation of methane-sulfate reduction when pyrite was formed. The δ34S values of pyrites ranged from +20.8‰ Vienna-defined Canyon Diablo Troilite (V-CDT) to +33.2‰ V-CDT and from +44.8‰ V-CDT to +48.9‰,which suggest two growth stages. In the first stage, with the continuous low methane flux, the pyrite possibly formed in an environment with good access to seawater. In the second stage, the pyrites mainly developed in sediment fractures and appeared in veins, probably due to the limited availability of sulfate. The less exposure of pyrite to the environment in the second stage was probably caused by sediment accumulation or perturbation. In this study, an episodic pyritization process was identified, and the paleoenvironment was reconstructed for the sediment investigated.
Key words pyrite; sulfur isotope; AOM; methane flux; Xisha Trough; South China Sea
1 Introduction
In marine sediment, pyrite is one of the most common authigenic minerals whose formation is closely related to the geochemical environment (especially the redox environment) and sulfur geochemical behavior (Changet al., 2022).The morphology and sulfur-isotopic characteristics of pyrite are diagnostic tools for deducing its environmental conditions (Wilkinet al., 1996; Roychoudhuryet al., 2003;Wanget al., 2012).
Naturally occurring pyrites most commonly exist in cubic, octahedron, pentagonal dodecahedron, framboid, sunflower, and rod aggregate forms (Wang and Morse, 1996;Wilkinet al., 1996; Dinget al., 2014; Huanget al., 2017;Merineroet al., 2017), and their sulfur-isotopic characteristics differ considerably (Linet al., 2016c; Linet al., 2017).The mean diameter versus standard deviation of framboidpyrite size distributions is a reliable proxy to infer the redox condition of bottom water (Wilkinet al., 1996). Framboids are the precursor of large euhedral pyrite, as reported by Merineroet al. (2008) based on the results of a series of intermediate iron sulfides transformed from framboids into euhedral pyrite crystals in Cadiz Bay (Sawlowicz, 1993).
In a closed sedimentary environment with natural gas hydrate occurrence or intense methane flux, bacterial sulfate reduction is coupled to anaerobic oxidation of methane(AOM) in the sulfate-methane transition zone (SMTZ), and the reaction is shown in Eq. (1). Authigenic iron sulfide minerals, such as pyrite formation, show enhancement (Limet al., 2011; Zhanget al., 2014). Therefore, pyrite is a useful proxy for methane flux, AOM, and the depth of the SMTZ(Limet al., 2011). The SMTZ, which depends on methane flux, is generally located in a zone a few centimeters to tens of meters below the seafloor (mbsf) (Aharon and Fu,2000), in which the AOM with the SO42−concentration decreases with depth below the seafloor, and the CH4content increases with depth below the SMTZ. However, the SMTZ on the continental margin and ocean without gas hydrate is usually located at more than 50 m, and some portions reach deeper than 100 m (Borowskiet al., 1999).
Sulfur isotopes have attracted considerable interest because of their potential to provide a direct and sensitive index for understanding modern/ancient biogeochemical cycles, redox of environment, sources of sulfur pools, and pyritization pathway in addition to morphological characteristics (Johnstonet al., 2005a, 2005b; Fikeet al., 2006;Canfield and Farquhar, 2009; Canfield, 2013). The sulfur isotope fractionation of bacterial sulfate reduction is mainly affected by factors such as the abundance and type of electron donors, sulfate-reducing bacterial species, and sulfate concentrations (Simet al., 2011; Wing and Halevy, 2014;Gonget al., 2021). As the radius of32S is less than34S,sulfate-reducing bacteria preferentially utilize32S, which contributes to a faster turnover of32S than34S (Jones and Starkey, 1957; Kaplan and Rittenberg, 1964; Canfield, 2001).Thus, authigenic pyrite has a negative δ34S, and sulfates,such as gypsum and barite, present a positive δ34S (inherited from pore water). However, pyrite with a superheavy δ34S has also been found in marine sediments (Linet al.,2016c), which may be the result of the inheritance of a diminishing sulfate pool. The value of δ34Spyhas a wide range that reaches up to +132‰ Vienna-defined Canyon Diablo Troilite (V-CDT) (+21‰ V-CDT on average) due to Rayleigh-type processes with microbial involvement(Gregoryet al., 2019).
As an excellent indicator of depositional environment and early diagenetic process, the size distribution of sedimentary and framboid pyrites has been widely studied to infer modern and ancient sedimentary environments. However, previous studies on size distribution relied on twodimensional (2D) methods, such as optical microscopy and scanning electron microscopy (SEM) observations. As a result, some details might have been neglected, which led to incomplete or biased interpretations. In general, microcomputed tomography (CT) can differentiate the components of an object depending on the different attenuations to X-rays (Cnudde and Boone, 2013), and it has exhibited excellent capacity for geological research (Cnuddeet al.,2006; Krakowskaet al., 2016; Merineroet al., 2017). Given the limited observation under a microscope, high-resolution X-ray CT was applied to obtain the size distribution of marine sedimentary pyrite in this study.
The previous research on pyrite from Xisha Trough is limited. Shiet al. (2020) summarized the characteristics of pyrite tubes at site S1 in Xisha Trough and inferred an active gas hydrate dissociation progress related to pyrite formation. However, the pyrites that formed in deep-sea sediment with deep SMTZ have remained poorly understood. In this study, a deep-sediment sample containing pyrite from Xisha Trough was investigated to understand the pyrite formation process and the related geochemical environment changes.
The objectives of this study were as follows: 1) to investigate the morphology, entire size distribution, and particle size of pyrite and reconstruct the paleoenvironment, 2)to infer the episodic pyritization based on δ34Spycharacteristics, and 3) to obtain further insights into the relation between pyrite morphology, sulfur isotope, and early diagenetic processes.
2 Samples and Methods
2.1 Geological Setting
The sampling site is located on the northwestern slope of Xisha Trough, South China Sea, connected to the Qiongdongnan Basin in the west, Pearl River Mouth Basin in the north, north of the Xisha uplift, and west of the central basin. Fig.1 shows the geographical location and water depth distribution of the northern slope of the South China Sea. The water depth of Xisha Trough is 1500 – 3400 m.
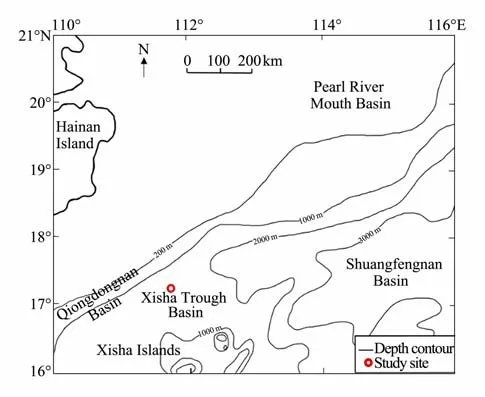
Fig.1 General map of northern South China Sea with the location of the study site.
2.2 Sample
The sample in this study was a gray-white siltstone (Fig.2). During the scientific expedition organized by Guangzhou Marine Geological Survey in June 2016, the XH-W03B-16 well was drilled byVoyagerin the Xisha waters. The site is located on the northwest slope of Xisha Trough,with a water depth of 1777 m and a well depth of 560 m.Pyrite with veinlets was found at 500 mbsf in the Miocene stratum. The sample was 3.8 cm in width, 0.9 cm in thickness, and 5 cm in height and had an irregular shape. As shown in Fig.2, three approximately parallel pyrite veinlets,which had a copper-yellow color, were distributed in the sample, and the pyrite had a metallic luster. The distance between the central and upper veinlets and between the central and lower veinlets were 1.7 and 1 cm, respectively(Fig.2).
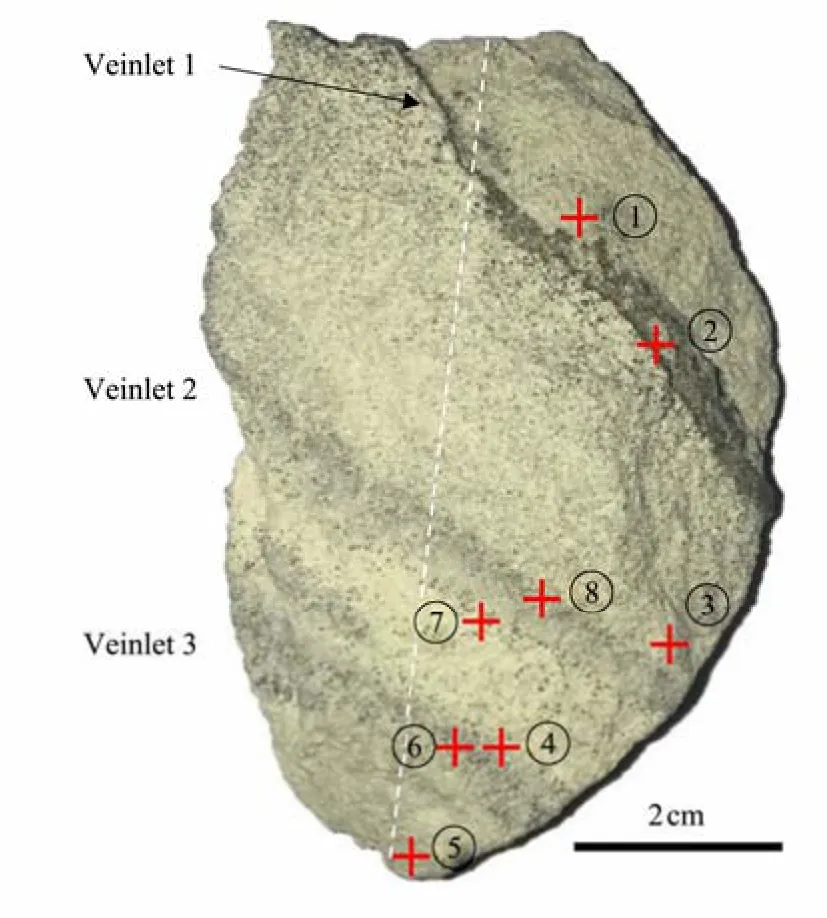
Fig.2 Pyrite-banded siltstone from Site XH-W03B-16.
2.3 Morphological and Mineralogical Analysis 2.3.1 Powder X-ray diffraction (XRD)
Powder XRD was used to identify and quantify the crystalline phases of sediments. XRD test was performed using a PANalytical Empyrean with PIXcel1DMedipix3 detector with Cu Kα radiation (λ= 1.5406Å) at 40 kV and 40 mA in the 2θrange of 5˚ – 80˚. All records were determined at a step size of 0.013˚ and a counting time of 30 s per step. Approximately 1 g sample from each portion (C-1, C-2, C-3, P-1, P-2, and P-3; Fig.7a) were tested under a 200 mesh. The phases in samples were examined using the PDF2-2004 database.
2.3.2 High-resolution X-ray CT
X-ray CT uses computer-processed combinations of multiple X-ray measurements obtained from different angles to produce cross-sectional (tomographic) images (slices)of specific areas of the scanned object. As a non-invasive method, X-ray CT is mainly used to recognize sedimentary structures such as carbonate pipes (Penget al., 2017)on a large scale and study petrophysics, including mineral distribution, porosity characteristics, and reservoir permeability evaluation (Karacan and Okandan, 2001; Polaet al.,2012; Denget al., 2014; Liuet al., 2022). A few research focused on mineral size distribution tested by CT (Godel,2013; Prichardet al., 2017; Gurinet al., 2018).
We used the attenuation coefficient differences between pyrite and the surrounding matrix to assess the volumetric content of pyrite and the distribution of pyrite grains. The sample was analyzed on a nanoVoxel3000, whose resolution reaches up to 500 nm. Based on the mineralogical characteristics of the samples, six microregions (Fig.7a) were scanned under the same scanning conditions, 10X times lens,120 kV energy voltage, 70 mA current, and 20 s exposure time per projection, source object distance of 47.7 mm, and source detector distance of 67.6 mm. More than 1800 projections of each sample were obtained, and a voxel size of 1.414 μm3was achieved. Avizo 9 was used for 3D reconstruction.
As the sediment was heterogeneous and the sample collected for CT was irregularly shaped, the influence of hardening on scanning must be estimated. We measured the gray value in three different positions in a sectional image(Fig.3). The gray value of calcite wasca. 150 in three different parts, with a tolerance of less than 7%. The gray value of pyrite (approximately 240) was considerably higher than that of calcite. Therefore, the result of X-CT, which is believed to be a credible method for distinguishing different contents and detecting particle size distribution, promises an acceptable accuracy.
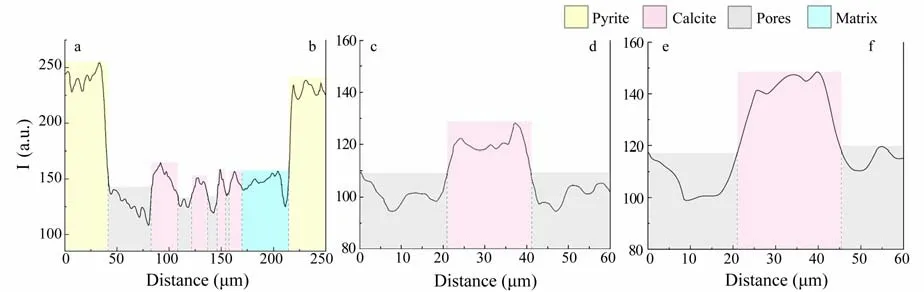
Fig.3 Brightness index distributions along lines ab, cd, and ef. See line distributions in Fig.6(a).
2.3.3 SEM
The samples were cut into two parts along the longest dotted line (Fig.2). The left half was preserved in a vacuum desiccator, and the other half was used to characterize pyrite morphology and document important textural and mineralogical relationships by SEM at the National Research Center for Geoanalyse (NRCG) and Qingdao Institute of Marine Geology (QIMG), China Geological Survey. The test at NRCG was undertaken using a ZEISS Sigma 500 high-resolution field-emission scanning electron microscope and a Bruker XFlash 6130 X-ray Energy Spectrometer.Three pyrite veinlets were detected in this sample. Six small samples with a diameter of 2 mm were collected(Fig.7a). Energy dispersive spectroscopy (EDS) qualitative analysis was performed at accelerating voltages of 5 and 10 kV. The test at QIMG was conducted using an S-3400N.Low accelerating voltage and gold film vaporization on the surface of each sample were implemented to reduce the surface charging effect.
2.3.4 Raman spectrography
Raman spectrography can compensate for the incapability of XRD to detect low-content minerals. Raman spectral analysis was performed using a microscopic confocal Raman spectrometer at the Beijing International Center for Gas Hydrate, Peking University. The spectrum excitation wavelength was 532 nm, and the best spectral resolution was 1 cm−1. The scanning range was from 50 cm−1to 2000 cm−1.
2.4 Sulfur Isotope Analysis
Handpicked authigenic pyrite and chromium reduction methods are currently used in the analysis of sulfur isotopes (Jørgensenet al., 2004; Xieet al., 2012; Linet al.,2016a). The former is more accessible, and the latter can provide more accurate information (Linet al., 2016b).Therefore sulfur extraction and measurement of all samples were implemented in accordance with the chromium reduction method described by Canfieldet al. (1986) at the China University of Geosciences in Wuhan. The sediment samples were dried and then ground to 200 mesh before the chemical extraction.
All results reported here are in standard delta notation as per mil deviations from the V-CDT. The sulfur recovery rate in the experiment was higher than 90%.
3 Results
3.1 Mineral Composition
XRD data of the materials indicated that calcite, pyrite,marcasite, and quartz were the main constituents of the samples. Calcite was the dominant mineral, and the phases of iron sulfide were pyrite and marcasite (Fig.4). Large area scan by Raman spectrometry (Fig.5) showed that pyrite grew as porous aggregates. The Raman spectra of P-2 revealed peaks of quartz (219 cm−1), calcite (284 cm−1),marcasite (319 cm−1), and pyrite (383 cm−1).
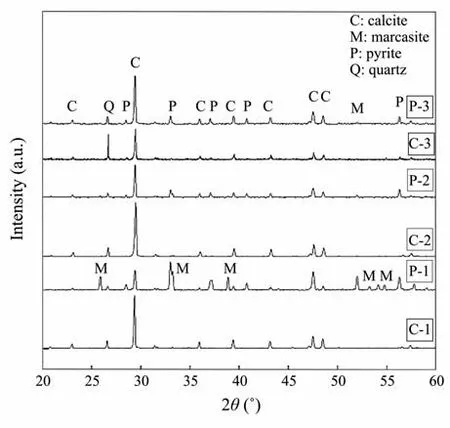
Fig.4 Powder XRD patterns of the sediment samples from C-1, P-1, C-2, P-2, C-3, and P-3.
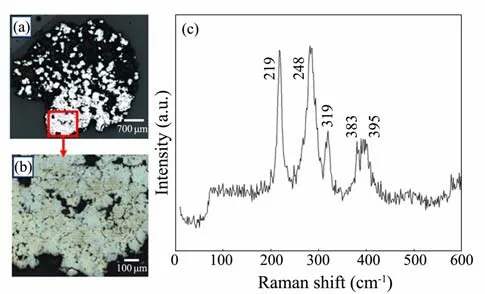
Fig.5 (a) Stitching image of samples from P-2. (b) Stitching image of the enlarged section symbolized by the red frame in Fig.5a. (c) Raman spectra of samples from P-2. The numbers in brackets are peak positions.
3.2 Size Distribution
Nonlocal filters were applied in this study to reduce noise error. The ortho slice (Fig.6) illustrates the composition distribution with different gray values, with pyrite and calcite presenting light- and dark-gray values due to their density difference. Abundant and well-preserved foraminifera fossils were observed in the samples, the chambers of which were filled by pyrite clusters and euhedral pyrite crystals with sizes less than 65 microns.

Fig.6 (a) A 2D sectional image showing the internal microstructure of the sample matrix (light gray represents pyrite,black denotes pores, and the remaining dark gray portion indicates the distribution of calcite and matrix). (b) 3D volume rendering of the pyrite from P-3 (the white part represents pyrites that are mostly octahedron; the brown part represents foraminiferal calcite and other minerals).
CT has been applied in recognizing small structures and distinguishing different minerals. As shown in Fig.6a,pyrite, calcite, and pores can be successfully separated by apparent grayscale differences. However, the mineral particles may connect with each other and cannot be automatically separated by Avizo. Thus, the pyrite with a side length of over 80 μm, as estimated by CT, may be an error according to the maximum and minimum size information of pyrite obtained by SEM observations (see detailed description in Section 3.3). The pyrite with a side length between 1 – 80 μm was selected and preserved. The results of the size comparison are illustrated in Fig.7b, and the sample position is shown in Fig.7a. Fig.7c displays the size histograms of the pyrite measured by CT.
As shown in Fig.7, the particle size was highly variable among the six regions, and a large size difference was observed between particles in each. The maximum volume was up to 1.4 × 107μm3, and the minimum was 1.41 μm3(measurement precision in this study), which deviated considerably from the primary result. This kind of error was attributed to the huge difficulty of precise thresholding during the analysis of complex sediment samples, in which isolated noise and large pyrite aggregates strongly affected statistical data. The selected data showed that the average diameters of C-1, P-1, C-2, P-2, C-3, and P-3 were 33, 42,37, 25, 34, and 44 μm, respectively, which are reasonable size information to represent the whole sample characteristic.
3.3 Morphology of Pyrite
Eight regions (Fig.2), including four samples in pyrite veins and four in the matrix sediment, were observed and analyzed by SEM and EDS. The results showed that the sample structure was relatively loose, and the minerals mainly contained authigenic pyrite, clay minerals, authigenic calcite, quartz, albite, orthoclase, and calcareous foraminifera shell and fragments.
Fig.8 shows the secondary electron images. Most of the pyrite crystals studied in this paper were well developed,with the shape of octahedrons and truncated octahedrons(Figs.8a – 8b), and occurred as single crystals. The infilling pyrite of foraminiferal shells was widely formed in the sample. The pyrite crystals had diameters mostly below 65 and above 25 microns. Evident differences were revealed in the particle counts and particle size of pyrite in different locations. The grain size of authigenic pyrite at the veinlet was slightly larger than that of siltstone, with an average difference of 10 microns or so. Some of the surfaces of pyrite (111) dissolved at different degrees or underwent partial oxidation, especially in the outermost edge and at the center of the crystal surface (Fig.8c). However,the surfaces of pyrite (100) were preserved well.
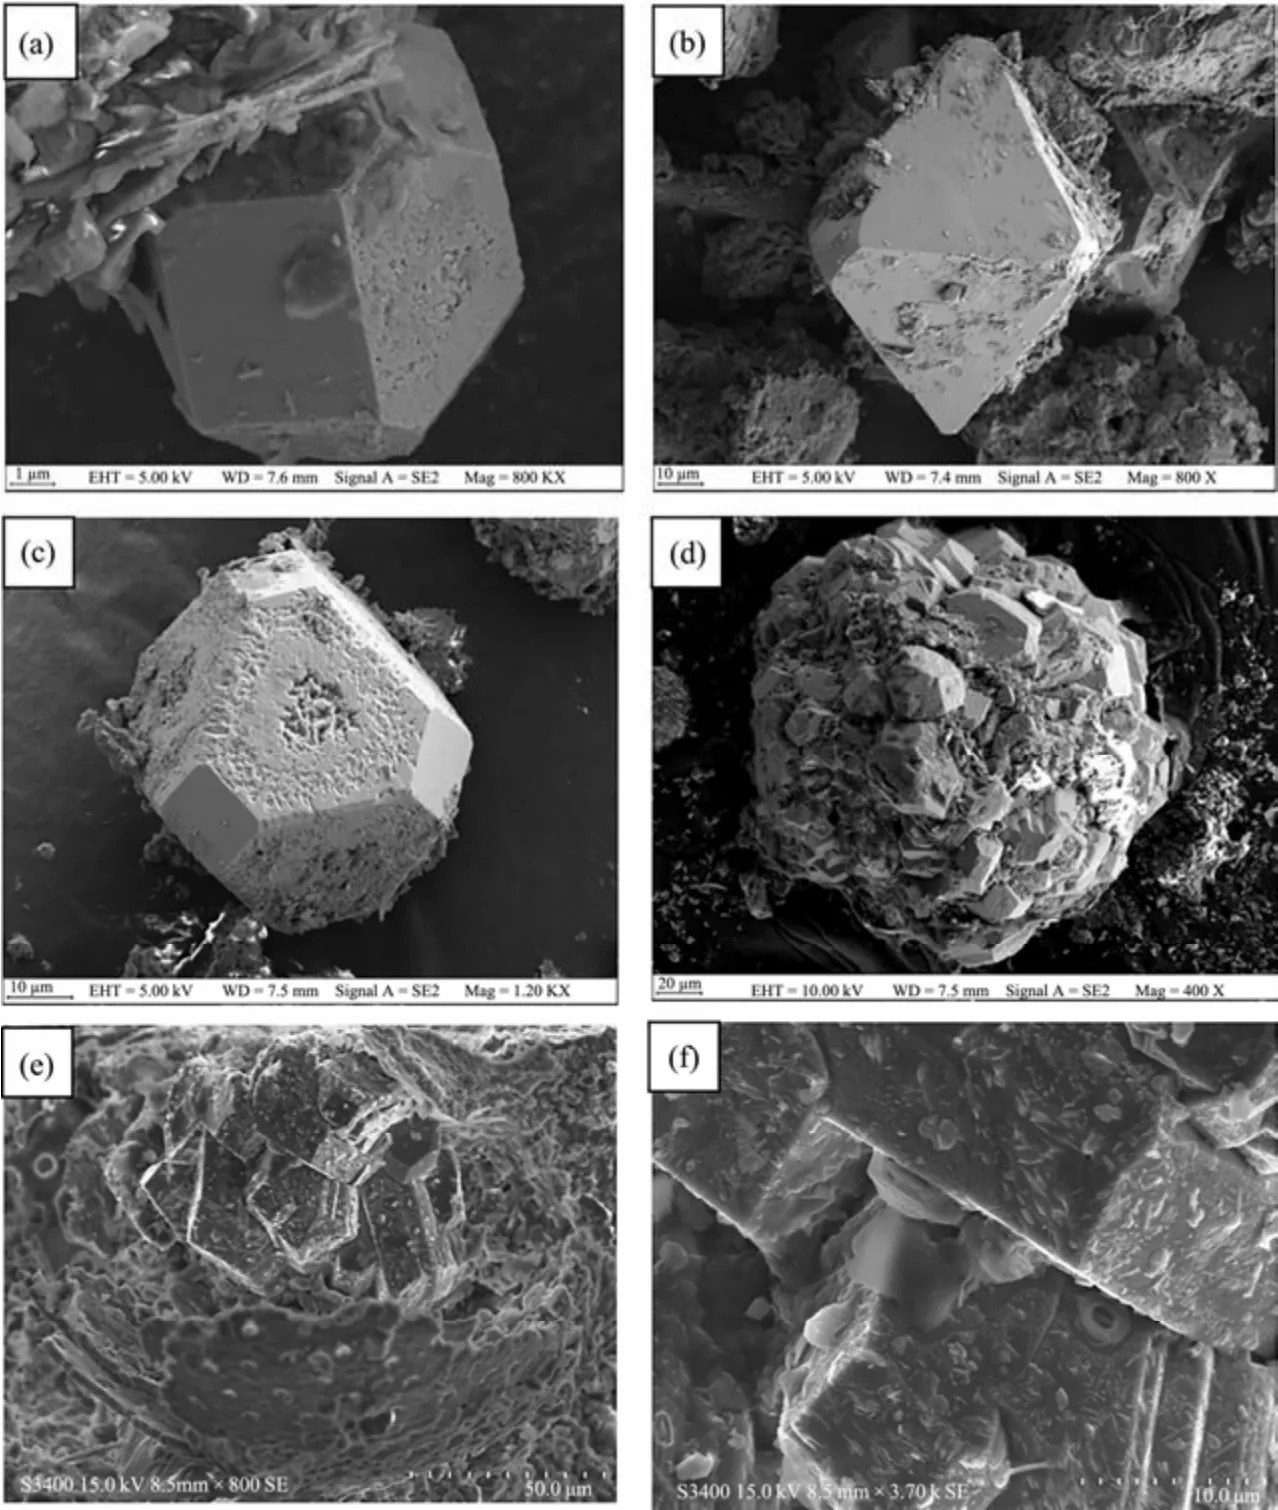
Fig.8 Secondary electronic images of authigenic pyrite from Xisha Trough. (a), truncated cubic pyrite; (b), large truncated octahedral pyrite; (c), partial corrosion on the (111) surface of the truncated octahedron; (d), spherical pyrite aggregates that inherited the shape of foraminiferans; (e), pyrite aggregates filling in the chamber of foraminifera; (f), clay minerals, annular algae, and growth steps on the crystal surface of authigenic pyrite.
Fig.8e shows the pyrite aggregates filling in the foraminiferan chambers, with some existing in spherical forms(Fig.8d). As shown in Fig.8f, clay minerals and annular algae were observed on the crystal surface. In addition, pyrite growth steps formed on the crystal surface (Fig.8f) and displayed a straight edge and large distance between growth steps.
Low-content calcite with a rhombohedral shape (the edge length was generally less than 2 μm) and occasional spherical aggregates were observed. However, a large amount of foraminiferal calcite was well preserved. The occurrence of foraminiferal fossils, which contained single- and multichambered foraminifera, differed substantially. However,most of them have been broken into fragments, and the chamber structure cannot be distinguished. Regardless, the micropore on the surface of the microshell can still be observed (Fig.8e).
3.4 Sulfur Isotope
Sulfur isotope analysis was applied to better understand the growth mechanisms. Table 1 shows the results of sulfur isotope experiments. The recovery of sulfur was over 90%.
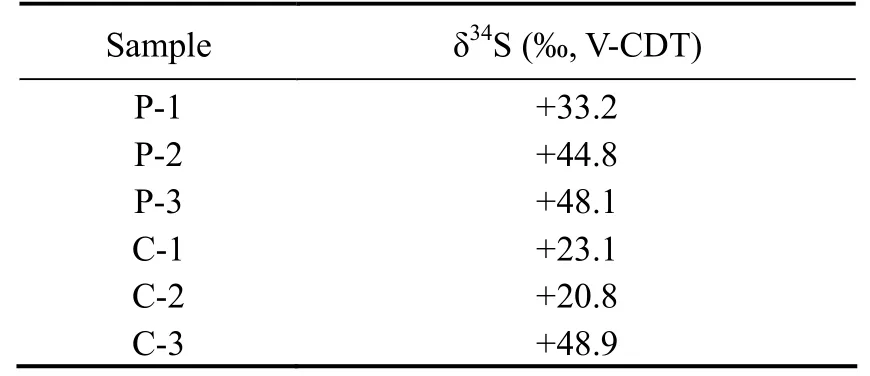
Table 1 Sulfur isotope of P-1, P-2, P-3, C-1, C-2, and C-3
The δ34S of six groups were positive and ranged from+20.8‰ V-CDT to +48.9‰ V-CDT. The analysis revealed extremely variable δ34S values for pyrite. C-1 and C-2 samples had similar δ34S with the seawater sulfate δ34S of+21‰ V-CDT (Reeset al., 1978; Michael and Bottcher,2000), and the other four samples exhibited heavy sulfur isotope characteristics, especially P-3 and C-3 samples with up to +50‰ V-CDT. Compared with the matrix, the enrichment in34S of pyrite veinlet was larger.
4 Discussion
4.1 Geochemical Environment as Indicated by Pyrite Morphology
In this study, except for irregular crystalline-pyrite filling in foraminiferan shells, the other texture forms mainly included octahedrons, truncated octahedrons, and pentagonal dodecahedrons, although the last one is rare. When sufficient material is provided, such as mud volcano (Merineroet al., 2017), euhedral pyrite has the smallest size(< 10 µm); meanwhile, sunflower and framboid are larger than euhedral pyrite. In this research, euhedral pyrite was notably large (mean side length: 25 – 45 μm), which may indicate a relatively closed condition.
First-principle spin-polarized density functional theory total-energy calculations were applied to measure the stability of the crystal surface. The (001) is the preferential surface under the S-lean condition, and (111) is preferred under the S-rich condition (Alfonso, 2010). The crystal forms of pyrite in this study were mainly octahedrons and truncated octahedrons, which indicates that the environment was rich in sulfur during the growth process.
The flat growth step on the crystal surface implies pyrite formation in a stable geochemical environment without geological disturbance and the long-term stable sedimentary condition. The partial dissolution in varying degrees on the surface of pyrite crystals, especially at the center and edges of the (111) surface, indicates anaerobic oxidization in marine sediment (Schippers and Jørgensen, 2001,2002), which releases sulfate to be dissolved in pore water.
Mineral analysis revealed that marcasite existed with pyrite. Pyrite and marcasite have the same chemical formulas but show evident differences in their formation conditions and physicochemical properties. Pyrite is an equiaxed mineral with cubic and octahedral crystalline forms,and marcasite is a polymorphous mineral especially characterized by its plate-like occurrence. Marcasite is an unstable variant of pyrite, and it rarely forms in nature and does not accumulate in large quantities. It grows preferentially at lower temperatures and more acidic environments (pH< 5) than pyrite (Schoonen and Barnes, 1991a, 1991b; Benninget al., 2000). Controversy still surrounds the specific growth process of marcasite. However, marcasite has been found wrapped outside the pyrite core in the form of a growth layer (Zhanget al., 2014), which is usually irregular or radioactive (Rakovanet al., 1995). The AOM or OSR process may provide a suitable environment for marcasite, which causes HS−to form iron sulfide; the residual H+lowers the pH and increase the ratio of [H2S] / [HS−] of the ambient solution. This acidified microenvironment will result in the growth of marcasite unit layers on the pyrite substrate (Zhanget al., 2014).
4.2 Implications of the Positive δ34SCRS
According to current knowledge, paleo seawater sulfate had a similar or lighter δ34S than current seawater sulfate δ34S in the last 400 Myr (Paytanet al., 1998; Wuet al.,2010; Canfield, 2013). The sulfur isotope of samples in this study is heavier than current seawater, which may be due to the current sedimentary sulfur cycle, mainly the microbially mediated mineralization.
Three dominant pathways of microbial metabolism, including sulfide oxidation, sulfate reduction, and sulfur selfdisproportionation, affect the biogeochemical sulfur cycle and induce sulfur isotope fractionation. Sulfide oxidation can cause a slight fractionation (Habichtet al., 1998; Zerkleet al., 2009), and onlyDesulfurivibrio alkaliphiluswas reported to generate a substantial and consistent enrichment of34S (Pellerinet al., 2019). Sulfate reduction substantially affects the isotopic value and can induce up to+132‰ V-CDT (Drakeet al., 2018). Meanwhile, self-disproportionation is also a pivotal pathway that leads to considerable fractionation (Habichtet al., 1998; Böttcheretal.,2001). Approximately 21‰ fractionation on average is made by dissimilatory sulfate reduction (Canfield and Teske, 1996;Habicht and Canfield, 1997).
Fig.9 summarizes the sulfur isotope values of pyrites with different textures from all around the world. The isotopic value of framboid, which is commonly less than−30‰ V-CDT, has an evident negative characteristic. Euhedral pyrite and overgrowth showed a remarkable positive isotopic value, which indicates a diagenetic effect. The δ34S of pyrite above the sulfate-methane interface (SMI)was more negative than that formed in SMTZ. As shown in Fig.9, most sulfides attained a lower δ34S value than seawater, except for the pyrite that formed in the SMTZ and has undergone geological transformation or reformation by enhanced AOM.
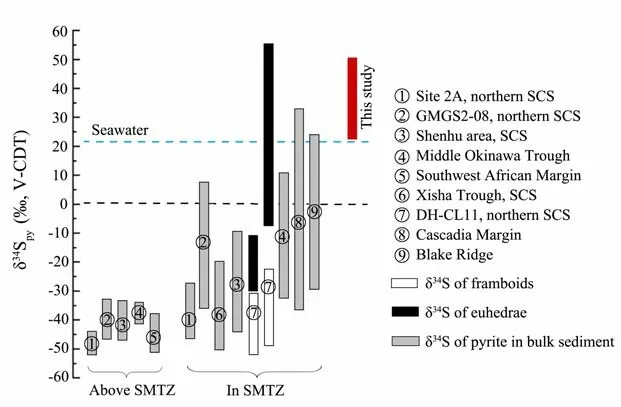
Fig.9 Authigenic pyrite sulfur isotope composition of marine sediments around the world (Wang et al., 2008; Borowski et al., 2013; Wang et al., 2014; Wang et al., 2015; Lin et al., 2016a, 2016b; Lin et al., 2017; Pierre, 2017; Zhang et al.,2018; Crémière et al., 2020; Shi et al., 2020). SMI, sulfate-methane interface; SCS, South China Sea. Pyrite in bulk sediment includes framboids and euhedral pyrites.
In this study, the δ34Spyof euhedral pyrite was higher than that of seawater, which was confirmed to be microorganisms mediated. However, the different isotopic fractionation degrees caused by each pathway need further study.
4.3 Pyritization in the Diagenetic Process
Fig.10 shows the S-Fe composition of different clusters measured by EDS. The Fe/S ratios were mostly limited to those of pyrite and greigite. Pyrites with a large size (> 40µm) had a chemical composition close to that of pyrite,and small grains were similar to greigite. Framboids are all smaller than 10 μm in diameter and have the lowest S/Fe ratio among the three clusters. Therefore, with the pyrite growth and size increase, the atomic S/Fe ratio increases.Thomaset al. (2016) studied the S/Fe ratio of iron sulfides from deep Dead Sea sediments, and the results showed that large iron sulfide minerals have a higher S/Fe ratio than that less than 1 µm in diameter. For the studied samples, as iron sulfides grew larger, the chemical composition became closer to that of pyrite. A high S/Fe atomic ratio(gradually approaching 2:1) indicates an adequate sulfur source.

Fig.10 Atomic S/Fe obtained from EDS measurements. Red squares represent the pyrites whose side length was over 40 μm; blue dots denote the pyrites whose side length was less than 40 μm; yellow triangles reveal the framboid whose diameter was less than 12 μm (L represents the side length of octahedral pyrite). The first two clusters are samples in this study; the data of framboid were collected from the W19B site in the Shenhu area, South China Sea.
In the methane hydrate-bearing region, the SMTZ was mostly within 50 m, with an average of approximately 20 m (Borowskiet al., 1999). In this study, the depth of the SMTZ was approximately 60 m, and the concentration of SO42−did not change considerably from the water-sediment interface to the deep sedimentary column. Therefore,the studied area currently has no gas hydrate and intense methane flux, and pyrite possibly formed in the SMTZ in an environment with a weak methane flux.
The majority of authigenic pyrites formed in marine sediment had a negative sulfur isotope composition. Isotopically heavy values have been recorded in typically anoxic bottom water and deep marine sediment (Lyons and Berner, 1992; Strauss, 1997). The sulfur isotope results showed that the authigenic pyrite studied in this research had a positive value of34S, ranging from +20.8‰ V-CDT to +48.9‰ V-CDT, which indicates a microbial-mediated process.
The δ34S of C-1 and C-2 samples were +20.8‰ V-CDT and +23.1‰ V-CDT, respectively, similar to that of seawater (+21‰ V-CDT (Rees, 1973)). The δ34S of pyrite from C-3 was abnormally high, and this finding may be attributed to sampling misconduct. The C-3 sample was close to the pyrite veinlet, and some pyrite in the veinlet was mixed in. The isotopic distribution pattern may be caused by the two following processes. In one case, anoxic oxidation of organic matter or methane occurred in the shallow part, and seawater, as the source of sulfur, produced a high sulfate reduction rate due to sufficient material supply. Meanwhile, the fractionation degree of sulfur isotope produced by bacterial sulfate reduction was inversely proportional to the sulfate reduction rate. Thus, the sulfur fractionation degree was very low, which resulted in the δ34S of authigenic pyrite being close to that of seawater. A large amount of authigenic carbonate will be precipitated by producing abundant percarbonate and bicarbonate ions when a strong organoclastic sulfate reduction or AOM reaction occurs during early diagenesis. However, SEM observation revealed the low content of authigenic carbonate, which indicates the weak anaerobic oxidation of organic matter/methane.Therefore, the intense sulfate reduction in shallow sediment cannot be the dominant process affecting the sulfur isotope values of C-1 and C-2 samples. Another case is the secondary growth of large-grained authigenic pyrite. The isotopic values of P-1, P-2, P-3, and C-3 samples showed evident positive δ34S, especially for P-3 and C-3 samples,with values close to +50‰ V-CDT, which may imply the multiple stages of pyrite formation. The occurrence of pyrite veinlet implies crack formation during temporal changes due to some geological activities. The specific process is described below, and the simplified pyrite formation process is shown in Fig.11.

Fig.11 Simplified pyrite formation process (stages I and II) beneath the sea floor in Xisha Trough.
During the first stage of pyrite formation, the sedimenttary environment was relatively closed, and the residual sulfate in pore water had a positive value of sulfur isotope.In addition, although the AOM was weak, low methane flux was continuously supplied, and iron and sulfur components were relatively adequate. Thus, the pyrite crystals exhibited slow growth. Under this condition, individual euhedral crystals, such as truncated octahedrons, developed well over a long period.
In the second stage, sediments were deposited continuously and gradually compacted. Additionally, disturbances occurred in the soft clay at a certain point. Thus, the microcracks formed provided a migration pathway for methane. Pyrite in the compacted deposit stopped growing, but pyrite crystals in microcracks enlarged continuously. Combined with the size distribution studied by SEM and X-ray CT, the larger pyrites in veinlets than in the matrix sediment agree with the proposed process described above.As the sediment moved away from the seafloor because of the compaction process, the connectivity between deep sediments and residual seawater became extremely poor.The persistent AOM led to the continuous consumption of32S, which resulted in a gradual positive value of the sulfur isotope of sulfate in pore water without the sulfate supplement from seawater under a semiclosed sedimentary environment. The heavy sulfur isotope may be attributed to the multiple utilizations of residual sulfate in pore water.Ultimately, pyrites with heavy sulfur isotope, which inherited the isotopic characteristics of coexisting sulfate in pore water, formed in microcracks.
As discussed above, studies have focused on the formation process of authigenic pyrite in the deep sea sediment of Xisha Trough, and the weak and persistent AOM may be the major factor affecting pyrite formation and its morphology.
5 Conclusions
Based on the results of size distribution, morphology,and isotopic and mineral compositions of pyrites developed in the sediments from Xisha Trough, South China Sea, the following conclusions can be reached:
1) The pyrite size in the vein was larger than that in matrix sediment, and the δ34Spyvalues of pyrites in the veins(+44.8‰ V-CDT to +48.9‰ V-CDT) were larger than those in the matrix sediment (+20.8‰ V-CDT to +33.2‰V-CDT). The differences in pyrite size and δ34Spyvalue between the veinlets and matrix sediment possibly suggest two stages of pyrite formation: a period with comparatively intensive AOM activities, followed by a long period of sulfate reduction with a low methane flux.
2) The large euhedral crystals of pyrites, mostly ranging from 25 µm to 65 μm with a maximum size of 80 μm, and the straight and wide growth steps observed by SEM imply a low growth rate.
3) In addition to authigenic pyrite, the other authigenic minerals, such as carbonate, were rarely observed, which is indicative of the low rates of anaerobic oxidation of methane and the reduction of sulfate.
Acknowledgements
This work was supported by the Guangdong Major Project of Basic and Applied Basic Research (No. 2020B03 01030003). We wish to express our gratitude to Drs. Xiaomeng Wang, Xindi Lu, Jiujiang Zhao, Jianye Sun and Wenjiu Cai for their help with the mineralogical test and SEM observation.
杂志排行

Journal of Ocean University of China的其它文章
- Using Natural Radionuclides to Trace Sources of Suspended Particles in the Lower Reaches of the Yellow River
- Eutrophication of Jiangsu Coastal Water and Its Role in the Formation of Green Tide
- Evaluation of the Shallow Gas Hydrate Production Based on the Radial Drilling-Heat Injection-Back Fill Method
- Microstructure Characterization of Bubbles in Gassy Soil Based on the Fractal Theory
- Deformation Characteristics of Hydrate-Bearing Sediments
- Genetic Analysis of Structural Styles in the Makran Accretionary Wedge – Insight from Physical Simulations