Saturation Estimation with Complex Electrical Conductivity for Hydrate-Bearing Clayey Sediments: An Experimental Study
2024-03-12XINGLanchangZHANGShuliZHANGHuanhuanWUChenyutongWANGBinLAOLiyunWEIWeiHANWeifengWEIZhoutuoGEXinminandDENGShaogui
XING Lanchang , ZHANG Shuli ZHANG Huanhuan WU ChenyutongWANG Bin LAO Liyun, WEI Wei, HAN Weifeng, WEI Zhoutuo ,GE Xinmin , and DENG Shaogui
1) College of Control Science and Engineering, China University of Petroleum (East China), Qingdao 266580,China
2) School of Water, Energy and Environment, Cranfield University, Cranfield MK43 0AL, United Kingdom
3) Department of Alternative Energy, PetroChina Research Institute of Petroleum Exploration & Development, Langfang 065007,China
4) School of Geosciences, China University of Petroleum (East China), Qingdao 266580, China
5) Laboratory for Marine Mineral Resources, Qingdao National Laboratory for Marine Science and Technology, Qingdao 266071,China
Abstract Clays have considerable influence on the electrical properties of hydrate-bearing sediments. It is desirable to understand the electrical properties of hydrate-bearing clayey sediments and to build hydrate saturation (Sh) models for reservoir evaluation and monitoring. The electrical properties of tetrahydrofuran-hydrate-bearing sediments with montmorillonite are characterized by complex conductivity at frequencies from 0.01 Hz to 1 kHz. The effects of clay and Sh on the complex conductivity were analyzed. A decrease and increase in electrical conductance result from the clay-swelling-induced blockage and ion migration in the electrical double layer(EDL), respectively. The quadrature conductivity increases with the clay content up to 10% because of the increased surface site density of counterions in EDL. Both the in-phase conductivity and quadrature conductivity decrease consistently with increasing Sh from 0.50 to 0.90. Three sets of models for Sh evaluation were developed. The model based on the Simandoux equation outperforms Archie’s formula,with a root-mean-square error (ERMS) of 1.8% and 3.9%, respectively, highlighting the clay effects on the in-phase conductivity. The frequency effect correlations based on in-phase and quadrature conductivities exhibit inferior performance (ERMS = 11.6% and 13.2%, respectively) due to the challenge of choosing an appropriate pair of frequencies and intrinsic uncertainties from two measurements. The second-order Cole-Cole formula can be used to fit the complex-conductivity spectra. One pair of inverted Cole-Cole parameters, i.e.,characteristic time and chargeability, is employed to predict Sh with an ERMS of 5.05% and 9.05%, respectively.
Key words gas hydrate; complex electrical conductivity; hydrate-bearing clayey sediment; hydrate saturation; Simandoux equation;frequency dispersion; Cole-Cole formula
1 Introduction
Natural gas hydrate (NGH) is considered as a new type of unconventional and clean energy source and mainly exists in marine sediments and land permafrost (Kvenvolden,1993; Rogner, 1997; Collet, 2002; Milkov, 2004; Moridiset al., 2009, 2011; Kohet al., 2012; Chiburaet al., 2022).Hydrate saturation is a key reservoir parameter to be estimated for the efficient, economic, and safe production of natural gas. The technologies commonly used to evaluate hydrate reservoirs are mainly borrowed from the oil and gas industry. Consequently, various challenges in the applicability of the current technologies have arisen when used in NGH-bearing sediments. Therefore, the current technologies must be improved substantially to account for the particularity and complexity of NGH-bearing sediments.Furthermore, it is highly desirable to seek new approaches to characterize and evaluate NGH-bearing sediments as well as to understand the underlying mechanisms for developing more applicable and reliable reservoir-evaluation techniques.
Most accumulated global gas hydrate is hosted in finegrained sediments (Boswell, 2009; Boswell and Collett,2011; Boswellet al., 2020), such as those in the Gulf of Mexico, Krishna-Godavari Basin, Blake Ridge, Cascadia Margin, Ulleung Basin, Hydrate Ridge, and South China Sea (Daiet al., 2011; Sriramet al., 2014; Jang and Santamarina, 2016; Sunet al., 2020). Clays have substantial influences on hydrate formation/decomposition processes as well as the physical/chemical properties of the sediments(Guoet al., 2020; Maet al., 2022). For a better design and adjustment of NGH exploitation schemes, the influences of clays on the dynamic evolutions of the involved THMC fields,i.e., thermal, hydraulic, mechanical, and chemical fields (Huanget al., 2021), must be understood. Furthermore, the complex coupling of the THMC fields and particular physical/chemical properties of clays (e.g., swelling and cation exchange capability) results in electrical responses of hydrate-bearing sediments (HBS) that are remarkably different from those of oil or gas-bearing formations.In addition, the gas hydrates may stochastically dissociate and reform with the variation in the environmental pressure and temperature. The pore-water salinity varies due to the stochastic dissociation and reformation of hydrates. The variable salinity poses challenges to conventional conductivity-based well-logging techniques for reservoir evaluation.Geophysical logging techniques (e.g., resistivity logging and acoustic logging) play an irreplaceable role in identifying and evaluating HBS (Leeet al., 1996; Riedelet al.,2005; Lee and Collet, 2008; Shankar and Riedel, 2011;Cook and Waite, 2018; Junget al., 2020; Buet al., 2021;Zhanget al., 2021). However, considering the above issues concerning the complexity of HBS and the dynamic evolution characteristics of NGH exploitation processes, it is understandable that there are intrinsic limitations on the accuracy and reliability of conventional resistivity/conductivity-based well-logging techniques for NGH applications.
The complex-resistivity logging technique was developed by introducing the induced polarization (IP) approach to boreholes from the ground surface (Worthington and Collar,1984; Freedman and Vogiatzis, 1986; Ostermanet al., 2016).Characteristic parameters derived from the frequency spectra of complex resistivity/conductivity are immune to variations in pore-water salinity (as encountered commonly in HBS) and can be quantitatively correlated with reservoir parameters (Jianget al., 2018; Liet al., 2019). Furthermore, the information on formations with different depths around the borehole can be acquired by complex-resistivity logging because a range of frequencies for the excitation current is applied to perform the measurements of complexconductivity spectra,i.e., the responses of spectral induced polarization (SIP). Overall, the complex-conductivity method based on the IP/SIP principle has great potential for qualitatively characterizing and quantitatively evaluating HBS.
Complex-conductivity spectra have been employed to characterize the electrical properties of porous materials(e.g., sandy/shaly sediments and rocks in Revilet al. (2013,2017a, b)). Based on the measured frequency spectra of complex conductivity, some important parameters of porous media, such as the internal surface area, pore geometry/structure, grain size, wettability, permeability, porosity,and saturation of fluids can be estimated because of their close relationship with the complex conductivity. Klein and Sill (1982) conducted experiments with artificial mixtures of clay and glass beads and tested the spectral behavior of electrical properties. They used the generalized Cole-Davidson model to invert the spectral data. The chargeability was found to increase linearly with the clay content up to 6% – 8%. Knight and Nur (1987) measured the electrical impedance of sandstone samples at frequencies from 5 Hz to 4 MHz. The dielectric constant (for frequencies above 60 kHz, where the Maxwell-Wagner polarization dominates)strongly depended on water saturation and frequency. Börner and Schön (1991) investigated the electrical resistivity behavior of sandstone samples at frequencies ranging from 0.001 Hz to 10 kHz and correlated the quadrature resistivity with the specific surface area (SSA) of the sedimentary rocks.Ruffetet al. (1991) measured the electrical resistivity of rock samples as functions of frequency from 1 Hz to 5 MHz and found a clear correlation between the exponent of the frequency dependence of the relative dielectric constant (1 kHz to 1 MHz) and the specific internal surface. Ulrich and Slater (2004) performed measurements of SIP responses for unconsolidated sand samples with different water saturations at frequencies from 0.1 Hz to 1 kHz. The relationship between IP parameters (e.g., the polarization magnitude)and saturation was affected by the pore fluid distribution and saturation history. Binleyet al. (2005) applied the Cole-Cole model (CCM) to fit the IP spectra of saturated and unsaturated sandstones from 0.01 Hz to 1 kHz. The relaxation time displayed an obvious correlation with the permeability as well as characteristic pore throat size. Tong and Tao (2008) estimated the permeability of shaly sandstones based on the frequency dependency properties of quadrature resistivity for frequencies from 100 Hz to 1.5 kHz. Welleret al. (2010) derived the mean relaxation time and chargeability by fitting the Debye model with measured complex resistivity (0.0028 Hz to 750 kHz) and then used them to evaluate the permeability of sandstones. Revilet al. (2015)collected the experimental data of complex conductivity from various porous media including pure silica, clean sands or sandstones, and clayey materials and then derived parameters such as the characteristic relaxation time, intrinsic formation factor, and diffusion coefficient. These parameters were used to verify the permeability model developed by Revilet al. (2012b). For the applications of lowresistivity reservoir evaluation, Jianget al. (2018) developed a complex-resistivity logging tool and estimated the water saturation with a relaxation time constant. The Cole-Cole formula (Cole and Cole, 1941) was used to derive the relaxation time constant from a fit- ting of complex resistivity spectra from 1 kHz to 500 kHz. Liet al. (2019) established relationships between the porosity, time constant,and the water saturation of shaly sands based on Archie’s and Waxman-Smith models (Archie, 1942; Waxman and Smith, 1968) and complex conductivity (40 Hz to 1 MHz).To summarize, it can be concluded from the previous works that the characteristic parameters of complex conductivity(over various frequency ranges for different works) can be used to correlate with the reservoir parameters appropriately.However, the work to extend this approach into the evaluation of hydrate-bearing clayey sediments is lacking, particularly within the scope of the SIP frequency range. The low-frequency range (e.g., < 1 kHz) of electrical fields is preferred in real applications of reservoir evaluation and monitoring to meet the requirement of far detection in formations as well as to reduce the undesirable electromagnetic coupling effects.
Some experimental work on the electrical properties of hydrates and HBS has been conducted based on electrical spectral data. Leeet al. (2010b) performed electrical tests on HBS within the microwave frequency range,i.e., 200 MHz to 1.3 GHz. In this frequency range, the molecular orientation polarization dominates. Consequently, the permittivity becomes a capable predictor of free-water content.In the work of du Franeet al. (2011), samples of pure methane-hydrate were synthesized from ice and methane gas,and the electrical impedance of the samples at frequencies from 20 Hz to 2 MHz was recorded. However, because of the considerable electrode-polarization effects in the twoelectrode system, only the higher-frequency (e.g., > 100 kHz) data were attributed to the true properties of the samples. Finally, the electrical conductivity of the methane hydrate itself was determined. The same experimental system and method were adopted in the work of du Franeet al. (2015), but the tested samples were replaced by those including hydrate and sediments without pore water.Similarly, the impedance data at higher (> 500 kHz) and lower (< 1 kHz) frequencies were considered to be too noisy to be modeled with an equivalent circuit. There is still a knowledge gap on the electrical properties of mixedphase samples (including hydrate, sediment and water) in the low-frequency range of SIP. In this work, the electrical properties of hydrate-bearing clayey sediments are characterized by parameters of complex conductivity from laboratory measurements from 0.01 Hz to 1 kHz. A series of models to evaluate the hydrate saturation of clayey sediments is developed based on a clay-correction equation(i.e., the Simandoux equation), frequency-dispersion correlations, and the Cole-Cole formula, respectively, and the parameters derived from complex conductivity. First, theoretical formulations are derived within the framework of a low-frequency electrical polarization mechanism, providing a theoretical understanding of the complex-conductivity responses of clayey sediments. Second, an experimental scheme for obtaining the complex-conductivity spectra of tetrahydrofuran-hydrate-bearing clayey sediments with various hydrate saturations and clay contents is presented.Based on the experimental measurements and theoretical analysis of the polarization mechanisms, the influences of hydrate saturation and clay on complex conductivity were analyzed. Third, three models to evaluate the hydrate saturation of clayey sediments were developed, tested, and compared based on experimental data. This comparison is followed by sections of discussion and conclusions. This work provides a theoretical basis for developing new tools (e.g.,complex-conductivity/resistivity-based logging and monitoring tools) to evaluate and monitor NGH reservoirs reliably.
2 Theory
2.1 Complex Electrical Conductivity of Clean Sands
When an electric field is applied on a medium, two dynamic electrical processes are induced,i.e., the boundcharge displacement process and the free-charge movement process. The former process can be explained by the electrical polarization mechanism characterized by dielectric permittivity, while the latter process can be described by the electrical conduction mechanism characterized by electrical conductivity. The total current density induced by the electric field can be expressed as Eq. (1) according to the first Maxwell equation and Ohm’s law.
whereJ, Jc,andJdare the total, conduction, and displacement current densities (in A m−2), respectively, andσ, ε0,andεdenote the electrical conductivity (in S m−1), dielectric permittivity of a vacuum (ε0= 8.854 × 10⁻¹²F m−1) and relative dielectric constant (for short, dielectric constant),respectively. The electric intensity usually takes a harmonic form,i.e.,E = E0eiωt,whereE0presents an electrical field with a specific magnitude and direction. Alternatively, the total current density can be rewritten as Eq. (2) according to Ohm’s law.
whereσ*is a complex-valued number,i.e., the complex electrical conductivity (for short, complex conductivity).It can be expressed asσ*=σ'(ω)+ iσ''(ω), whereσ'(in S m−1) is the in-phase conductivity, andσ''(in S m−1) is the quadrature conductivity.
The complex conductivity (σ*) of a porous medium saturated with a water solution is written as Eq. (3), according to the Stern layer model proposed based on the assumption of an electrical double layer (EDL) coating the grains(Leroyet al., 2008; Revilet al., 2012b, 2013, 2017a, b;Revil, 2013).
whereFis the intrinsic formation factor (dimensionless)related to the connected porosity (denoted asφ) by Archie’s law (F=φ−m), andmdenotes the cementation exponent(Archie, 1942),σw*=σw+iωε0εwrepresents the complex conductivity of pore water (whereσwrepresents the electrical conductivity, andεwdenotes the dielectric constant),andσs*represents the complex surface conductivity of solid particles. For solid grains coated by EDL in a granular material (e.g., glass beads in Leroyet al. (2008), and clean sands in this work), the complex-valued conductivityσs*can be expressed as Eqs. (4) – (6).
where(ω) and(ω) are the frequency-dependent inphase and quadrature components,andare the lowfrequency limit and high-frequency limit of(ω), respectively,τ0=) is the relaxation time computed from the diffusing coefficient of counterions in the Stern layer(denoted as, in m s−1), andd0(in m) is the mean diameter of solid grains.
2.2 Complex Surface Conductivity of Clays
The porous materials concerned in this work are hydrate-bearing clayey sands with various contents and hydrate saturations. These materials typically include four components, namely, the hydrate, pore water, sand grains,and clay particles. Theoretically, the electrical properties of clayey sediments are influenced by the mineral type,clay content, and spatial distribution. To model the complex conductivity of clayey materials, Leroy and Revil(2009) established the relationship between the electrochemical properties of minerals and low-frequency conductivity/permittivity spectra. Three types of clay minerals(i.e., kaolinite, illite, and smectite) dominate the clay components in natural sediments containing hydrates (Maet al.,2020; Liu and Li, 2021; Renet al., 2022). The smectite is chosen to be used in the experiments of this work due to its high cation exchange capacity (CEC), and thus more important impacts on the complex conductivity characteristics can be investigated. The surface conductivities of smectite and kaolinite particles can be theoretically calculated in different ways, as shown below (i.e., using Eqs.(7) and (11), respectively).
In the case of smectite particles at low salinity (e.g., <0.01 mol L−1), it is believed that the diffuse layer of solid particles remains continuous at the pore scale. Consequently, only the polarization effect of the Stern layer is accounted for rather than the entire EDL. Thus, the conductivity of a smectite particle due to the Stern layer can be formulated as Eq. (7).
The diffuse layer is considered by replacing the termσw(i.e., the pore-water conductivity) with(i.e., the effective pore-water conductivity) as calculated by Eq. (8). Assuming that one cation (e.g., Na+or K+) is the dominant ionic species in the fluid phase, the effective conductivity of the pore water for this case can be approximated as below:
where(in C m−3) is the volumetric charge density in the water phase of the pore space. This parameter can be related to the total bulk charge density (denoted asQV) by the partition coefficient (fpc), as shown in Eq. (9) (Revilet al., 2012a). The total bulk charge density represents the excess charge per unit pore volume of the granular material, which can be related to theCEC(in C kg−1), as formulated in Eq. (10).
In the cases of kaolinite particles, it is assumed that the diffuse layer of solid grains only occupies a minor part of the total pore volume. This assumption is made because kaolinite has a very low SSA compared with other clay minerals such as smectite and illite (Hassanet al., 2006).Consequently, the diffuse layer is believed to only affect the effective conductivity of the solid phase. If the porous material includes kaolinite or sand particles with the same size and a binary monovalent electrolyte solution (e.g., NaCl),the complex surface conductivity is given by Eqs. (11) – (13)for saturated cases.
3 Experiment
3.1 Apparatus
A schematic of the experimental apparatus designed and used in this work is shown in Fig.1. The experimental apparatus can be divided into two units. These units are designed to provide environmental conditions for THF-hydrate synthesis and to perform parameter measurements in the experiments, and they are named the environment simulation unit and the parameter measurement unit, respectively. The environment simulation unit comprises a sample vessel and an air bath incubator; while the parameter measurement unit comprises a temperature measurement part and an electrical impedance measurement part. The temperature measurement part includes a resistance temperature detector (RTD) sensor, a transmitter, and a data acquisition card. The impedance measurement part includes an impedance analyzer and the accompanying cables. The cables connect the impedance analyzer to the sample and a control computer.

Fig.1 Schematic of the experimental apparatus for hydrate synthesis and parameter measurement.
The air bath incubator shown in Fig.1 is used to provide an appropriate temperature, through which the sample temperature deviates no more than 0.25℃ from the desired setting value. Fig.2 shows the sample vessel and associated electrodes. The sample vessel takes the form of a cylinder and is made of acrylic material for electrical insulation and convenient observation purposes. A blind flange is used at each of the two ends of the sample vessel to obtain a cylindrical shape for the unconsolidated sand in experiments.The diameter and length of the cylindrical sample are 40 mm and 120 mm, respectively. A temperature sensor was inserted into the sample through the hole on the side of the sample vessel. Four electrodes (including two current electrodes and two potential electrodes) made from copper were used to realize a four-electrode scheme for impedance measurement. The current electrodes are disk-shaped and fixed on the two blind flanges. The thickness and diameter of the current electrodes are 1.0 mm and 40 mm, respectively. Two ring-shaped electrodes, serving as potential electrodes, are allocated on the sample vessel between the two current electrodes. The potential electrodes have a thickness of 2.0 mm and are separated by 110 mm.
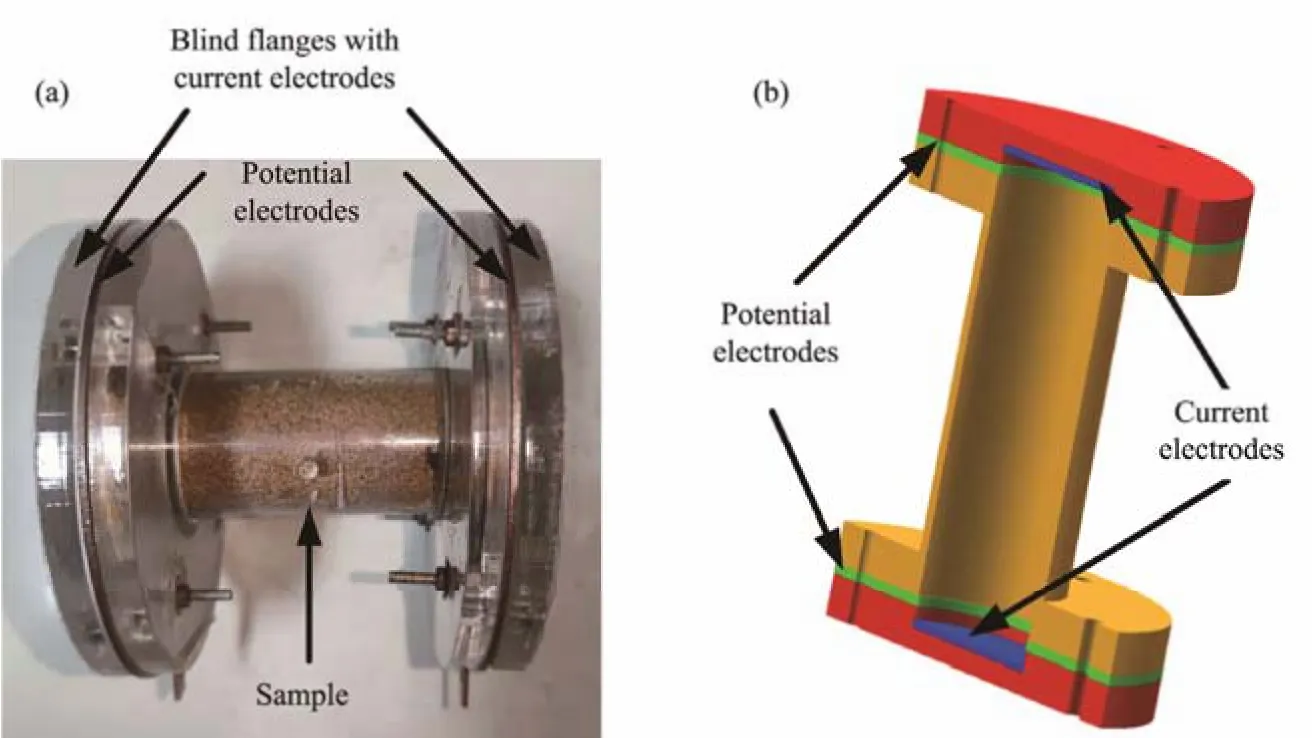
Fig.2 Photo and schematic of the sample vessel and electrodes. (a), photo; (b), sche matic.
The electrical impedance of the sample in the sample vessel is measured with a Zurich MFIA (multi-frequency impedance analyzer). The MFIA measures the impedance with basic uncertainty of 0.05% over a range of 1 Ω to 1 MΩ for frequencies from DC to 500 kHz. The MFIA can be controlled through LabOne software and the Universal Serial Bus protocol. The temperature sensor for monitoring the sample temperature in real time has an uncertainty of less than 0.15℃. A transmitter converts the output of the temperature sensor into a current signal, which is then transformed into a voltage signal by a converter. The voltage signal representing the temperature in the sample vessel is then sampled and transmitted to the control computer through a DAQ (data acquisition) card. The DAQ card with model number PCI-1747U is configured for sampling the temperature data at a frequency of 1 kS s−1. The parameters of the instruments (e.g., MFIA and PCI-1747U) can be configured freely, and the collected data can be processed and then displayed graphically on the control computer using LabOne software and the measurement/control software developed based on LabVIEW (Xinget al., 2020).
The complex conductivityσ*is the reciprocal of the complex resistivityρ*(in Ω m). It can be calculated using the measured electrical impedanceZ*and the geometrical factorKg(Zhanget al., 2017; Xinget al., 2022), as shown in Eq. (14).Kgcan be obtained by dividing the cross-sectional area of the tested sample by length.
In the work of Permyakovet al. (2017), the same measurement scheme as in this work (i.e., the AMNB fourelectrode method) was adopted to measure the electrical conductivity of HBS, but a different design of the probe including the four electrodes was used. A plastic tube served as the backbone of the electrical probe, on which four ring-shaped brass electrodes were sleeved. The backbone and brass electrode had diameters of 3 and 4 mm, respectively. The electrical probe had to be inserted into the hydrate-bearing samples under testing. Understandably, the insertion operation of the probe introduces disturbances to the tested samples. The probe occupies a certain amount of space, which may vary the compaction state of unconsolidated sediments. The backbone of the probe may attract more hydrates forming around it, which can result in an unpredictable and artificial distribution of hydrates in the samples. Furthermore, the size of the sensitivity space(i.e., the distribution space of electrical current) can only be estimated as approximately half the distance between the two current electrodes (Permyakovet al., 2017). The uncertainty in the estimated sensitivity space propagates into the results for the measured electrical conductivity because of the direct effect of the sensitivity-space size on the geometrical factor used for converting the electrical impedance to resistivity. Although the uncertainty in the geometrical factor can be reduced through calibration of the electrical probe, the discrepancy of the current distribution between the standard medium used in the calibration and the tested hydrate-bearing samples still introduces considerable measurement errors. In this work, as illustrated in Fig.2, the current and potential electrodes take disk and ring shapes,respectively. Compared with the above electrical probe, no appreciable disturbance is introduced to the test samples of the four electrodes, and the electrical current can be restricted to the cylindrical samples of known sizes. The uncertainty in the resultant measurements of electrical conductivity can be minimized because of the merits of the electrode configuration in this work.
3.2 Materials and Conditions
Most of the accumulated gas hydrates worldwide are hosted in fine-grained sediments. Two typical core samples,i.e., SH-2 and SH-7, retrieved from the Shenhu area of the South China Sea (SCS), were analyzed by Liuet al. (2012).The clay fractions in the two samples are 8.3% and 0.4%,respectively, and the fraction of fine grains composed of silty sand and clay is approximately 53% in sample SH-2.The sediments of SH-2 have been classified as silty fine sand (Shepard, 1954). The analyses of more samples from the Pearl River Mouth Basin, other sites in the Shenhu area, and the Qiongdongnan Basin of the SCS have shown even finer HBS (Liuet al., 2015, 2017; Weiet al., 2019).As reported by Wanget al. (2011) and Liuet al. (2017),fine grains generally account for more than 80% of the cores, and the clay fraction can reach as high as 20%. In the experiments of this work, a mixture of clay minerals and natural sea sand is employed to mimic the unconsolidated clayey sediments. The particle size used in these experiments ranges from 180 to 250 μm, which can be categorized as fine sand as proposed by Shepard (1954). The fine sand is used to mimic the fine-grained sediments in the field. To consider the effects of clay minerals on the complex-conductivity responses of HBS, montmorillonite with a median diameter of 2.6 μm is used to represent clays in the experiments.
Tetrahydrofuran (THF) hydrate has been synthesized in laboratories as a proxy for NGH. The effectiveness of this substitution has been demonstrated in many studies (Pearsonet al., 1986; Leeet al., 2007; Yunet al., 2007; Santamarina and Ruppel, 2008; Corteset al., 2009; Permyakovet al., 2017; Dugarovet al., 2019; Liuet al., 2019;Wuet al., 2021; Zhanget al., 2022). The hydrate saturation (Shfrom 0 to 1) of the simulated clayey sediments in the experiments is calculated from the THF consumed to form hydrate based on the chemical formula of THF hydrate(i.e., C4H8O·17H2O). In this work, the hydrate saturationShof the clayey samples is obtained by computingSw(i.e.,water saturation), as shown in Eq. (15).
wheremw(in g) andmTHF(in g) are the initial pore-water mass and THF mass added to the tested sample, respectively;MwandMTHFare the molar masses of the pore water and THF, respectively (Mw= 18 g mol−1,MTHF= 72 g mol−1);ρw(in g mL−1) is the pore-water density;Vs(in mL)is the bulk volume of the clayey sample; andφ(dimensionless) is the porosity of the clayey sample.
Importantly, the calculation of hydrate saturation by Eq.(15) is performed based on the following assumptions: all the THF in the solution is converted into THF hydrate;the chemical formula of THF hydrate is C4H8O·17H2O;and the mass loss of THF during the experimental operations due to evaporation is minor and can be neglected. Because of the difficulties of accurately quantifying the THF conversion rate, hydration index, and lost THFin situ, the above assumptions must be made in the data interpretation of this work. The deviation of the real state of the tested samples from the assumptions may result in uncertainties in the reference values of hydrate saturation. Several measures have been taken to alleviate the adverse effects of deviations from the above assumptions in the sample preparation process, as detailed in Section 3.3.
3.3 Sample Preparation and Electrical Test
1) Preparation of sediment and pore fluid
A mixture of montmorillonite and natural sea sand was used to simulate the clayey sediment. A certain amount of montmorillonite (i.e., 5% and 10% by volume in this work)is mixed with the filtered dry sand. The pore water is simulated by the NaCl aqueous solution, which is prepared using deionized water and pure NaCl. To ensure that the salinity of the remaining pore water for different hydrate saturations remains the same,i.e., 2.0%, different mass fractions of NaCl in the initial pore water are prepared. The mass fraction of NaCl in the initial pore water used for hydrate saturations of 0.50, 0.60, 0.70, 0.80, and 0.90, is 1.05%, 0.85%, 0.64%, 0.43%, and 0.21%, respectively.The pore fluid includes the pore water and THF,i.e., the THF solution. The pore fluid is prepared by mixing a proper amount of pure THF with the pore water prepared above.The required amount of pure THF can be calculated with reference to Eq. (15).
2) Loading of clayey sediment and THF solution
The simulated clayey sediment,i.e., the mixture of sand and montmorillonite, is added to the sample vessel layer by layer to form the sediment matrix with the least heterogeneity. After each addition of a layer, an appropriate amount of the pore fluid is slowly injected into the clayey sediments to ensure that the sand/clay mixture has been fully saturated and the pore fluid is distributed evenly. Finally, the mixture of sand and montmorillonite is compacted using the blind flanges at the two ends. A certain amount of the pore fluid may be extruded from the sample vessel through the hole for temperature sensor installation. This occurrence indicates that the mixture has been oversaturated. The porosity can be determined in this process by calculating the amount of pore fluid remaining in the sample. The above operations are conducted as quickly as possible, and the open end of the sample vessel is kept closed whenever possible to reduce the evaporation of the THF in the pore fluid.
3) Measurement of the electrical impedance spectrum
A low temperature,i.e., −2.0℃ in this work, is set for the controller of the air bath incubator. Then, the hydrate formation stage in the simulated clayey sediments is initialized. The electrical impedance spectrum (EIS) is acquired during hydrate formation and decomposition processes.Because of the long test time required for low frequencies(e.g., mHz), the frequency used for dynamic tests is limited to 1 Hz to 500 kHz. However, to obtain more data with a larger range of frequencies, the EIS of hydrate-bearing samples is measured at 0.01 Hz to 500 kHz at the end of the hydrate formation process. The EIS measurement is repeated every 30 min until no obvious change is found between the last two measurements. At this moment, it is believed that the tested sample reaches a thermodynamic equilibrium state, and the reaction process from THF to hydrate is completed.
Fig.3 demonstrates the time traces of the measured temperature and in-phase conductivity at a set of frequencies in the hydrate formation and decomposition processes. In this example, the clay content is 5%, and the hydrate saturation is 0.90. The entire hydrate formation and dissociation process has four stages (i.e., from (a) to (d), as shown in Fig.3). In Stage (a), the temperature decreases from room temperature, and there is no obvious hydrate. In this stage,a small amount of hydrate may have formed, as indicated by the change in the rate of temperature decrease, which can be attributed to the ion exclusion effect. In Stage (b),the hydrate forms at a high rate and is followed by a slower formation process. The formation of THF hydrate is roughly completed, and the hydrate may undergo an Ostwald ripening process (Clennellet al., 1999; Chen and Espinoza,2018; Leiet al., 2019a, b) in Stage (c). The hydrate decomposes in Stage (d), as indicated by the temperature curve.
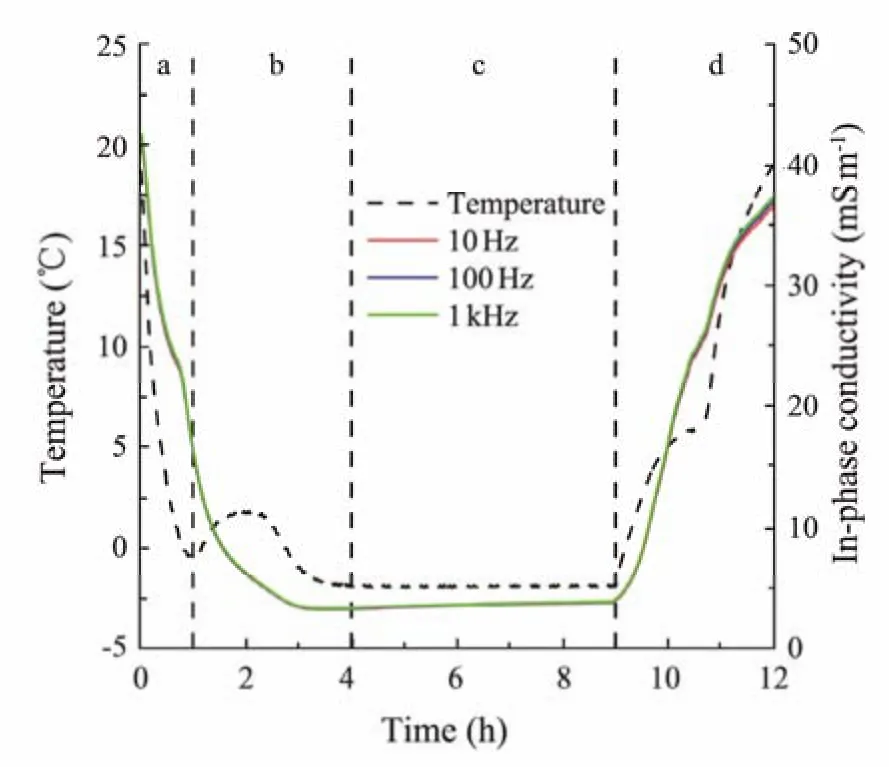
Fig.3 Variations in the measured temperature and in-phase conductivities in hydrate formation and decomposition processes for a clay content of 5% and a hydrate saturation of 0.90.
4 Results
4.1 Clay Effect on Complex Electrical Conductivity
To demonstrate the clay effect on the complex-conductivity properties of HBS, the complex-conductivity spectra for typical clayey sand and clean sand are analyzed below.Fig.4 shows variations in the in-phase conductivity and quadrature conductivity of HBS at frequencies ranging from 0.01 Hz to 1 kHz. A typical hydrate saturation of 0.50 was selected, and then the clayey sand and clean sand cases were compared. The in-phase conductivity of the clayey sand with a clay content of 10% becomes smaller than that of the clean sand, while the quadrature conductivity is greater for the clayey sand.
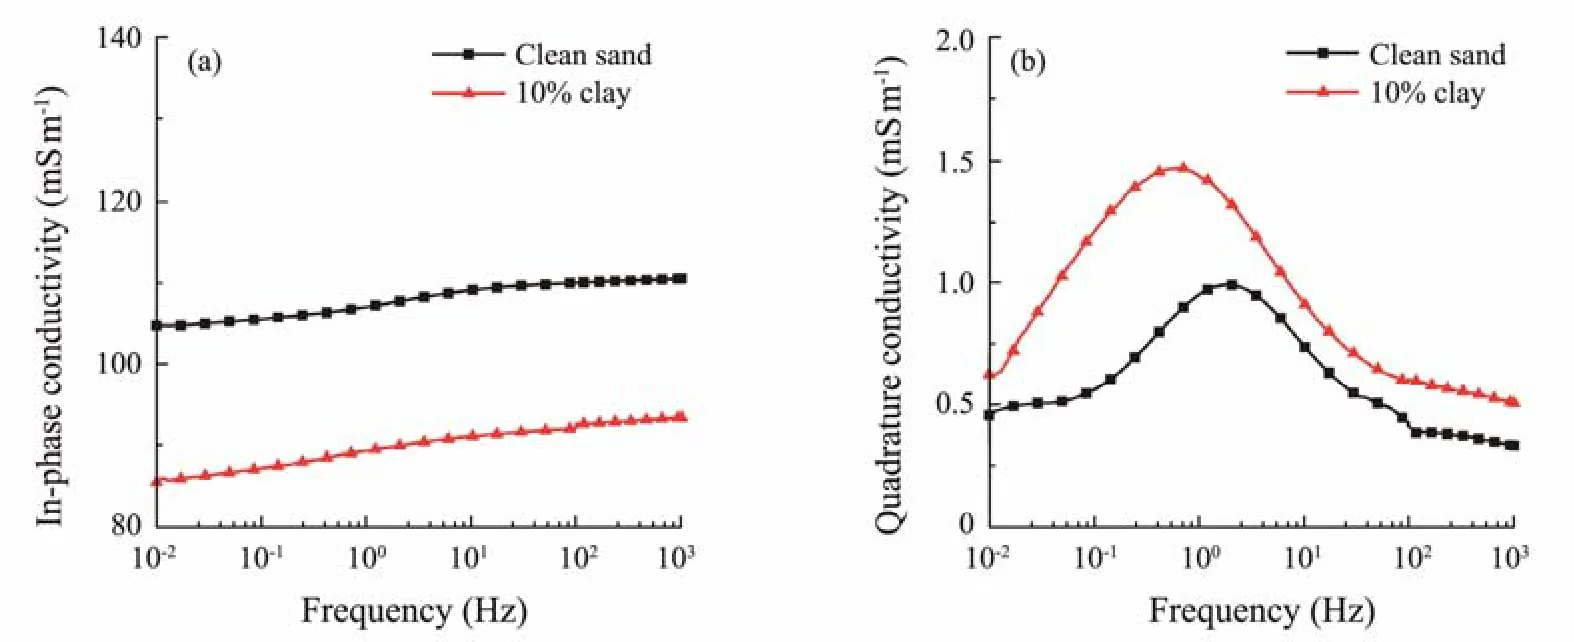
Fig.4 Complex-conductivity spectra of hydrate-bearing sediments for clayey sand and clean sand with a clay content of 10% and hydrate saturation of 0.50. (a), in-phase conductivity; (b), quadrature conductivity.
The in-phase conductivity describes the electrical conductance mechanism after applying an electric field. The bulk conductance of HBS can be attributed to two factors,i.e., the solid and liquid phases. The solid phase includes the sand and clay particles coated by EDL. The conductivity of clay particles plays an essential role in the bulk conductance of the sediments due to the high CEC of clay.The clay mineral used in the experiment is montmorillonite, which has a much higher CEC than that of illite and kaolinite. In the hydrate-bearing clayey case, the clay mineral affects bulk conductance in two ways. One is that the adsorbed cations on clay particles elevate the conductance of the solid phase because of the excess exchangeable cations. In contrast, the other way is that some of the clay dispersed in the void space blocks the pores or throats to some extent, reducing the flow path for the electrical current and thus decreasing the conductance. Furthermore, the montmorillonite exhibits considerable swelling behavior due to the entrance of water molecules into the inner layer of clay particles. In the experiment of this work, the blockage effect is envisaged as superior to the conductance elevation effect when the clay is 10%. Consequently, the inphase conductivity of the hydrate-bearing clayey sediment with a higher fraction of montmorillonite in the clayey sand case becomes lower than that of the clean sand case.This finding is consistent with the results reported by Ostermanet al.(2019) that with increasing clay content in the distribution mode of dispersed clay, the in-phase conductivity of porous media increases first and then decreases.
In this work, the quadrature conductivity represents the polarization mechanism under the application of a lowfrequency electric field. In the hydrate-bearing clayey case,the contribution to the bulk quadrature conductivity comes mainly from the surface quadrature conductivity of solid particles. The amount of counterions adsorbed on the surface of clay particles is much higher than that of sand particles. According to the expression (Eq. (16)) proposed by Revil (2013) to calculate the quadrature surface conductivity for unsaturated cases, the quadrature conductivity is higher for hydrate-bearing clayey sediment than for clean sand due to the much higher surface site density (smaller characteristic time constant (τ0), and smaller effective diameter of solid particles (denoted as, an average of the diameters of sand and clay particles).
To show the hydrate-saturation effects on the complex conductivity of clayey sediments, the complex-conductivity spectra of the clayey sediments with various saturations are analyzed below. The variations in the in-phase conductivity and quadrature conductivity of hydrate-bearing clayey sediments with frequency are demonstrated in Fig.5. A typical clay content of 5% is presented, and the hydrate saturation ranges from 0.50 to 0.90. Fig.5 shows that the in-phase conductivity and quadrature conductivity decrease consistently with increasing hydrate saturation.
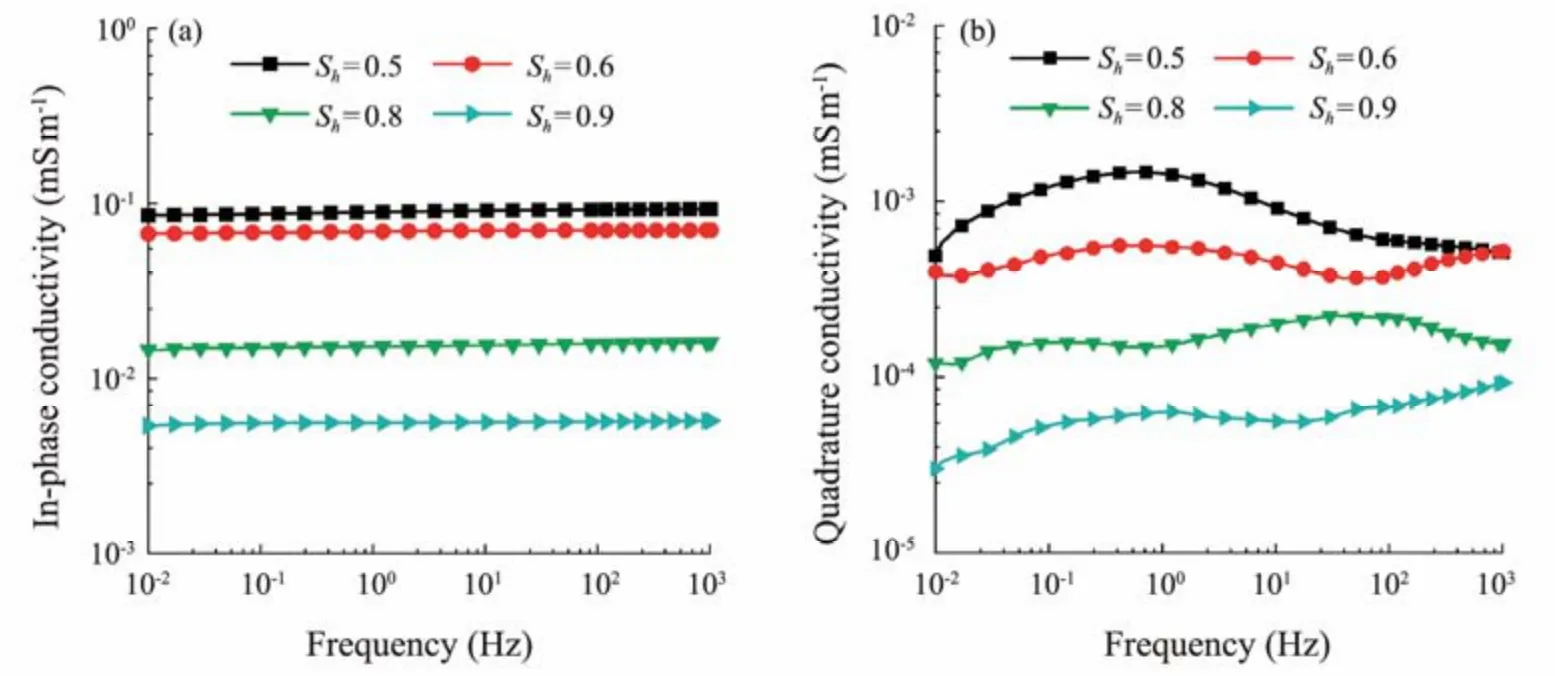
Fig.5 Complex-conductivity spectra of hydrate-bearing sediments for clayey sand and clean-sand cases (with a clay content of 5% in the clayey cases). (a), in-phase conductivity; (b), quadrature conductivity.
With increasing hydrate saturation, increasingly more fluid in the pore space is gradually substituted by the THF hydrate. This substitution contracts the conductance path of the electrical current in the pore space. The conductivity of the hydrate is as low as 50 μS m−1(du Franeet al., 2011),which is considerably lower than that of the pore water(near 1.49 S m−1at 0℃) in the experiment. Therefore, a consistent decrease in the bulk in-phase conductivity of hydrate-bearing clayey sediments (as shown in Fig.5) with increasing hydrate saturation is a reasonable result (Schmutzet al., 2012; Xinget al., 2021, 2022). Theoretically,the EDL polarization mechanism dominates in the tested frequency range used in this work,i.e., lower than 1 kHz.The quadrature surface conductivity can be quantified by multiplying the correction factor (1−Sh)pwith that of water-saturated cases according to Eq. (16). A decreasingsσ′ with increasingShcan be confirmed by experimental measurements as shown in Fig.5.
4.2 Saturation from the Simandoux Equation
The Simandoux equation (Simandoux, 1963) is used to consider the clay effects and evaluate the hydrate saturation in sediments. Archie’s formula is believed to apply only to sandstones or clean sand (Archie, 1942; Caiet al.,2017); however, it is also tested in the clayey cases of this work for comparison. The indexI(dimensionless) of electrical conductivity is calculated by dividing the in-phase conductivity (tσ′) of HBS by that of the saturated clean sand. According to Archie’s law, Eqs. (17) and (18) can be obtained by timing the intrinsic formation factorFand conductivity indexI.
wherem(dimensionless) is the cementation exponent, andn(dimensionless) is the saturation exponent. Fig.6 shows the variation inmwith the test frequency. It can be seen thatmvaries slightly with frequency. An average value(m= 1.412) is used for the calculation below. Fig.7 shows a linear fitting operation for deriving the saturation exponent(n) in Eq. (18) based on experimental data. From Fig.7, the saturation exponent is 1.879 (R2= 0.999). Therefore, Eq. (19)can be employed to derive the hydrate saturation (Sh) of sediments of clean sands with known in-phase conductivity.

Fig.6 Cementation exponent (m) changes with the tested frequency.

Fig.7 Linear fitting operation for deriving the saturation exponent (n) based on experimental data.
The Simandoux equation indicates that the conductivity of the clayey sediment can be obtained by summing the conductivities of the pore water and clay minerals. The bulk conductivity of clayey sediments can be computed with Eq. (20).
whereσ0denotes the bulk conductivity of clayey sands saturated with water,Vclrepresents the clay fraction by volume in clayey sands, andσclandσsdare the conductivity of water-saturated clay and sand, respectively. For unsaturated cases with hydrate present, it is assumed that the pores of the clay contain no hydrate, and the bound-water effects on water saturation can be ignored. The conductivity of hydrate-bearing clayey sands can be expressed as Eqs.(21) – (23).
whereϕeis the effective porosity of clayey sands, andn*andm*are the saturation and cementation exponents, respectively.n*andm*are determined based on experimental data in this work. Fig.8 shows the linear fitting operation for deriving these two exponents. According to the best linear fitting (R2= 0.975), as shown in Fig.8,m*andn*are 1.387 and 1.857, respectively. Thus, Eq. (24) can be used to calculateShfor clayey sediments with known in-phase conductivity.

Fig.8 Linear fitting operation for deriving the cementation and saturation exponents based on experimental data.
4.3 Saturation from Frequency-Dispersion Correlation
To characterize the frequency effects (FEs) on complex conductivity quantitatively, the parameter FE was formulated as Eq. (25) in Vinegar and Waxman (1984).
whereρis the resistivity, andω1andω2represent two frequencies under investigation. In this work,FEis obtained by substituting the resistivity with the in-phase conductivity or the quadrature conductivity, as shown in Eqs. (26)or (27), respectively.
where the parametersFEσ'andFEσ''are computed with the in-phase conductivity and quadrature conductivity, respectively, andfHandfLdenote the two frequencies, where the subscriptsHandLdenote the higher frequency and lower frequency, respectively.
TheFEparameters calculated with the in-phase conductivity and quadrature conductivity are plotted against hydrate saturation in a log-log scale in Fig.9. Both FE parameters decrease with increasing hydrate saturation. In this work, two pairs offHandfLfor calculating theFEparameters are selected for demonstration and modeling. Linear correlations (as shown by Eqs. (28) and (29)) are derived through a linear fitting of the experimental data based on the least squares principle in the log-log plot.
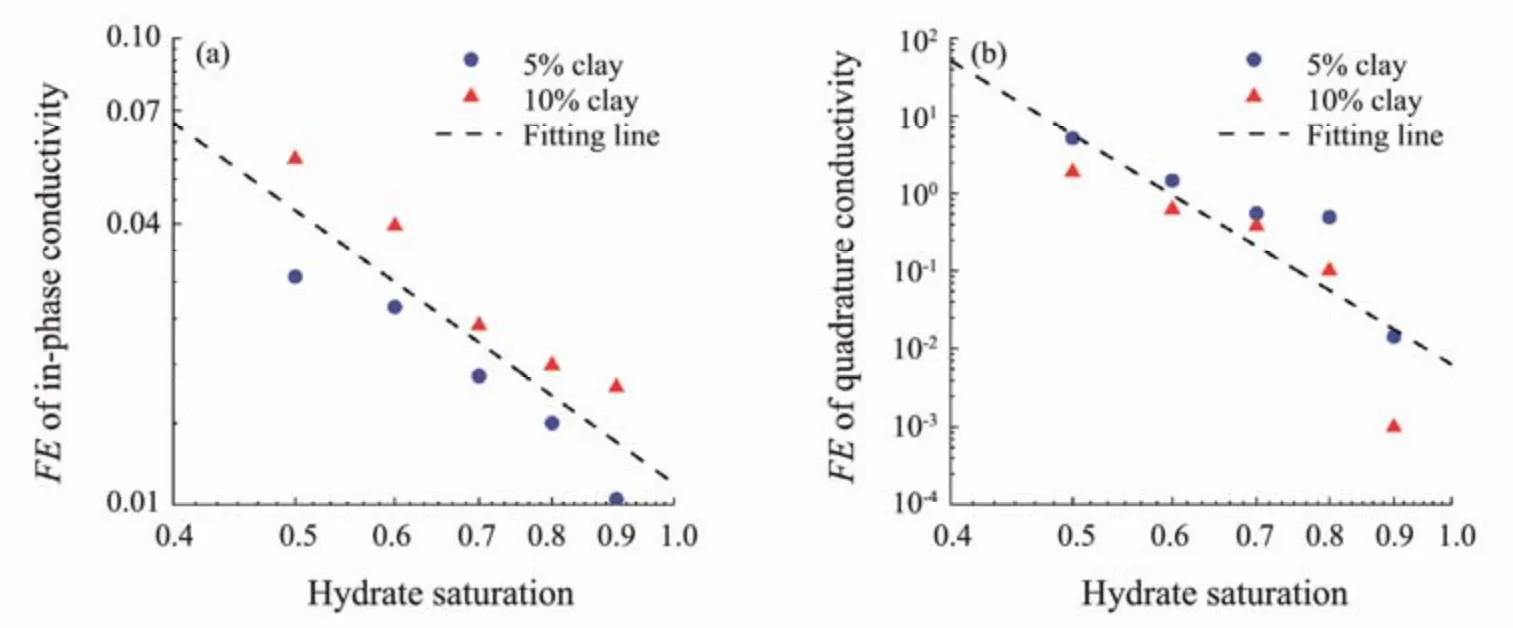
Fig.9 Linear fitting operation (in a log-log plot) for deriving correlations between the FE parameters and hydrate saturation.(a), in-phase conductivity; (b), quadrature conductivity.
4.4 Saturation from the Cole-Cole Formula
Several phenomenological models have been developed for fitting complex-conductivity measurements (Kemna,2000; Binleyet al., 2005). The CCM was proposed to model the complex dielectric constant. Based on the electrostatic analogy, an expression (Eq. (30)) can be obtained by replacing the complex dielectric constant in the original formula with the complex electrical conductivity.
whereσ0andσ∞represent the low-frequency and highfrequency electrical conductivities, respectively,crepresents the exponent of the CCM, andτccdenotes the central relaxation time. Eq. (30) can be expressed usingσ0and the chargeability (Seigel, 1959; Tarasov and Titov, 2013),as shown in Eq. (31).
Scrutinizing the spectra of complex conductivity reveals that they often have multiple extreme points. Therefore, the second-order Cole-Cole formula is used to fit the measured complex conductivity spectra in this work, as shown by Eq.(32).
Optimization algorithms are necessary for fitting the complex-conductivity spectra (Liet al., 2019). In this study,a genetic algorithm (GA) is adopted to derive the parameters of the second-order CCM based on experimental data.This GA does not depend on initial values and has a fast convergence speed, which is suitable for solving complex optimization problems,e.g., parameter inversion through a fitting of the complex-conductivity spectra. Fig.10 presents the frequency-dispersive spectra of the in-phase conductivity and quadrature conductivity from the fitted CCM and experimental data. In this case, the hydrate saturation and clay content are 0.50% and 5%, respectively. The determination coefficients of the best fitting are 0.999 and 0.951 for the in-phase conductivity and quadrature conductivity, respectively.
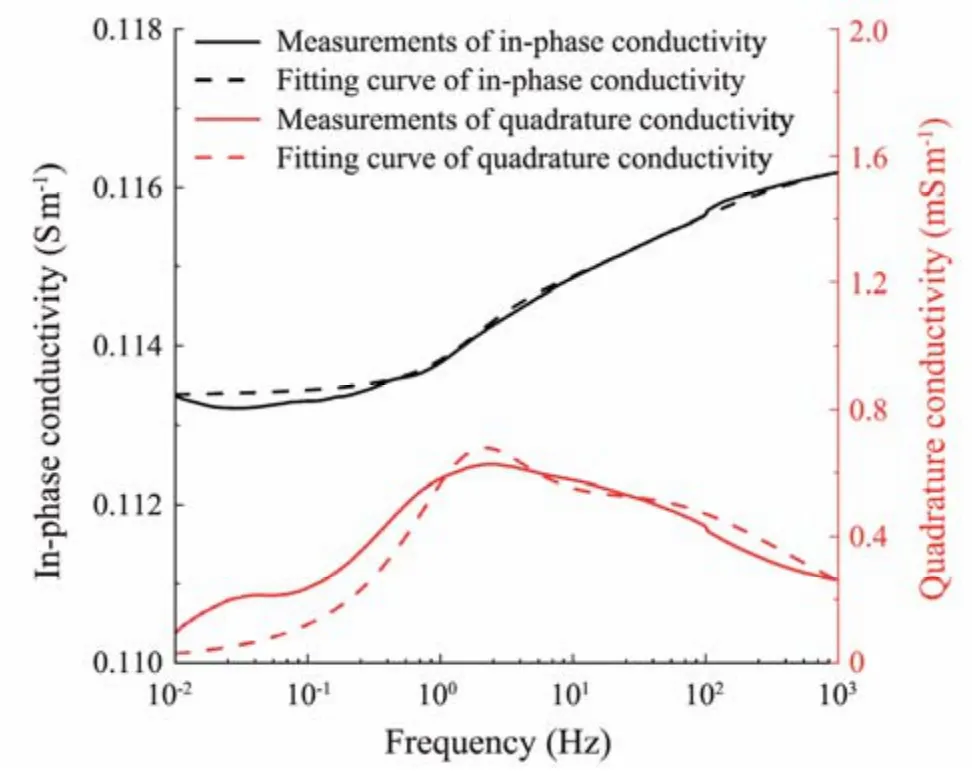
Fig.10 Comparison of the frequency-dispersive spectra of in-phase conductivity and quadrature conductivity from the fitted Cole-Cole model and experimental measurements.
There are two pairs of characteristic time and chargeability, denoted as (τcc1,mcc1) and (τcc2,mcc2), which correspond to two distinct polarization processes. The characteristic time and chargeability for different HBS with clay contents of 5% and 10% are presented in Fig.11. The model parameters (τcc1,mcc1) and (τcc2,mcc2) behave differently.Clearly, a correlation between the model parameters (τcc1,mcc1) andShcan be derived, while the parameters (τcc2,mcc2)exhibit scattered behavior. Therefore, the parameters (τcc1,mcc1) are correlated with the hydrate saturation in this work.Linear correlations (Eqs. (33) and (34)) can be obtained through the best fitting based on the least squares principle. These correlations were then used as hydrate-evaluation models.

Fig.11 Characteristic time and chargeability of different hydrate-bearing sediments with clay contents of 5% and 10%. (a),relaxation time τcc1; (b), relaxation time τcc2; (c), chargeability mcc1; (d), chargeability mcc2.
4.5 Performance of the Saturation Evaluation Methods
The hydrate saturation of clayey sediments in the experiments is evaluated using the three methods (called hydrate saturation models) presented in Sections 4.2 – 4.4, respectively. The relative error (ER) of the model estimation of hydrate saturation is computed with Eq. (35). In addition,the root-mean-square error (ERMS) as expressed by Eq. (36)is calculated for each model.ERMSis adopted to quantify model performances as a whole, as opposed to specific hydrate saturation points byER.
whereShmodandShexpare the estimated saturations from the models and reference values in the experiments, respectively,Nrepresents the total number of the tested saturations, andidenotes theith test point. The model estimations of hydrate saturation are compared with the reference values, as demonstrated in Figs.12 – 14. TheERof the model estimations is listed in Tables 1 – 3, andERMSis presented in the text below.
1) Method based on Archie’s formula and the Simandoux equation
Only the in-phase conductivity of the clayey sediments is used for hydrate saturation evaluation in the methods based on Archie’s formula and the Simandoux equation (Eqs. (19)and (24), respectively). A range of frequencies from 0.01 Hz to 1 kHz is covered because of the slight frequency effects on the in-phase conductivity. TheERof the modelestimated hydrate saturation from Archie’s formula and the Simandoux equation is compared in Fig.12 and Table 1 and shown to be reduced by introducing the clay-effect correction in the Simandoux equation for most test points.ERranges from 0.9% to 7.2% and from 0.9% to 2.9% for Archie’s formula and the Simandoux equation, respectively.Furthermore,ERMSis 3.9% and 1.8% for Archie’s formula and the Simandoux equation, respectively. The lower errors of hydrate saturations estimated by the Simandoux equation show that the clay effects on the in-phase conductivity of hydrate-bearing clayey sediments must be considered (Caiet al., 2017).
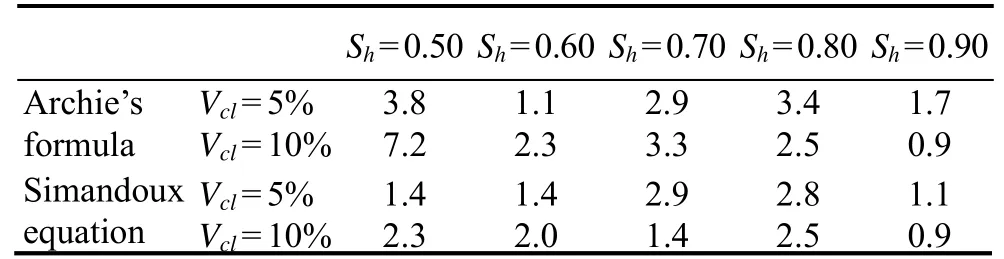
Table 1 ER (in %) of estimated Sh from the methods based on Archie’s formula and the Simandoux equation
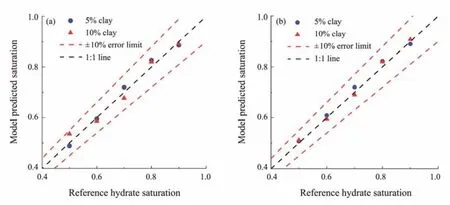
Fig.12 Comparison of hydrate saturation between the model estimation and the reference (Archie’s formula and the Simandoux equation). (a), Archie’s formula; (b), Simandoux equation.
2) Method based on frequency-dispersion correlations
The in-phase conductivity and quadrature conductivity are used to evaluate hydrate saturation in the methods based on the frequency-dispersion correlations (Eqs. (28) and (29)).The two correlations take the FE parameters of in-phase conductivity and quadrature conductivity as inputs, which are denoted asFEσ'correlation andFEσ''correlation, respectively. Fig.13 and Table 2 show thatERof hydrate saturations estimated by the two correlations is generally larger than those estimated by the Simandoux equation.ERranges from 4.2% to 18.4% and from 1.1% to 33.3% for theFEσ'correlation andFEσ''correlation, respectively. TheERMSvalues for the two correlations are 11.6% and 13.2%, respectively. The higher errors from both FE correlations demonstrate their inferior performance, which is confirmed by the lowerR2values of Eqs. (28) and (29).
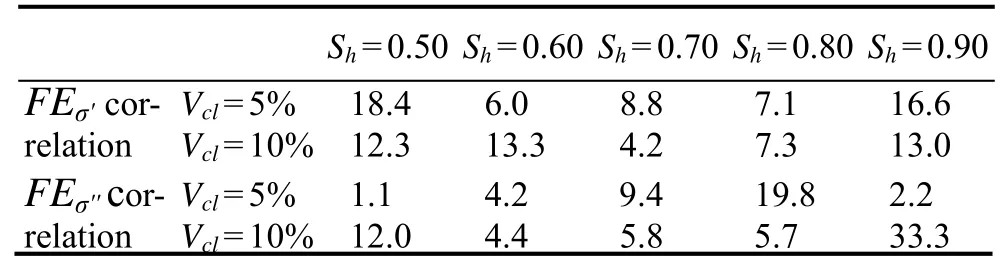
Table 2 ER (in %) of estimated Sh from the methods based on frequency-dispersion correlations

Table 3 ER (in %) of estimated Sh from the methods based on the Cole-Cole formula

Fig.13 Comparison of hydrate saturation between the model estimation and the reference (frequency-dispersion correlations).(a), FE correlation of in-phase conductivity; (b), FE correlation of quadrature conductivity.
3) Method based on the Cole-Cole formula
The in-phase conductivity and quadrature conductivity are used separately in the frequency-dispersion correlations.In contrast, in the method based on the Cole-Cole formula,the entire complex-conductivity spectra integrating the inphase conductivity and quadrature conductivity are employed. As indicated in Eqs. (33) and (34), the two correlations take the inverted Cole-Cole parameterτcc1andmcc1as input,respectively. Thus, these two parameters have fused the information from the in-phase conductivity and quadrature conductivity. Fig.14 and Table 4 show thatERof hydrate saturations estimated by the two correlations is located between those estimated by theFEcorrelations and the Simandoux equation.ERranges from 0.8% to 12.5% and from 2.9% to 17.0% for theτcccorrelation andmcccorrelation,respectively. TheERMSvalues for the two correlations are 5.05% and 9.05%, respectively. An improved performance for estimating the hydrate saturation has been obtained compared with that of the FE correlations.
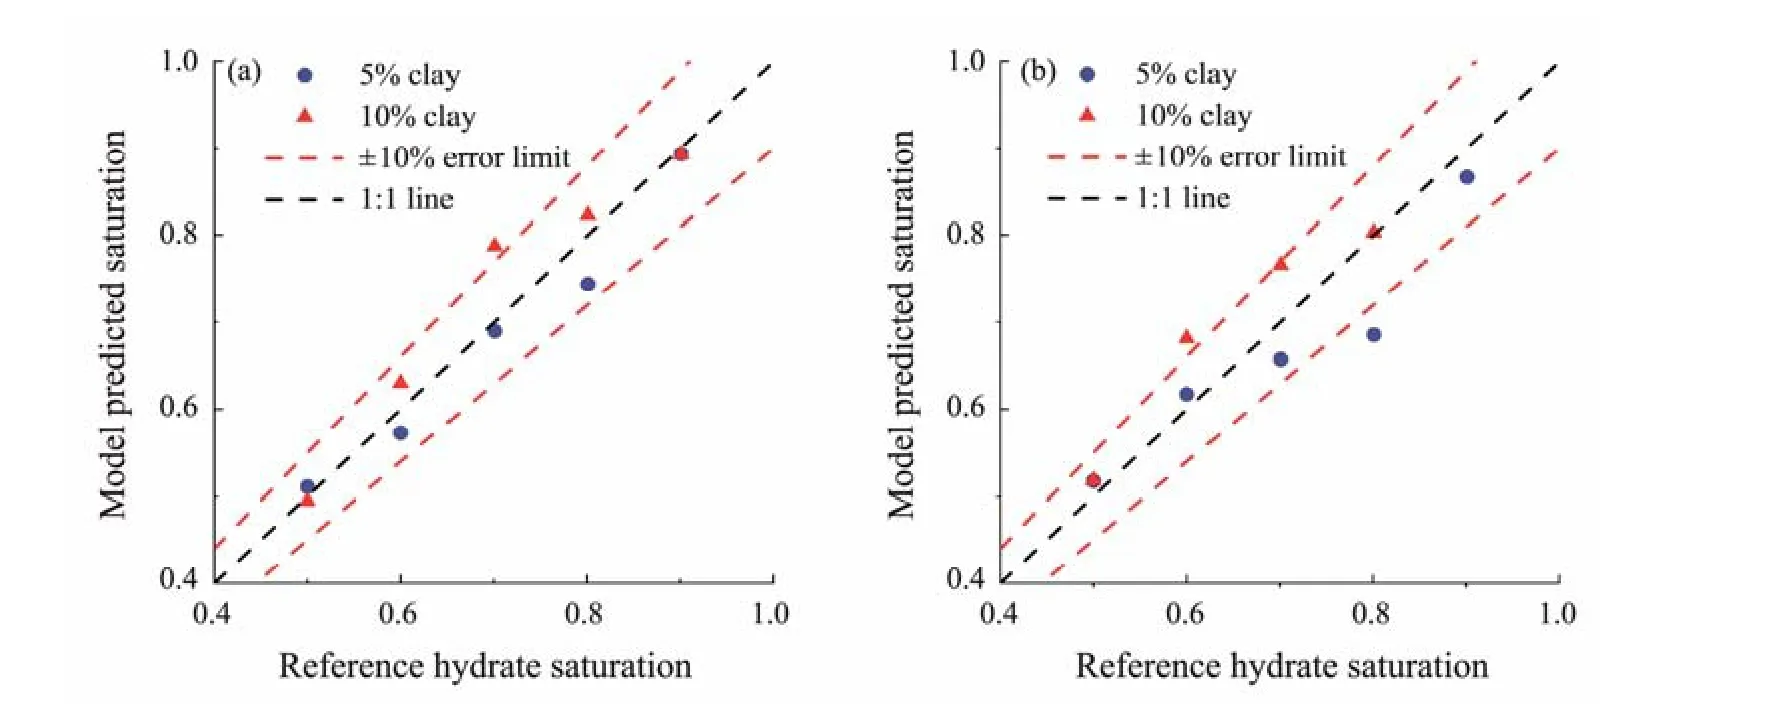
Fig.14 Comparison of hydrate saturation between the model estimation and the reference (Cole-Cole formula). (a), τcc correlation; (b), mcc correlation.
5 Discussion
5.1 Effects of Clay Type and Distribution on Complex Conductivity
The electrical properties of clayey sediments are influenced by the mineral types, volumetric faction, and spatial distribution of clays. Three types of minerals (i.e., smectite,illite, and kaolinite) dominate the clay component in natural HBS (Maet al., 2020; Liu and Li, 2021; Renet al.,2022). Various distribution forms are found for clays in the sediments or rocks,e.g., dispersed clay, laminated clay,structural clay, and coating clay, as reported in works such as de Lima and Sharma (1990), Okayet al. (2014), Revilet al. (2015), and Huet al. (2019).
In the experiments of this work, montmorillonite (one subtype of smectite), which has much higherCECthan other common clay minerals (e.g., illite and kaolinite), was used as a representative of clays. Moreover, the montmorillonite also exhibits remarkable swelling behavior due to the entrance of water molecules into the inner layer of clay particles. The higherCECcan enhance the low-frequency polarization strength (e.g., the Stern layer polarization), which can be confirmed by the higher quadrature conductivity for cases with higher clay content, as presented in Fig.4(b). It is also accepted that the clay brings about additional conductance; however, the considerable swelling behavior of the montmorillonite results in considerable blockage effects on the paths of the conduction current. Therefore, there is a competing mechanism between the conductance enhancement and reduction effects induced by the montmorillonite. As indicated in Fig.4(a), with only a small fraction(e.g., 10% by volume) of montmorillonite in the HBS, a substantial reduction of conductivity can be observed. Considering the lowerCECand less or negligible swelling behavior of illite and kaolinite, we may understand that the elevation of low-frequency polarization strength can be alleviated and the competing status between conduction enhancement and reduction can be altered using illite and kaolinite as the clay minerals in HBS instead. Therefore,care should be taken when extending the use of the hydrateevaluation models presented in Section 4 to hydrate-bearing clayey sediments of illite and kaolinite.
In the experiments of this work, it is speculated that the montmorillonite takes a hybrid distribution form, including the dispersed, structural, and coating forms in the simulated HBS. This situation can be acceptable because the clay distribution in natural sediments or rocks usually takes various forms, even at the core scale. Direct evidence to support this hybrid distribution form is that the porosity reduction is smaller than that corresponding to the volume fraction of the montmorillonite added to clean sand. For example, the porosities of the clean sand and clayey sands with clay volume fractions of 5% and 10% are 0.40, 0.39,and 0.36, respectively. According to the experimental procedure presented in Section 3.3, it is difficult to ensure that the clay remains to take a single distribution form. However, in the process of preparing the simulated clayey sediments in the experiments, efforts were taken to try to obtain homogeneous samples for the electrical tests. First,the sands and montmorillonite were well-mixed through a stirring operation in a container with a wide mouth. Second,the mixture of sand and montmorillonite was gradually added to the sample vessel layer by layer, and a compaction operation with a rubber rod and a subsequent injection of the THF solution immediately followed each addition of a layer of the mixture. To summarize, it is believed that the samples of clayey sediments prepared and tested for the complex-conductivity spectra in this work are homogeneous, although a hybrid distribution form of clays may exist in the simulated sediments. The effects of clay distribution forms on the low-frequency electrical properties of HBS merit dedicated experimental work in the future.
5.2 Limitations of FE Parameters and Correlations
As presented in Section 4.3, theFEparameters are calculated based on the measured in-phase and quadrature conductivities and are denoted asFEσ'andFEσ'', respectively. Then, these twoFEparameters are correlated withShas power-law models. A test of theFEcorrelations (as hydrate-saturation evaluation models) with experimental data shows that the root-mean-square error of the estimated hydrate saturation is 11.6% and 13.2% for different clay contents less than 10%. The errors are considerably higher than those obtained from the Simandoux equation and slightly higher than those from the Cole-Cole formula, as demonstrated in Section 4.5. Issues with theFEparameters for characterizing the complex-conductivity properties of hydrate-bearing clayey sediments and the resultant limitations of theFEcorrelations for estimating the hydrate saturation are identified and discussed below.
The first issue to be noted is how to select an appropriate pair offHandfLto calculate theFEparameter. Eqs. (26)and (27) show that theFEparameter describes the fractional ratio of the change in the electrical quantities (e.g.,the in-phase conductivity and quadrature conductivity in this work) between any two frequencies.FEvaries withfHorfL, and no theoretical guideline is available for properly choosing them yet. Presently, these two frequencies are mainly selected based on experience. Thus, more theoretical and experimental work is required to determine how and why to use a certain pair of frequencies for calculating theFEparameters.
The second issue is that two measurements must be used to calculate the value of theFEparameter. From the perspective of uncertainty propagation theory, the uncertainty of theFEparameters results from at least two measurements (at a higher frequency and lower frequency) of the electrical quantity (i.e., the in-phase conductivity and quadrature conductivity in this work). Compared with that in the Simandoux equation and Archie’s formula, where only one measurement of the in-phase conductivity is used,higher uncertainty can be introduced using two measurements of the in-phase conductivity for theFEparameters andFEcorrelations. This claim can be confirmed by the highly scattered relationship between theFEparameters andSh, as indicated in Fig.9, and the lowerR2values of the best fittings, as shown in Eqs. (28) and (29). At present, the use ofFEcorrelations to evaluate hydrate saturation accurately remains challenging because of the intrinsic multisource uncertainties therein.
6 Conclusions
The complex conductivity of THF hydrate-bearing clayey sediments was measured at frequencies ranging from 0.01 Hz to 1 kHz. The clay effects on complex conductivity were analyzed experimentally and theoretically. Hydrate saturation evaluation models were developed based on the Simandoux equation, frequency-dispersion correlations, and the Cole-Cole formula. The model performance was assessed and analyzed based on experimental data.
1) The in-phase conductivity and quadrature conductivity of HBS with 10% clay mineral (montmorillonite as a representative) become smaller and larger than those of clean sand, respectively. The in-phase conductivity with 10% clay drops because of a competition between the conductance reduction and elevation mechanisms resulting from the clay-swelling-induced blockage effect and ion migration in EDL on the surface of clay particles, respectively. The quadrature conductivity increases with clay content because of the increased surface site density of counterions in EDL. The in-phase conductivity and quadrature conductivity decrease consistently with increasing hydrate saturation. With more water in the pores substituted by hydrate,the conductance path for the electrical current in the pore water shrinks consistently. In the low-frequency range (e.g.,< 1 kHz), the EDL polarization dominates and the quadrature surface conductivity can be quantified by multiplying the correction factor (1−Sh)pwith that of water-saturated cases.
2) The hydrate-evaluation model based on the Simandoux equation outperforms Archie’s formula, demonstrating the necessity of accounting for the clay effects on the in-phase conductivity. TheFEcorrelations based on the inphase and quadrature conductivities exhibit inferior performance in estimating the hydrate saturation. It remains challenging to select an appropriate pair of frequencies and reduce the uncertainties from the two measurements when calculating theFEparameters. The second-order Cole-Cole formula can be used to fit the measured complex-conductivity spectra of hydrate-bearing clayey sediments. One pair of the inverted Cole-Cole parameters,i.e., the characteristic time and chargeability, can be used to correlate with the hydrate saturation well.
Acknowledgements
This work is supported by the Fundamental Research Funds for the Central Universities (No. 20CX05005A),the Major Scientific and Technological Projects of CNPC(No. ZD2019-184-001), the PetroChina Innovation Foundation (No. 2018D-5007-0214), the Shandong Provincial Natural Science Foundation (No. ZR2019MEE095), and the National Natural Science Foundation of China (No. 4217 4141).
杂志排行

Journal of Ocean University of China的其它文章
- Using Natural Radionuclides to Trace Sources of Suspended Particles in the Lower Reaches of the Yellow River
- Eutrophication of Jiangsu Coastal Water and Its Role in the Formation of Green Tide
- Evaluation of the Shallow Gas Hydrate Production Based on the Radial Drilling-Heat Injection-Back Fill Method
- Microstructure Characterization of Bubbles in Gassy Soil Based on the Fractal Theory
- Morphological and Sulfur-Isotopic Characteristics of Pyrites in the Deep Sediments from Xisha Trough, South China Sea
- Deformation Characteristics of Hydrate-Bearing Sediments