Genetic Analysis of Structural Styles in the Makran Accretionary Wedge – Insight from Physical Simulations
2024-03-12SHAOLongfeiYUFushengGONGJianmingLIAOJingYUZhifengTANGLiangCHENJiangongWANGYuefengandNENGYuan
SHAO Longfei , YU Fusheng , , GONG Jianming, LIAO Jing, YU Zhifeng ,TANG Liang , CHEN Jiangong , WANG Yuefeng , and NENG Yuan
1) School of Earth Sciences, China University of Petroleum, Beijing 102249, China
2) State Key Laboratory of Petroleum Resources and Processing, China University of Petroleum, Beijing 102249, China
3) Qingdao Institute of Marine Geology, China Geological Survey, Qingdao 266071, China
4) China University of Petroleum – Beijing at Karamay, Karamay 834000, China
Abstract The Makran accretionary wedge has the smallest subduction angle among any accretionary prism in the world. The factors controlling the spacing and morphological development of its deep thrust faults, as well as the formation mechanism of shallow normal faults, remain unclear. Meanwhile, the factors affecting the continuity of plane faults must be comprehensively discussed. Clarifying the development characteristics and deformation mechanisms of the Makran accretionary wedge is crucial to effectively guide the exploration of gas hydrate deposits in the area. This study aims to interpret seismic data to identify typical structures in the Makran accretionary wedge, including deep imbricate thrust faults, shallow and small normal faults, wedge-shaped piggyback basins, mud diapirs with fuzzy and disorderly characteristics of reflection, décollements with a northward tilt of 1˚ – 2˚, and large seamounts. Physical simulation-based experiments are performed to comprehensively analyze the results of the plane, section, and slices of the wedge. Results reveal that the distances between and shapes of thrust faults in the deep parts of the Makran accretionary wedge are controlled by the bottom décollement. The uplift of the thrust fault-related folds and the upwelling of the mud diapirs primarily contribute to the formation of small normal faults in the shallow part of the area. The mud diapirs originate from plastic material at the bottom, while those that have developed in the area near the trench are larger. Seamounts and mud diapirs break the continuity of fault plane distribution.
Key words Makran accretionary wedge; structural styles; faults distribution; physical simulation
1 Introduction
The Makran accretionary wedge is the result of the subduction of the Arabian Plate beneath the Eurasian Plate. This geological feature spans approximately 1000 km E – W along its strike, with the deformation front located approximately 150 km south of the coastline. A series of relatively parallel imbricate thrust faults have developed in this region(Koppet al., 2000; Cromieet al., 2022). The structural development of the accretionary wedge is complex and features prominent bottom-simulating reflections (BSRs),which are indicative of gas hydrate development. This region is potentially rich in gas hydrates, and their accumulation is closely related to the structural development of the accretionary wedge (Radet al., 2000; Dinget al., 2010;Smithet al., 2014; Gonget al., 2016; Menget al., 2019,2020; Liaoet al., 2022; Qianet al., 2022).
Researchers in the field have provided several opinions on the causes of the structural deformation of the Makran accretionary wedge. Regarding the causes of the arrange ment of plane faults and strike deflection, Gonget al.(2016)claimed that the northward subduction at a small angle formed the parallel arrangement of the E – W direction of thrust faults in the Makran accretionary wedge. Smithet al.(2012) stated that the collision of the Murray Ridge led to a slight deflection of the eastern fault toward the northeast,while Grando and McClay (2007) believed that the formation of diapirs with wedge development was triggered by overpressure generated by the wedge-induced load and the downward subduction of the basement. Research on the deformation law of the thrust faults and their controlling factors under the condition of a small subduction angle is still relatively immature. Smith conducted a statistical comparison of relevant data and concluded that the maximum sedimentary thickness is not the main factor controlling the interval between thrust faults and tectonic deformation(Smithet al., 2012). Thus, factors influencing the spacing between the faults and the style of structural development of the Makran accretionary wedge remain unclear. Moreover, several small normal faults are observed in the shallow part of the region, but the causes of their occurrence are still vague. Thus, this study aims to identify the form of structural development of the Makran accretionary wedge by interpreting seismic data, analyzing the characteristics of the planar distribution of the faults, and exploring the deformation law and evolution mechanism of related structures through physical simulation-based experiments.
2 Geological Setting
The Makran accretionary wedge is located in the northern part of the Arabian Sea at the intersection of the Eurasian, Arabian, and Indian Plates. This area is adjacent to the Zagros and Himalayan collision zones in the west and east, respectively (Burg, 2018). The Makran accretionary wedge results from the northward subduction of the entire Cenozoic Arabian Plate beneath the Eurasian Plate (Fig.1). This geological feature exhibits characteristics such as large sedimentary thickness, low subduction angle (< 5˚),and southward activation of faults (Byrneet al., 1992;Gaedickeet al., 2002; Smithet al., 2012). The Makran accretionary wedge is one of the most extensive subduction complexes on Earth. This wedge is partially exposed in southeastern Iran, southwestern Pakistan, and the northern Arabian Sea. Its dimensions span approximately 1000 km long from west to east and 500 km from north to south(150 and 350 km in the sea and on land, respectively),with a sedimentary thickness exceeding 7000 m (White and Klitgord, 1976; Koppet al., 2000; Kukowskiet al., 2001;McCall, 2002; Gonget al., 2016; Pajanget al., 2021; Cromieet al., 2022). The accretionary wedge and the active continental collision zones (Zagros and Himalayan) are separated by the dextral Minab strike-slip fault system in the west and the sinistral Ornach-Nal strike-slip fault system in the east (Grando and McClay, 2007). This separation phenomenon provides an ideal example for studying processes related to plate boundary subduction, such as front accretion and underplating. The Arabian Plate subducts northward beneath the Eurasian Plate at a rate of 30 – 50 mm yr−1,with the western part subducting at a rate of 3.65 mm yr−1,which is smaller than the eastern part subducting at a rate of 4.2 mm yr−1(as shown by the black arrows in Fig.1a;DeMetset al., 1990). The subduction process began in the early Cretaceous, and the formation of early wedges may have started in the Paleogene. The late Miocene to the early Pliocene is the main accretion period of the Makran accretionary wedge. Since the late Pliocene, the coast and the middle slope of the Makran have experienced uplift and extensional diapirism, while the front accretion of the sea portion has continued to the present (Arthurtonet al.,1982; Harmset al., 1984; Plattet al., 1985; Fruehnet al.,1997; Koppet al., 2000; Liaoet al., 2019).
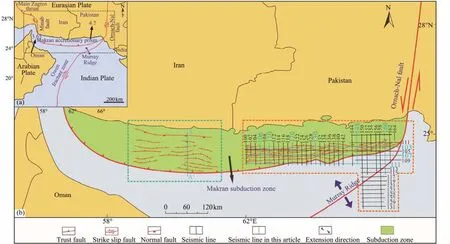
Fig.1 The regional tectonic setting of the Makran subduction zone (Grando and McClay, 2007). Fig.1b is the enlargement of the black dotted box in Fig.1a; the fault distribution in the green dotted box is from Grando and McClay (2007); in the orange dotted line frame is the seismic work area of this paper, the faults distribution reference Smith et al. (2012).
3 Data and Methodology
3.1 Data
This study primarily utilized two-dimensional (2D) seismic reflection data collected by Dr. Gong’s team from the Qingdao Institute of Marine Geology in 2018 to explain the development characteristics of the Makran accretionary wedge. The 2D survey of the wedge covered an area of 54000 km2and comprised a total of 49 seismic lines (Fig.1).The spacing between the N – S seismic lines ranged from 10 km to 15 km, while that between the E – W seismic lines ranged from 10 km to 25 km. Six N – S seismic sections,perpendicular to the strike of the thrust faults, were selected to describe the geometric shape and structural characteris tics of the thrust wedge, and three E – W seismic sections,transverse to the strike of the thrust faults, were chosen to describe the geometric shape and structural characteristics of the seamount. The seismic waves in these sections had a two-way travel time (TWT) of 9 – 10 s (Figs.5 – 7).
3.2 Methodology
The stratigraphic sequence was divided based on the interpretation of the seismic sections (Fig.2), and a total of 24 major thrust faults (F1'– F24'), 23 major basement normal faults (F1– F23), and five seamounts were identified.This information was used to generate a distribution map of the plane faults (Fig.3). The deformation and development of the accretionary wedge were represented using structural and physical simulation-based experiments. A set of comparative experiments was designed by using the control variable method to study the development law and formation mechanism of deep, listric thrust faults and shallow normal faults in the Makran accretionary wedge (Figs.9 – 12). The simulation results were then compared with empirical data from the seismic sections to determine the causes of wedge deformation. Finally, preexisting diaper structures were simulated (Experiment 3) to explore the influence of large-scale diapirs on the development of thrust faults in the study area. The physical simulation-based experiments were conducted in accordance with similarity theory, considering the material of the structures and their forces. Three experiments were performed using dry, loose quartz sand to simulate the crust, and colorless transparent silicone was used to simulate the weak layer of rock at the bottom of the study area. One centimeter in the experimental model represented 1 km of the study area. Table 1 lists specific scale-related parameters.
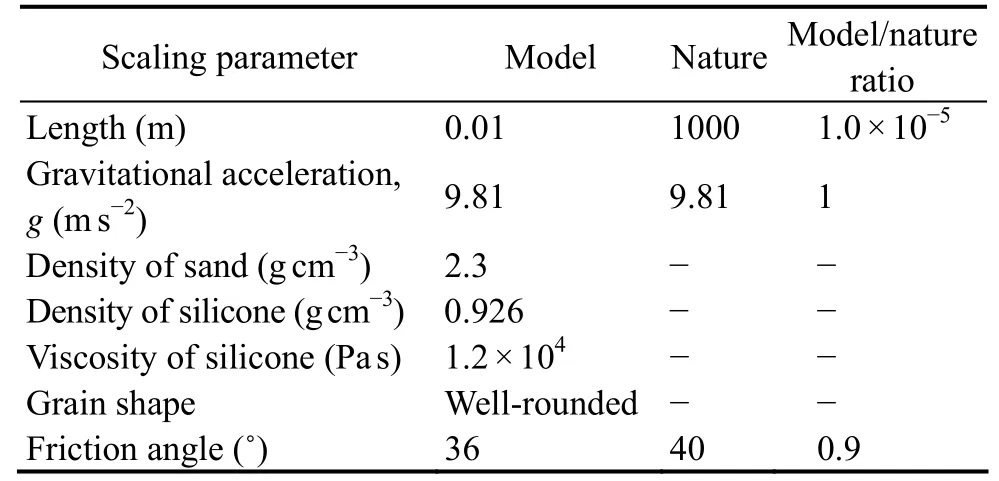
Table 1 Scaling parameters of the analogue models
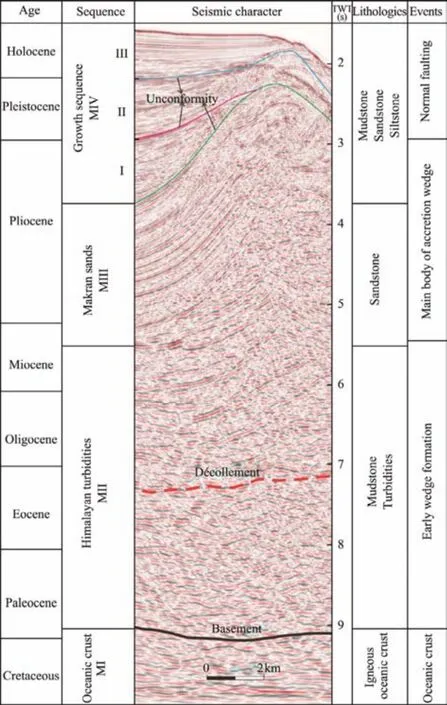
Fig.2 The Makran accretionary wedge sequence. Division standard references Grando and McClay (2007). The section is extracted from seismic line 110. Fig.1 shows the location of seismic line 110.
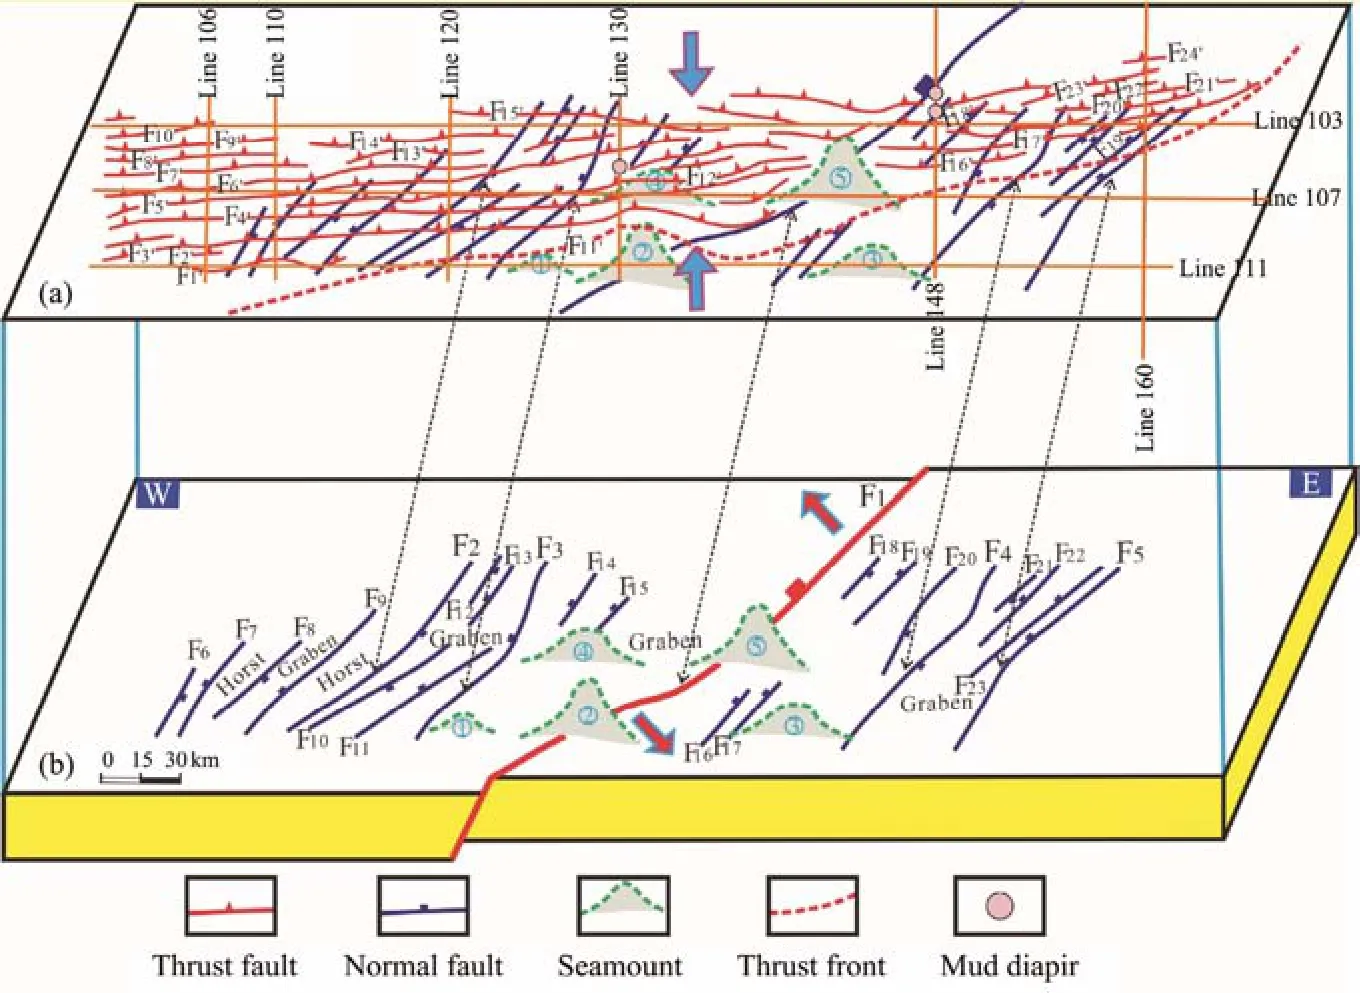
Fig.3 Plane fracture distribution map. (a), red faults are thrust faults of the Makran sands layer, slightly modified from Smith et al. (2012). (b), distribution map of basement normal faults and seamounts.
4 Characteristics of Sequences of the Makran Accretionary Wedge
The Makran accretionary wedge is divided into the following four sedimentary megasequences from deep to shallow: the Oceanic Crust Megasequence MI, Himalayan Turbidites Megasequence MII, Makran Sands Megasequence MIII, and the Growth Megasequence MIV (Grando and McClay, 2007). The Growth Megasequence MIV can be further divided into three smaller sequences based on the unconformity surfaces (Fig.2).
The Oceanic Crust Megasequence MI and the Himalayan Turbidites Megasequence MII are mainly characterized by chaotic reflections with poor continuity in the seismic section. The basement, which serves as the boundary between Megasequences MI and MII, is located at approximately 9 s (TWT) in the seismic section. Megasequence MI mainly corresponds to the initial subduction stage of the Cretaceous Arabian Plate beneath the Eurasian Plate.Megasequence MII corresponds to the formation stage of the early wedge, spanning from the early Paleocene to the late Miocene, and its lithology is characterized by mudstone and turbidites. A décollement roughly parallel to the basement has developed in this megasequence. The Makran sands Megasequence MIII exhibits large amplitude and excellent continuous reflectors that progressively tilt northward. Megasequence MIII corresponds to the main accretion stage of the wedge during the late Miocene to early Pliocene and forms the main body of the Makran accretionary wedge, with a lithology primarily comprising sandstone. The Growth Megasequence MIV exhibits better continuity and denser seismic reflectors than the Megasequence MIII and corresponds to the late Pliocene to the Holocene.The lithology of this megasequence comprises mudstone,sandstone, and siltstone. Megasequences I and II contain typical fan- or wedge-shaped deposits, while Megasequence III contains relatively horizontal deposits that record the evolution of syndepositional faults and folds.
5 Deformation Characteristics of the Makran Accretionary Wedge
5.1 Structural Characteristics in Plane View
The offshore part of the Makran accretionary wedge is 150 km wide and comprises a narrow continental shelf measuring 10 – 15 km in width, a slope with a downward tilt of 1˚– 2˚, and large thrust imbricate fans arranged in parallel(Kukowskiet al., 2001; Schlüteret al., 2002). The thrust faults on the plane are distributed from east to west, demonstrating relatively uniform spacing between them (Fig.1). These thrust faults extend continuously along the front edge, covering a length of approximately 250 km (Smithet al., 2012). The characteristics of the accretionary wedge gradually change as it extends into the eastern part of the subduction zone. This gradual change begins to deflect slightly northward as it approaches the Murray Ridge and the junction of the Eurasian, Arabian, and Indian Plates.
Several NE – SW-trending extensional faults had developed in the eastern part of the study area before subduction (Fig.3). Large-scale grabens were formed between extensional faults F2and F3and between F4and F5, while horsts were formed between faults F7and F8and between F9and F2. These grabens and horsts are distributed alternately. Subsequently, the Cenozoic Arabian Plate subducted northward beneath the Eurasian Plate, resulting in a shift in the main direction of stress in the study area from NW – SE extension to nearly S – N compression, which led to the formation of numerous E – W thrust faults. With continuing subduction, the residual seamounts on the early oceanic crust, including seamounts 1 – 5 (Fig.3), were brought under the accretionary wedge.
5.2 Structural Characteristics of the Section
The interpretation of the S – N seismic section, which spans approximately 120 km in the central and western part of the Makran accretionary wedge, shows its division into five parts (Fig.4). From high to low, these parts are the shelf, upper slope, mid-slope ridge, imbricate zone, and deformation front. Large décollement faults have developed in the shelf zone and extended to the deformation front.A large-scale mud diapir structure has formed between the mid-slope ridge and the upper slope. The interpretation of the S – N seismic composite section (Fig.5), covering approximately 70 km in the eastern part of the study area,indicates that the ridges formed in the front and rear of the Makran accretionary wedge are folds due to fault propagation within the imbricate structure area. The anticline ridges formed by these folds are narrow, with a width of 2– 5 km. The section is asymmetrical and tilts southward,displaying a thrust imbricate structure. The rear wing of the anticline is nearly parallel to the deep thrust fault. These large imbricate thrust faults have inclination angles ranging from 20˚ to 30˚, mostly striking E – W. Most of these faults do not extend to the seabed but are positioned beneath the BSR, parallel to the reflection interface of the seabed. The spacing between faults ranges from 4 km to 12 km, with an average spacing of approximately 6 km. The deep thrust and small normal faults that have developed in the shallow part form channels of relay migration in the longitudinal direction (Gonget al., 2018a; Menget al.,2019). Owing to the continuous accretion of the deformation front and the backward rotation of the rear wedge,the thrust faults that had formed earlier have steepened in the direction toward the land. Small sedimentary basins,which are typical piggyback basins, have developed above the thrust sheet.
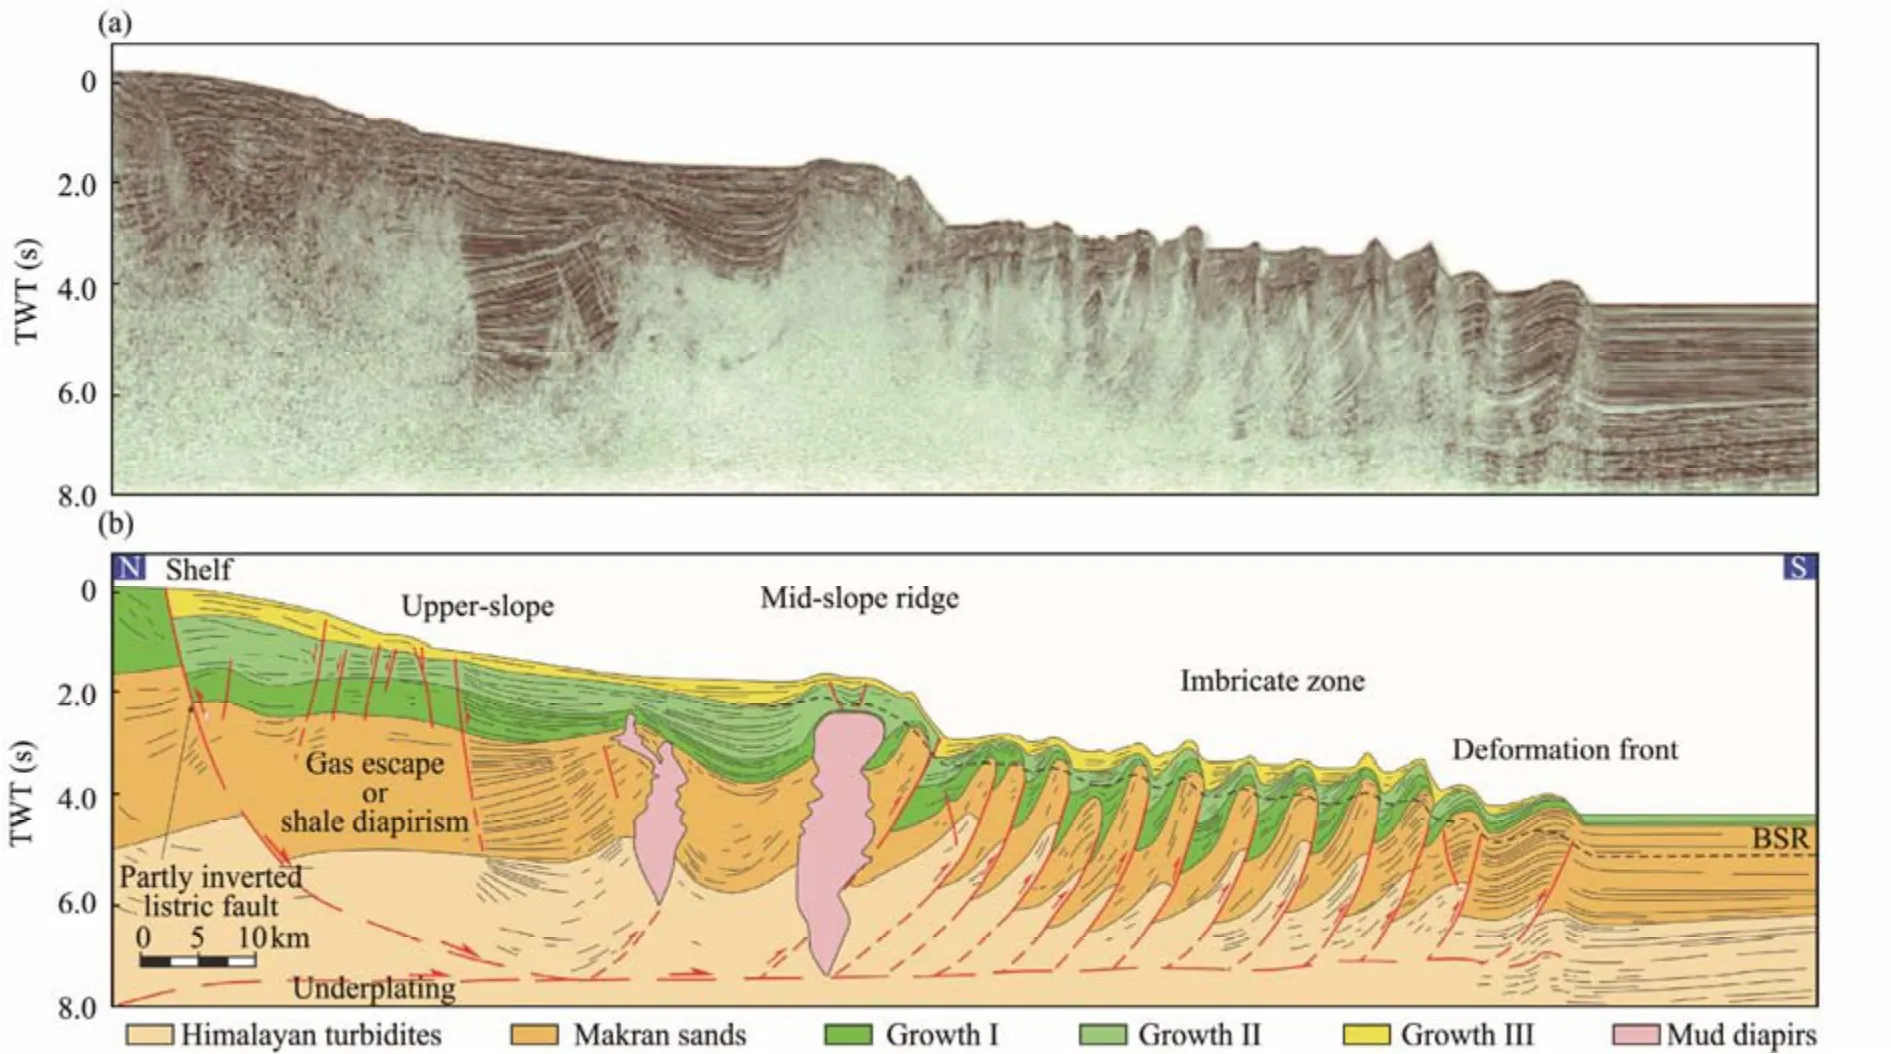
Fig.4 (a), A – A' seismic section in the western segment of the Makran accretionary wedge. (b), interpretation of seismic line in (a). Fig.1 shows the location of the A – A' seismic section, with reference to Grando and McClay (2007). The section crosses the shelf area, the slope basins, and the outermost part of the accretionary wedge.
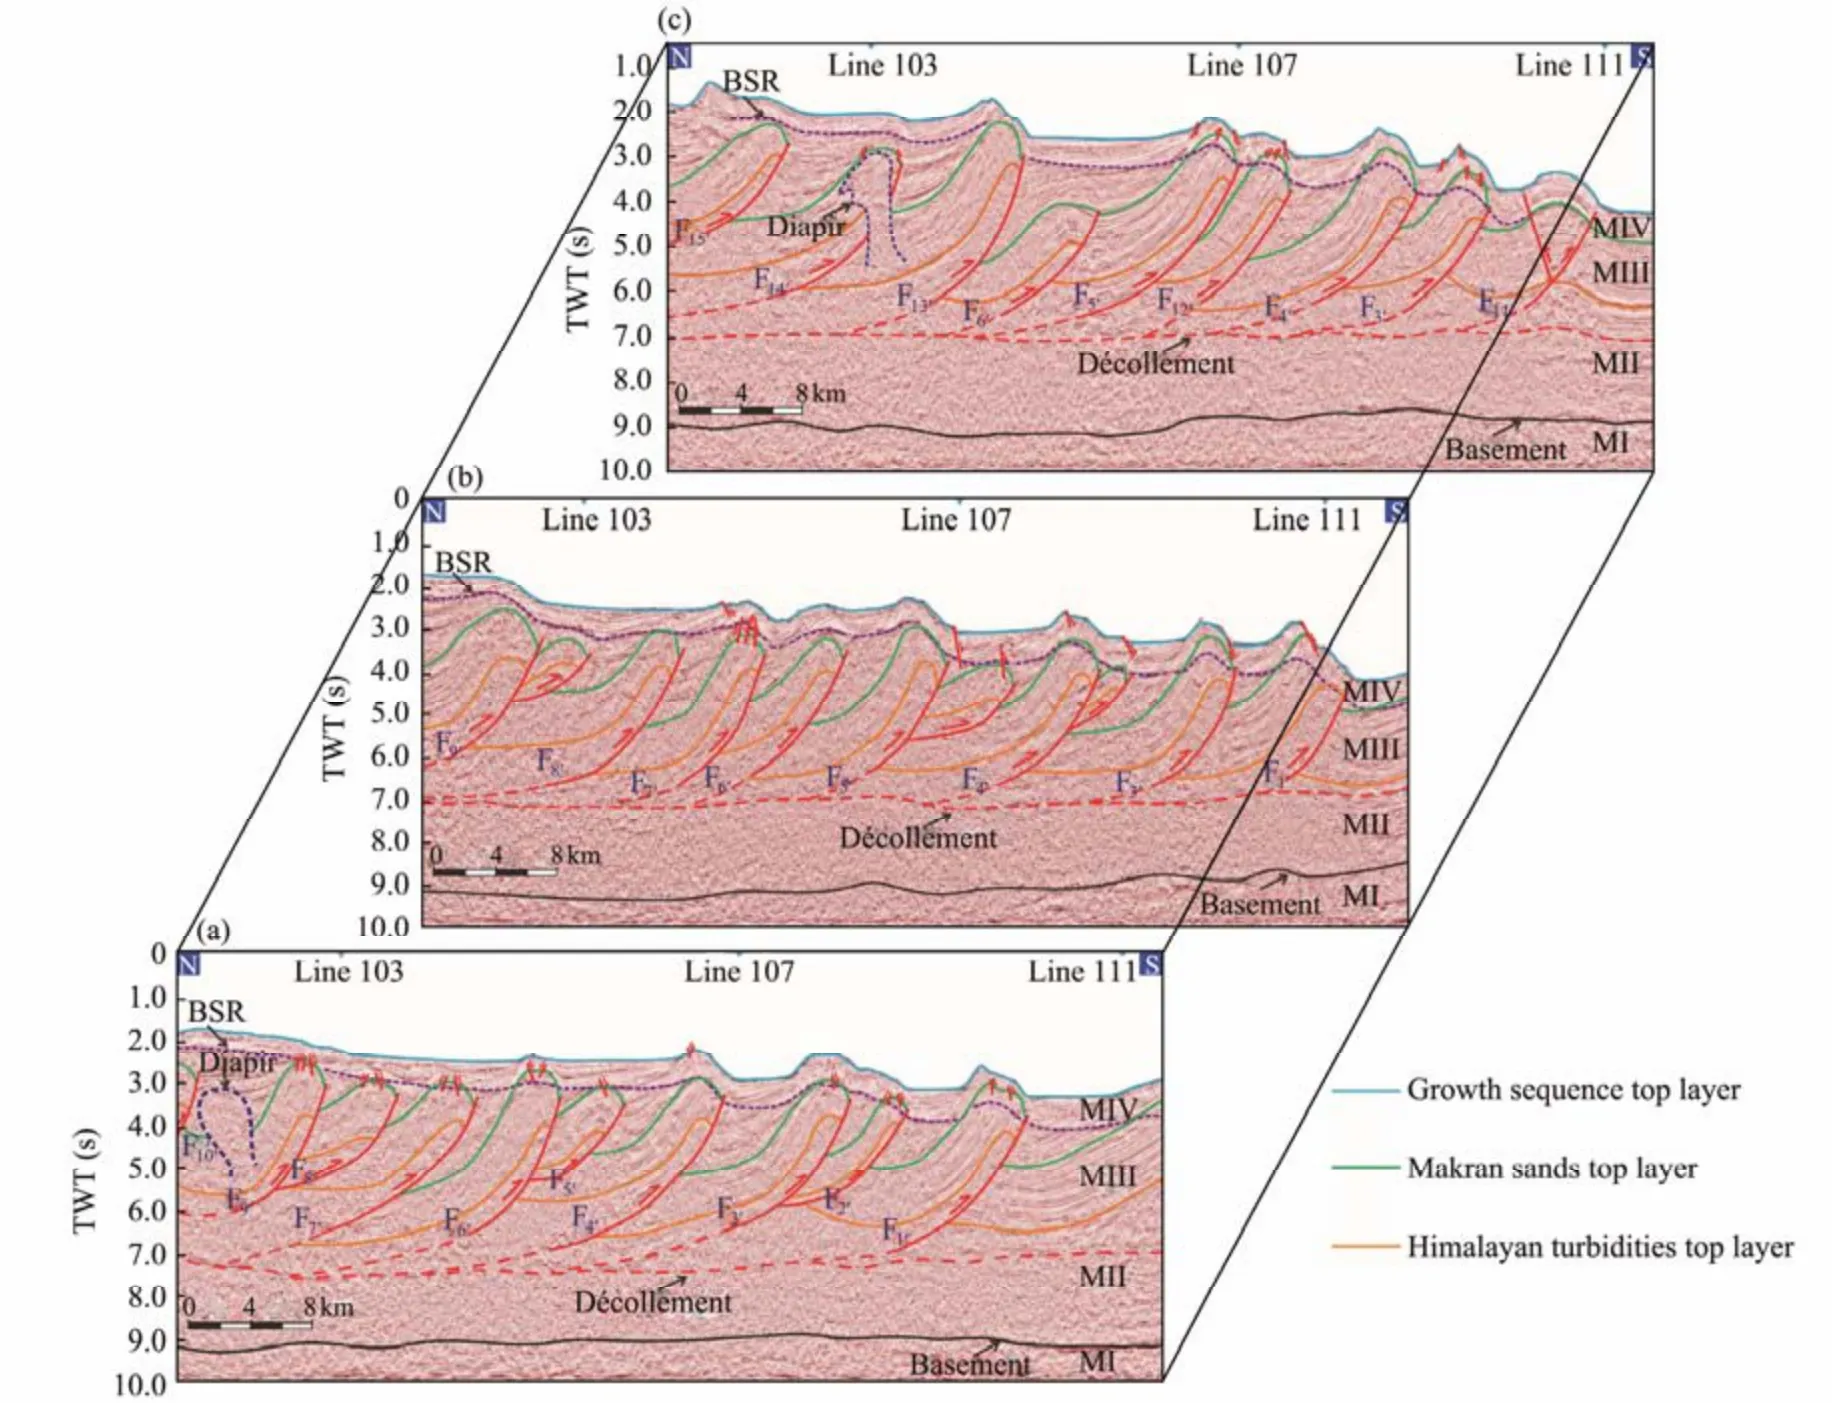
Fig.5 S – N seismic composite sections of the Makran accretionary wedge. (a), line 106 seismic interpretation section. (b),line 110 seismic interpretation section. (c), line 120 seismic interpretation section. Fig.1 shows the locations of seismic lines 106, 110 and 120.
The characteristics of the BSR are prominent, occurring at a depth of 500 – 800 m below the surface and running parallel to the seafloor. The BSR is well developed in the south and north of the Makran accretionary wedge(Minshulland White 1989; Grevemeyeret al., 2000), but its amplitude and continuity in the south are better than those in the north (Figs.5 – 6). The décollement does not exhibit a prominent reflection, but its location is derived by combining the geometric characteristics of the thrust faults,their downward projection, and the sedimentary thickness of the hanging wall. The décollement has formed on the upper surface of the subducted basement sediment and is tilted 1˚– 2˚ northward, running parallel to the basement.Many diapir structures exist in the mid-slope zone and are primarily associated with the development of southward thrust faults, demonstrating a gradually decreasing frequency of occurrence southward. Mud diapirs are a common phenomenon in rapidly deposited, weakly cemented, and overpressured shales under the influence of subduction-related thrusting, faulting, folding, and uplifting (Grando and Mc-Clay, 2007; Gonget al., 2018b).
The structural characteristics of the seismic sections shown in Fig.5 are similar and relatively simple. However,the structural morphology of the S – N seismic section (Fig.6) near the easternmost part has undergone significant changes. First, the number of thrust faults has significantly decreased, from approximately 10 to only approximately 6. Second, the development scale of mud diapirs has significantly increased, and the basement in the southern part of the section exhibited a prominent uplift.
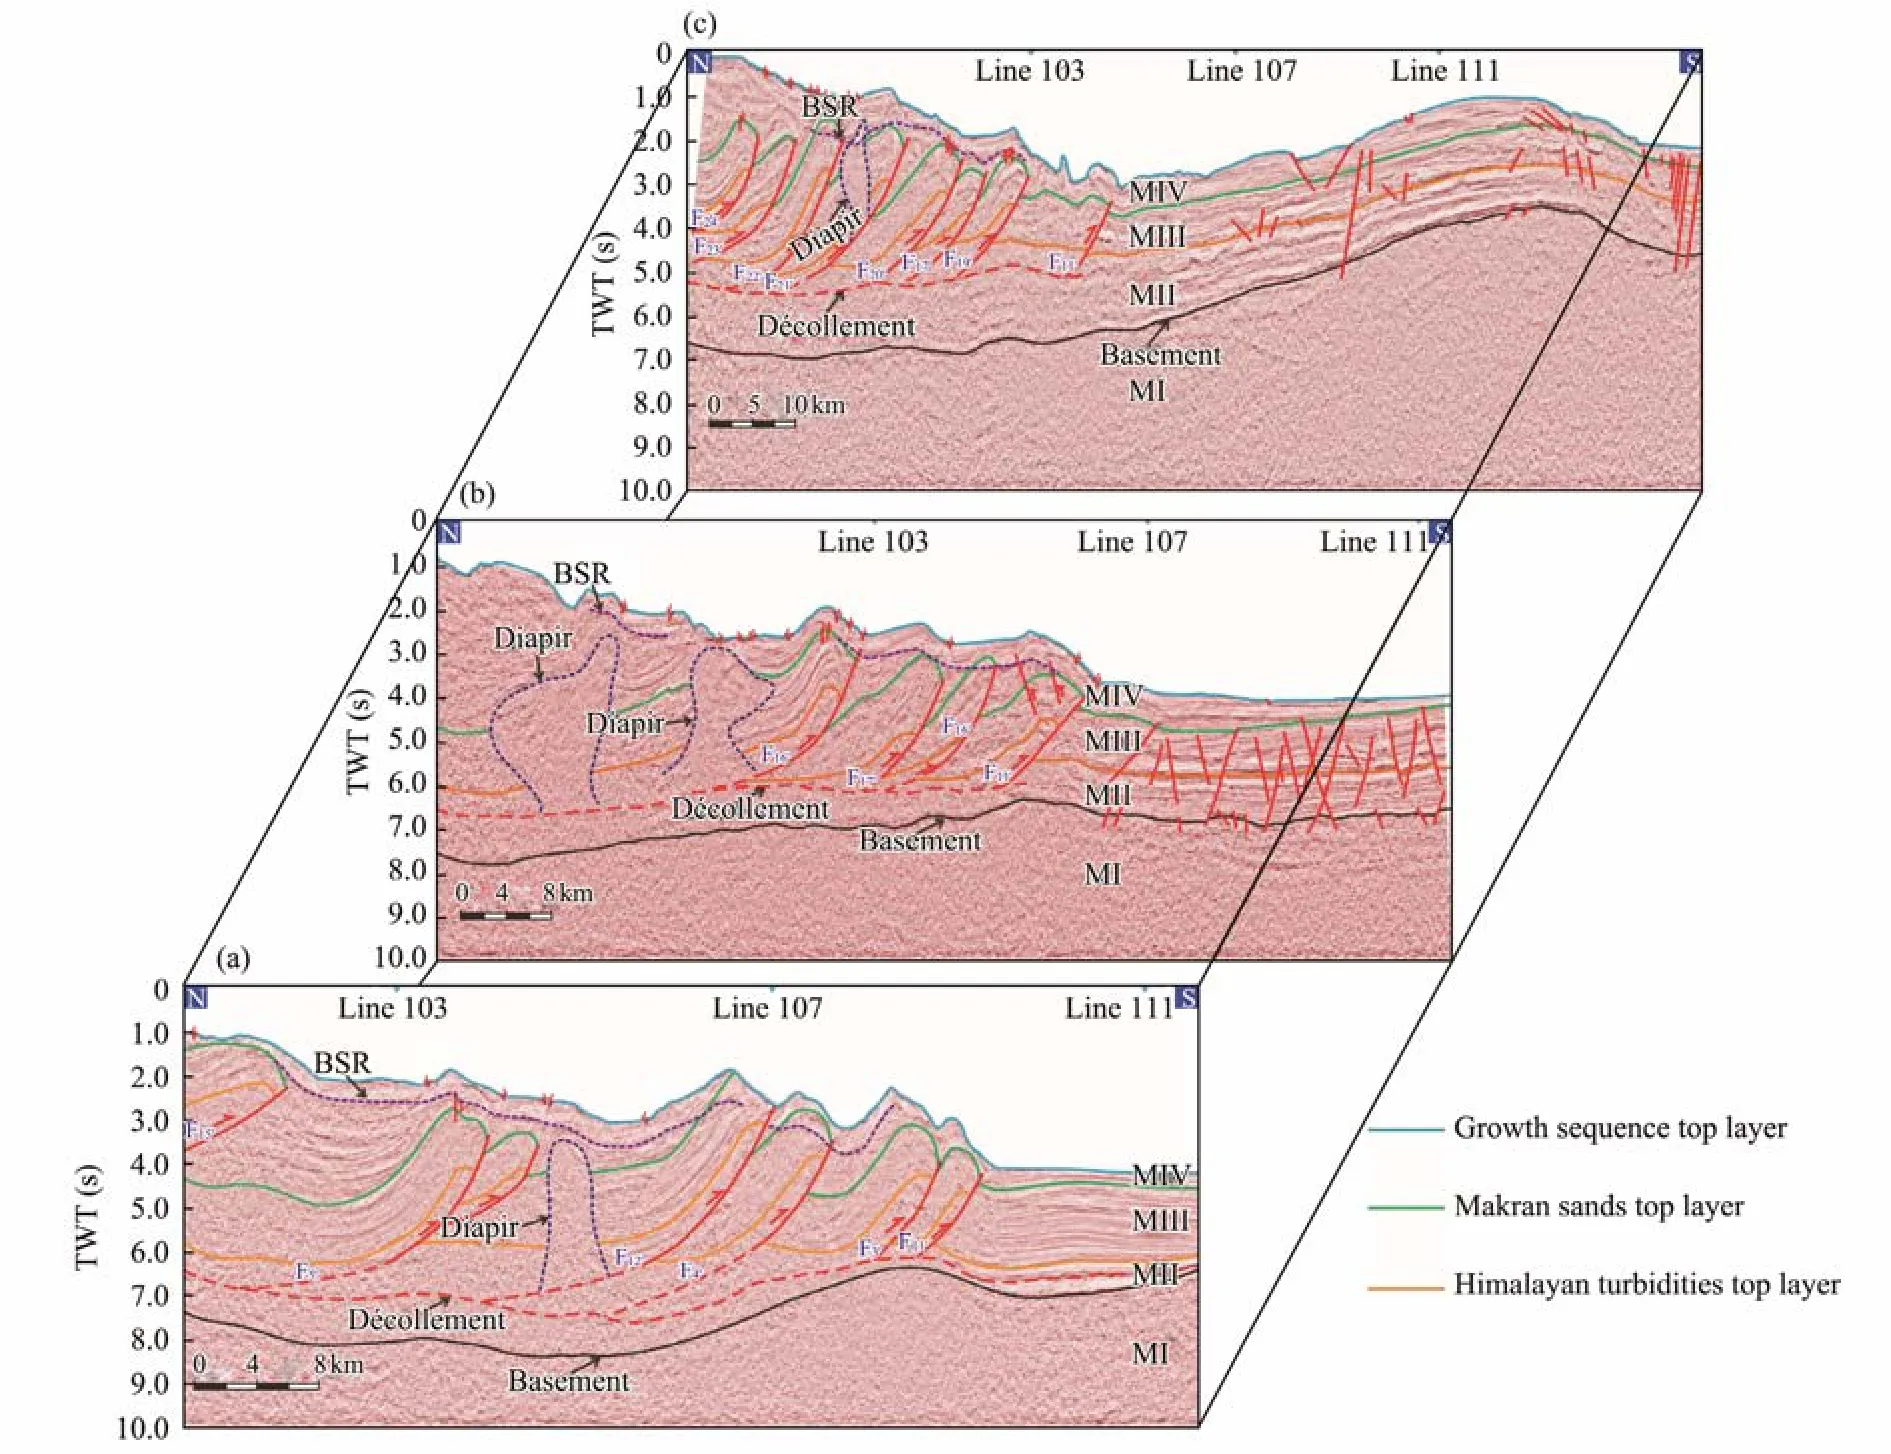
Fig.6 S – N seismic composite sections of the Makran accretionary wedge. (a), line 130 seismic interpretation section. (b),line 148 seismic interpretation section. (c), line 160 seismic interpretation section. Fig.1 shows the locations of seismic lines 130, 148 and 160.
The interpretation of the approximately 400-km-long E– W seismic section (Fig.7) reveals that the western structure has developed relatively simply and is primarily characterized by thrust faults. The tectonic movements of this section mainly contribute to subduction-induced extrusion.The BSRs in the western and central parts of the accretionary wedge exhibit good continuity and large amplitude,while those in the eastern part have poor continuity and small amplitude. Meanwhile, BSRs are generally absent in the easternmost seismic section. The eastern structure is remarkably complex, with prominent uplift and extension characteristics that have led to the development of several normal faults. Five seamounts (Figs.7a and 7b) were identified in the middle of the seismic section. Seamounts 1, 2,and 3 are conical, while seamounts 4 and 5 are moundshaped. The topography of the overlying seabed of seamount 2 tends to be horizontal without significant deformation. Compared with seamount 2, the overlying strata of seamount 5 exhibit a prominent wedge structure with a significant uplift in the seabed topography.
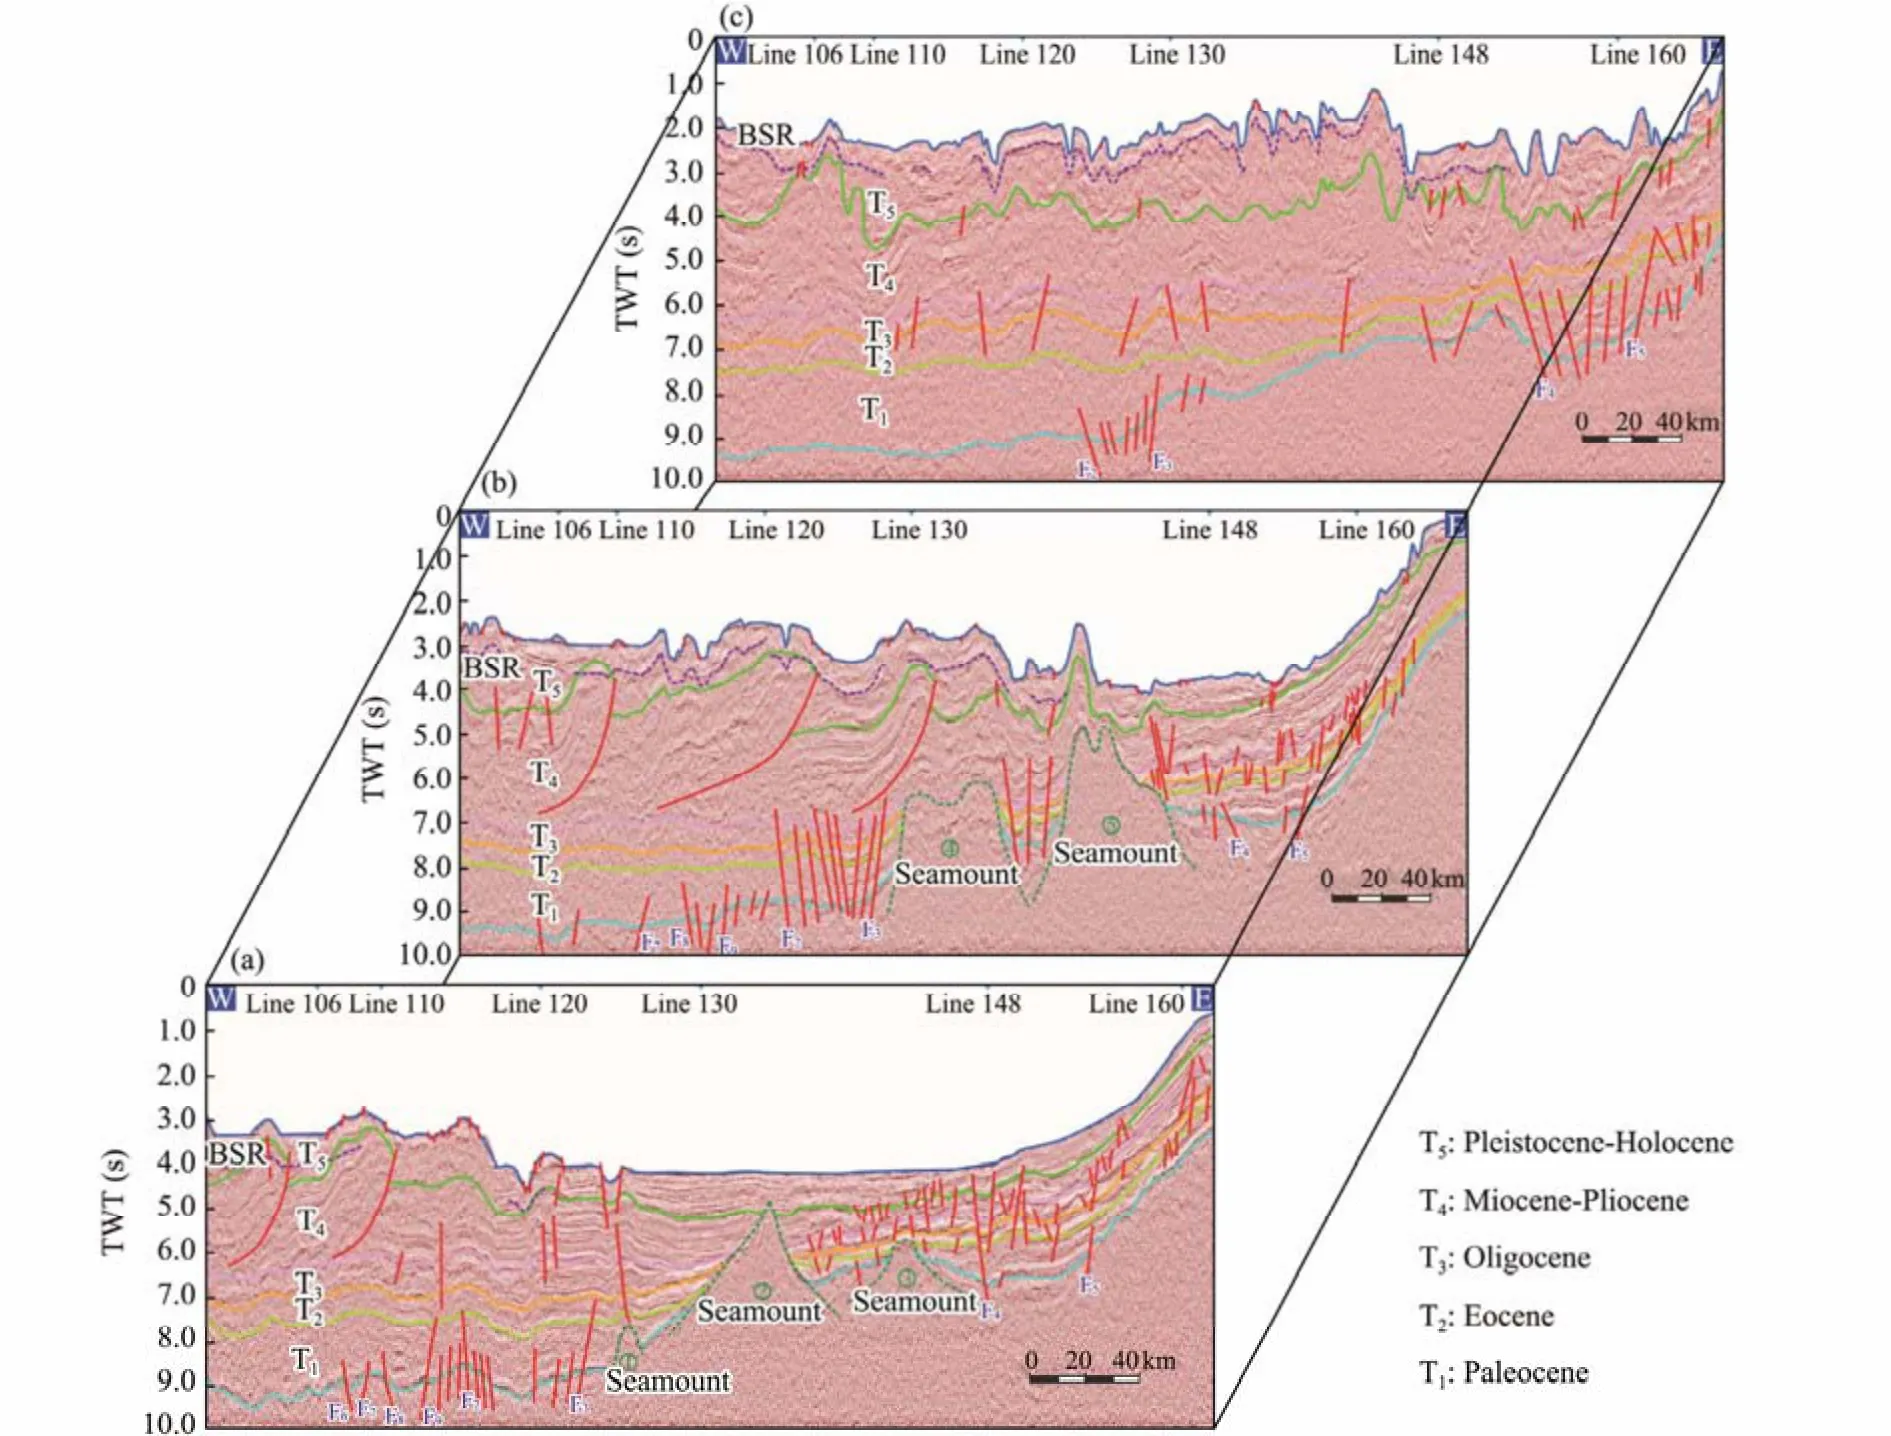
Fig.7 E – W seismic composite sections of the Makran accretionary wedge. (a), line 111 seismic interpretation section. (b),line 107 seismic interpretation section. (c), line 103 seismic interpretation section. Fig.1 shows the locations of seismic lines 111, 107 and 103.
6 Deformation Simulations of the Makran Accretionary Wedge
6.1 Theoretical Principles and Material Selection
Physical simulation experiments must follow the similarity theory. The similarities between actual geological conditions and experimental models should be considered in terms of six aspects: material, time, combination form,boundary condition, force mode, and geometric size (Jiaet al., 2013). In the experiment of this paper, dry and loose white and gray quartz sands are employed to simulate the crust, and colored quartz sand serves as a marker layer. The internal friction angle of the quartz sand is approximately 31˚, which closely matches that of the upper crustal rock(with a thickness of less than 10 km) (Koyiet al., 1993;Yuet al., 2019). The deformation characteristics of quartz sand, a preferred material for simulating the brittle deformation of the upper crust, follow the Coulomb criterion(Koyiet al., 1993; Yuet al., 2019). In addition, colorless transparent silicone is used to simulate the plastic layer at the bottom of the study area. Silicone has a viscosity of 1.2 × 10⁴Pa s and a density of 0.926 g cm−3, exhibiting Newtonian fluid characteristics at low strain rates. Thus,silicone is a suitable material for simulating soft rock formations in nature (Weijermarset al., 1993; Cottonet al.,2000; Yuet al., 2012, 2021).
6.2 Experimental Device and Parameter Settings
The experiments were conducted at the State Key Laboratory of Petroleum Resources and Processing at the China University of Petroleum in Beijing. Fig.8 shows the experimental device, which comprises a drive motor, a few rollers, a transfer seat, a lifting motor, a fixed baffle, two transparent glass plates, and a slot for the collision angle position. Three sets of experiments were established, as described below.
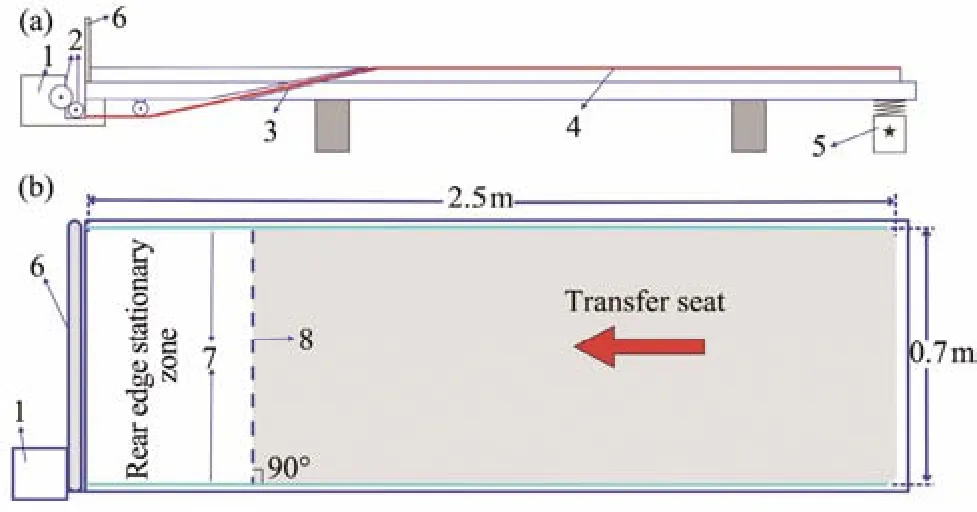
Fig.8 The experimental device. (a), the side view of the experimental device. (b), top view of the experimental device.The numbered components of the experimental equipment are as follows: 1, drive motor; 2, rollers; 3, subduction zone; 4, transfer seat; 5, lifting motor to control the subduction angle; 6, fixed baffle; 7, transparent glass plates on both sides; 8, collision angle position slot.
The first set of experiments employed a model with dimensions measuring 120 cm × 70 cm × 30 cm. The model initially contained 1.5 cm of gray sand, followed by three layers of white quartz sand, each with a thickness of 0.5 and 1 cm of gray quartz sand. The top surfaces of the five sand layers were covered, from bottom to top, with layers of black, red, blue, pink, and yellow quartz sand markers.
The second set of experiments also utilized a model measuring 120 cm × 70 cm × 30 cm. The model initially contained 1 cm of silicone, followed by 1 cm of gray quartz sand and two layers of white quartz sand, each with a thickness of 1 cm thick. The top surfaces of the three layers of sand were covered with layers of yellow, blue, and red quartz sand markers arranged from bottom to top. The silicone layer at the bottom was used to simulate a plastic décollement, with dimensions of 80 cm × 70 cm × 10 cm.
The third set of experiments used a model of the same dimensions as the first two experiments. The setup included a silicone block measuring 20 cm × 20 cm × 20 cm in the eastern part of the model to simulate a preexisting diapir structure. A 10 cm × 70 cm × 1 cm silicone block was positioned on the right side of the preexisting diapir to simulate a partial plastic layer. The model also included five layers of quartz sand containing 2 cm of gray sand,and two layers each of white and gray sand, each with a thickness of 0.5 cm, were subsequently added. The top surfaces of the sand layers were covered with layers of red, purple, green, pink, and blue quartz sand markers arranged from bottom to top.
The subduction angle for all three experimental models was set at 3˚, and the collision angle was 90˚. The subduction rate in the experimental device was 0.5 cm min−1,and the final displacement of the transfer seat was 30 cm,resulting in a total subduction volume of 30 cm. Table 2 shows the detailed parameters. The planes and sections of the experimental models were photographed every minute during the experiments, and the deformation characteristics were observed and recorded.
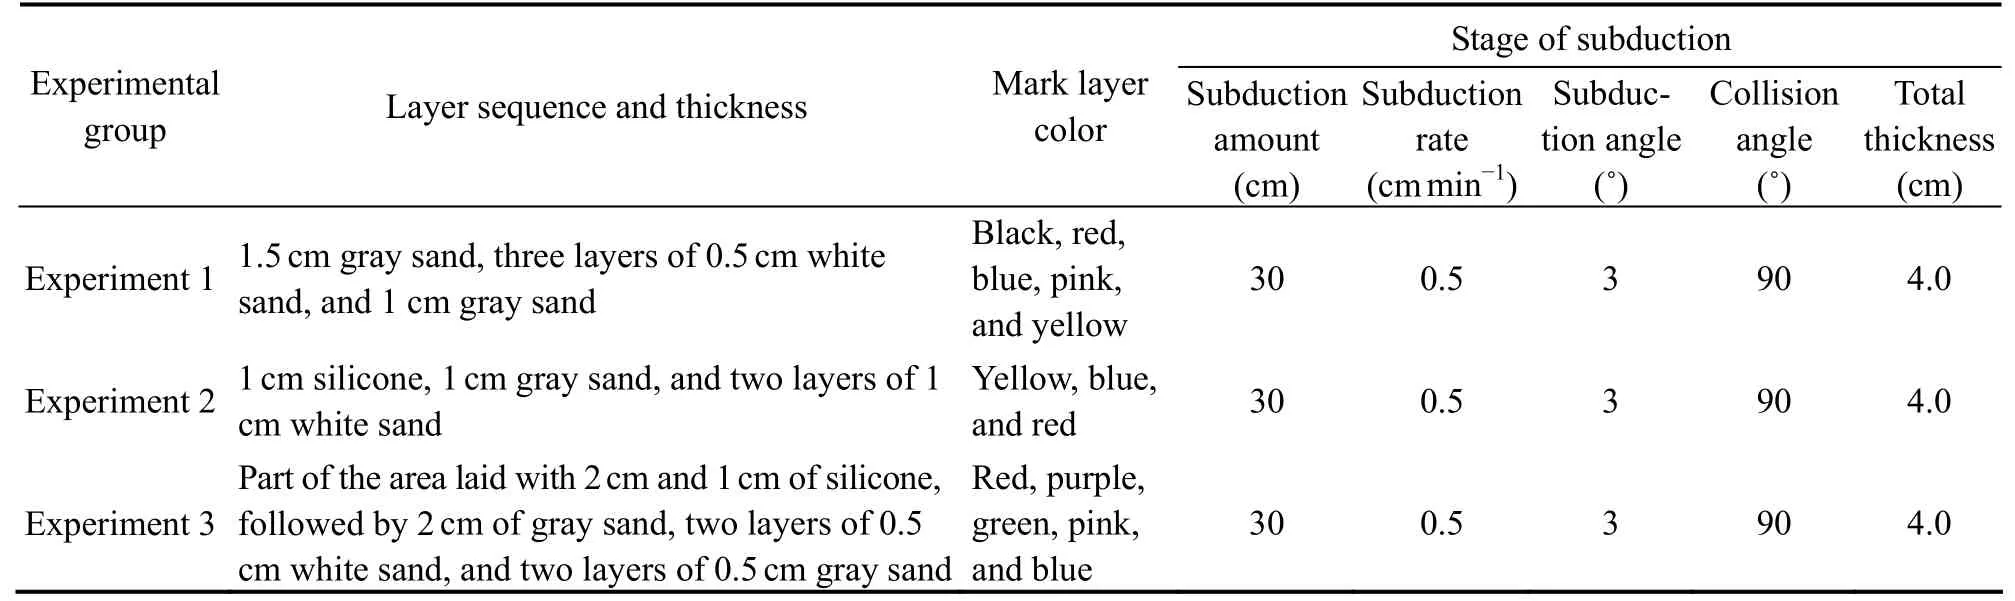
Table 2 Experimental parameters
6.3 Experimental Results
6.3.1 Experiment 1 – Simulation in the absence of silicone
Fig.9 shows the evolution of the plane during Experiment 1. When the subduction volume was 1 cm, thrust fault f1and back-thrust fault f2successively appeared on the surface of the sand layer (Fig.9a). When the subduction volume was 5 cm, a new thrust fault, f3, appeared and was distributed in a segmented manner on the surface of the sand layer (Fig.9b). The fracture degree of the rear edge of the thrust increased. When the subduction volume reached 5.5 cm, a new fault, f4, appeared on the surface of the sand layer, and the sand between faults f1and f2underwent rapid uplift. Thrust fault f4gradually connected to form a continuous line when the subduction volume was 7.5 cm (Fig.9c), while a new thrust fault, f5, appeared on the surface of the sand layer when the subduction volume reached 8.5 cm. When the subduction volume was 12.5 cm, thrust fault f5gradually connected to form a continuous line (Fig.9d).Thrust fault f6appeared on the surface of the sand layer when the subduction volume reached 13 cm. The fracture degree of the rear edge of the thrust fault, as well as the uplift height, continued to increase. When the subduction volume reached 16 cm, thrust fault f6gradually connected into a continuous line (Fig.9e), and a new thrust fault f7was distributed in a segmented manner on the surface of the sand layer when the subduction volume reached 21 cm (Fig.9f). When the subduction was 23.5 cm, a new segmented thrust fault f8appeared on the surface of the sand layer and then gradually connected to form a continuous line (Fig.9g). When the subduction volume was 26.5 cm, a new thrust fault, f9, appeared on the surface of the sand layer, and thrust fault f10and back-thrust fault f11appeared successively at a certain distance from thrust fault f9(Fig.9h). When the subduction volume reached 30 cm,thrust fault f11gradually connected into a continuous line,and thrust faults f9and f10extended along the strike (Fig.9i). The uplift height of sand between f1and f2stabilized during subduction after the emergence of faults f10and f11.The planes of the thrust faults were parallel to one another,and all faults, except for f10and f11, were close together, demonstrating a uniform spacing between them.
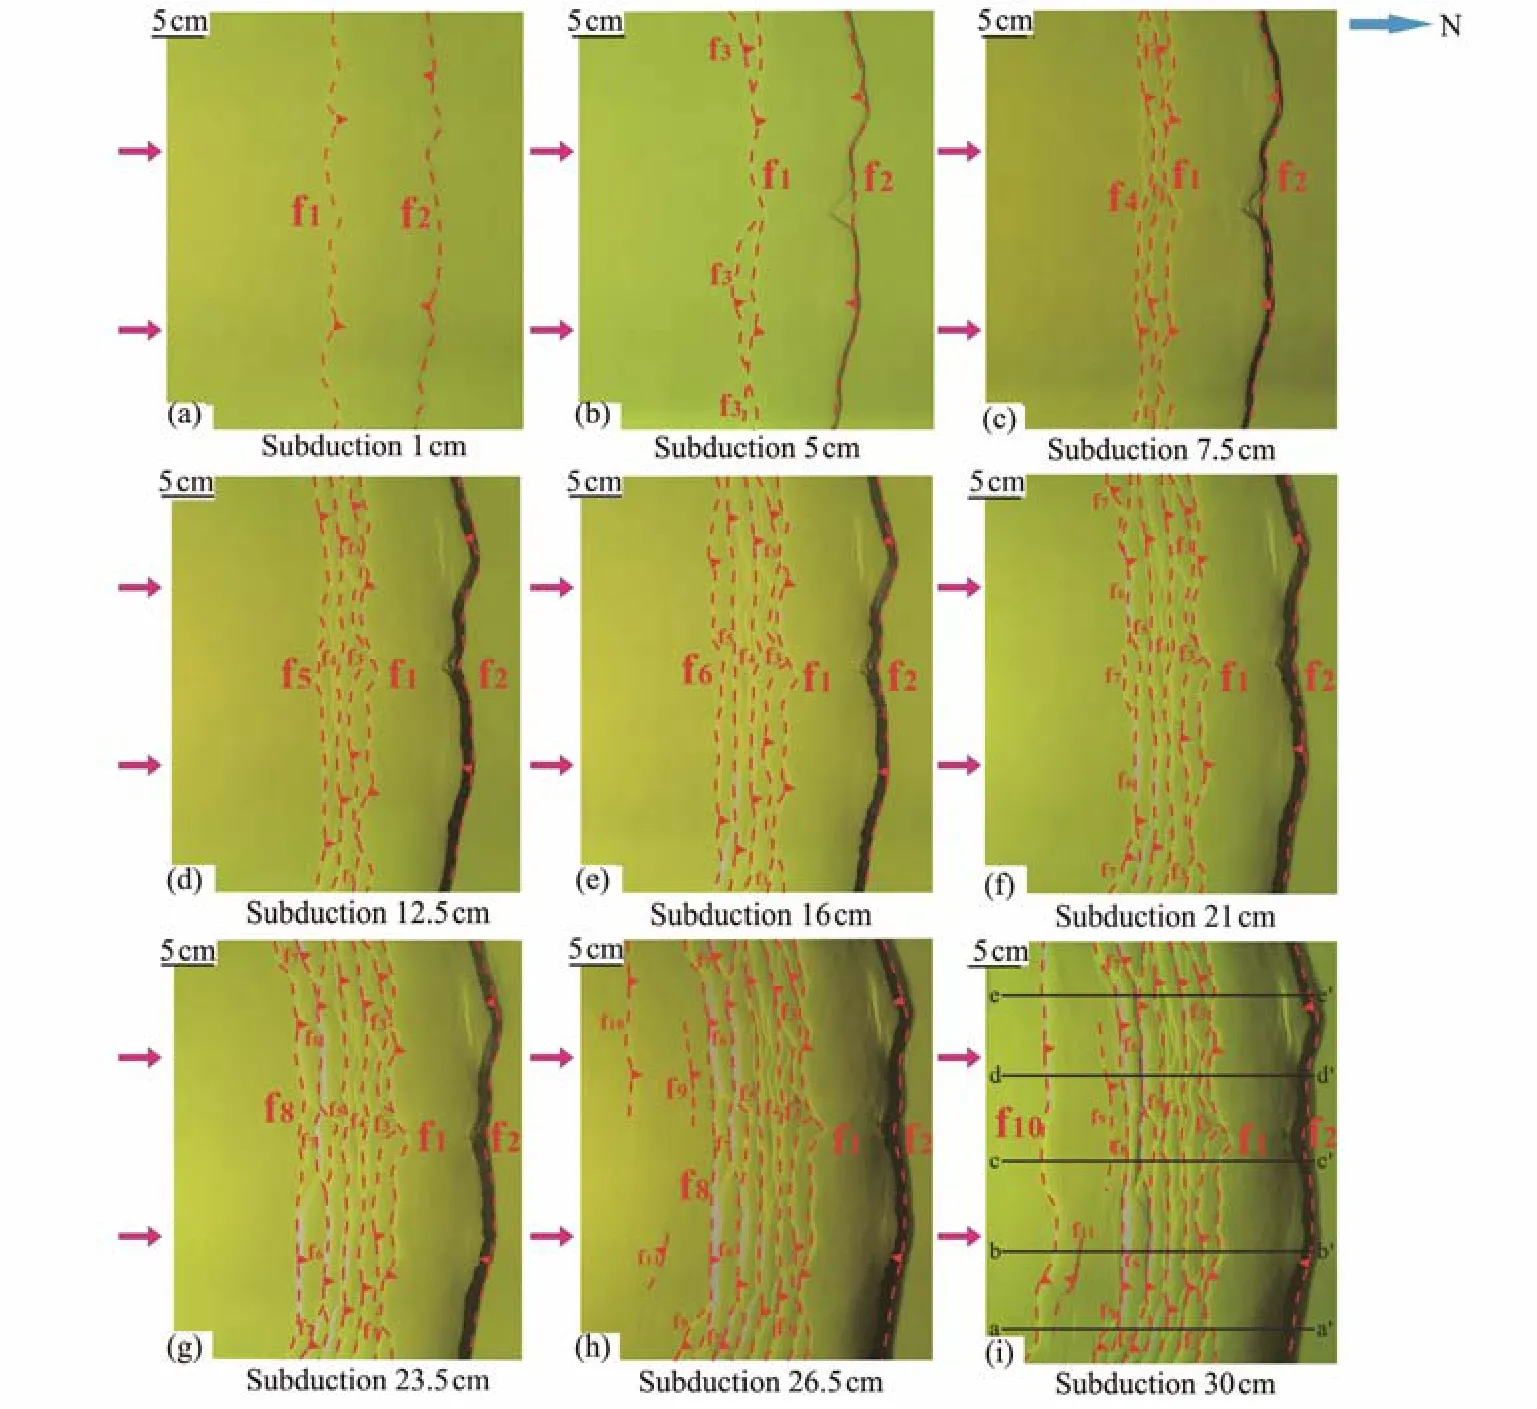
Fig.9 Experiment 1 plane simulation evolution. Subduction amount is shown at approximately 4 cm intervals for explanation.The red dotted lines represent the faults on the surface of the sand layer, which are numbered in order of occurrence. The pink arrows indicate the direction of subduction. The black horizontal lines indicate the slicing positions.
At the end of the experiment, a 6-cm-thick layer of white quartz sand was applied to the model and was then covered with a wet towel to soak. The experimental model was sliced after 12 h. The results of the slices showed that the structural deformation characteristics of sections a – a' to e– e' were roughly the same (Fig.10). The thrust faults f1,f3– f8, and f10, as well as large back-thrust fault f2and small back-thrust faults f12and f13, had developed in these sections. Thrust fault f9developed in sections a – a', c – c',and d – d', while back-thrust fault f11developed only in section a – a' and back-thrust fault f14developed in sections a – a' and b – b'. Except for faults f12– f14, the number of other faults corresponded to the number of plane faults shown in Fig.9. Faults f12– f14are not marked in Fig.9 because their development on the plane was not prominent.These thrust faults developed after fault f9and before fault f10. Thrust fault f10and back-thrust fault f11successively developed following the appearance of f14. The distance between faults f9and f10was significantly greater than that between the other faults. The deformation area converged around the subduction slot, and the thrust faults developed in a forward-spreading manner, demonstrating the typical thrust imbricate structures in sections a – a' to e – e'. Except for fault f10, the spacing between all other adjacent thrust faults was relatively uniform.

Fig.10 The section slicing results of Experiment 1. The slicing positions are shown in Fig.9i. Slice sections are placed every 10 cm. The red dotted lines represent the developed faults. Except for faults f12 – f14, the numbers of other faults correspond to those of the plane faults in Fig.9.
6.3.2 Experiment 2 – Simulation of décollement by using silicone
Fig.11 shows the evolution of the plane during the second experiment. When the subduction volume reached 3.5 cm, thrust faults f1, f2, and f3appeared successively on the surface of the sand layer (Fig.11a). Faults f2and f3were back-thrust faults, while faults f1and f3were segmented faults. When the subduction volume reached 7 cm, f1and f3became continuous, and a new back-thrust fault, f4, appeared on the surface of the sand layer (Fig.11b). New thrust faults f5and f6appeared at the thrust front when subduction reached 10.5 cm, and the surface of the sand layer at the uplift of the subduction slot exhibited a slight tensile fracture (the subduction slot was located between f1and f3)(Fig.11c). When the subduction volume was 14 cm, thrust faults f7, f8, and f9appeared on the surface of the sand layer.f8and f9were back-thrust faults, and the tensile fracture at the uplift of the subduction slot became prominent during this time (Fig.11d). When the subduction volume was 17.5 cm, new thrust faults f10and f11appeared at the thrust front,and f6connected with f7(Fig.11e). New thrust faults f12and f13appeared at the thrust front at a subduction volume of 21 cm, and the tensile fracture at the uplift of the subduction slot continued to increase in size (Fig.11f). When the subduction volume reached 28 cm, no new thrust fault occurred at the front or rear of the thrust (Fig.11h). A significant slump was observed at the uplift of the subduction slot at a subduction volume of 30 cm, especially at the rear slope (Fig.11i). The experiment results on the evolution of the plane showed that thrust faults had mainly developed in the direction opposite to that of subduction and were parallel to one another with a wide spacing between them.

Fig.11 Experiment 2 plane simulation evolution. Subduction amount is shown at approximately 4 cm intervals for explanation.The blue dotted lines represent the faults on the surface of the sand layer, which are numbered in order of occurrence. The pink arrows indicate the direction of subduction. The green horizontal lines indicate the slicing positions.
A 6-cm-thick layer of white quartz sand was applied to the model at the end of the experiment and was covered with a wet towel to soak. The model was then sliced after 12 h. The results showed that the thrust faults (f1, f5, f6, f10,f11, and f13) and back-thrust faults (f3, f9, f12, f15, f16, and f17) were generally well-developed (Fig.12). The top part of the subduction slot exhibited a prominent collapse that led to the development of several small normal faults (f18,f19, f20, f21, f22, and f23) that formed combinations of horsts and grabens. The typical thrust imbricate structures are shown in sections a – a' to e – e'.

Fig.12 The section slicing results of Experiment 2. The slicing positions are shown in Fig.11i. Slice sections are placed every 10 cm. The red dotted lines represent the developed faults. Except for faults f18 – f23, the numbers of other faults correspond to those of the plane faults in Fig.11.
Thrust fault f1and back-thrust fault f3initially developed in the early stage of subduction. Additional thrust faults,including faults f5, f6, f11, and f13, developed in a forwardspreading manner under continuous compression. The faults combination becomes complicated. Prominent pop-up structures were observed between f12and f11and between f15and f11in sections c – c' and e – e', respectively. Thrust faults f13and f17had opposite inclinations in section d – d 'and formed a ramp structure. The upper walls of thrust faults f11and f13developed snakehead anticline structures from sections a – a' to e – e'. Thrust faults f1, f5, f6, f11, and f13combined to form a typical thrust imbricate structure. The plastic layer at the bottom of the subduction slot significantly intruded into the overlying strata in the five sections to form diapir structures.
6.3.3 Experiment 3 – Simulation of preexisting diapir structure
Fig.13 shows the evolution of the plane in Experiment 3. When the subduction volume reached 2 cm, the surface of the sand layer was slightly uplifted. Thrust faults f1and f2appeared successively when the subduction volume reached 3 cm, where f2was a back-thrust fault (Fig.13a). When the subduction volume was 4.5 cm, a new segmented thrust fault f3appeared on the surface of the sand layer (Fig.13b). Thrust fault f3gradually connected to form a continuous line at a subduction of 7.5 cm, and the body of sand between f1and f2was rapidly uplifted (Fig.13c). When the subduction volume reached 10 cm, new thrust faults f4and f5appeared successively on the surface of the sand layer (Fig.13d). Thrust fault f6was observed on the surface of the sand layer when the subduction was 11.5 cm,and the lengths of faults f4and f5increased significantly(Fig.13e). When the subduction volume was 14.5 cm, the length of fault f6significantly increased (Fig.13f), and the area of the preexisting diapir was slightly uplifted at a subduction of 16.5 cm. When the subduction volume reached 17.5 cm, a small thrust fault f7appeared on the surface of the sand layer in the area of the preexisting diapir, a small back-thrust fault f8appeared at the rear edge, and the body of sand between f1and f2continued to be uplifted (Fig.13g). Once the subduction volume reached 17.5 cm, the fracture degrees of faults on the surface of the sand layer continued to increase with subduction, and no new fault was formed for a long time. When the subduction volume was 24 cm, a small back-thrust fault f9was formed on the surface of the sand layer in the area of the preexisting diapir (Fig.13h). The length of fault f7, as well as the fracture degrees of the other faults, increased slowly under subsequent subduction, but no new fault appeared on the surface of the sand layer until the subduction volume had reached 30 cm (Fig.13i).

Fig.13 Experiment 3 plane simulation evolution. The red dotted lines represent the faults on the surface of sand layer, which are numbered in order of occurrence. The yellow dotted rectangular area represents the preexisting diapir. The pink arrow indicates the direction of subduction. The yellow horizontal and vertical lines indicate the positions of the slices.
A 6-cm-thick layer of white quartz sand was applied to the model at the end of the experiment and was covered with a wet towel and left to soak. The model was then sliced after 12 h, and the results are shown in Fig.14. No part of the preexisting diapir was observed in section a – a',which contained thrust faults f1, f3, f4, f5, and f6as well as back-thrust faults f2, f12, and f13. The deformation area was concentrated around the subduction slot, and its structure was relatively simple. The structure of section b – b', with the preexisting diapir, was more complex than that of section a – a' and contained thrust faults f1, f3, f4, f5, f6, and f7as well as back-thrust faults f2, f8, f9, f10, and f11. Prominent pop-up structures were noted between faults f7and f9and between faults f6and f10, while a significant ramp thrust structure was formed between faults f9and f6. The deformation area was large, and the preexisting diapir was squeezed into the overlying sand layer. The preexisting diapir poured into the overlying sand layer to form an extensive pop-up structure in section c – c'.
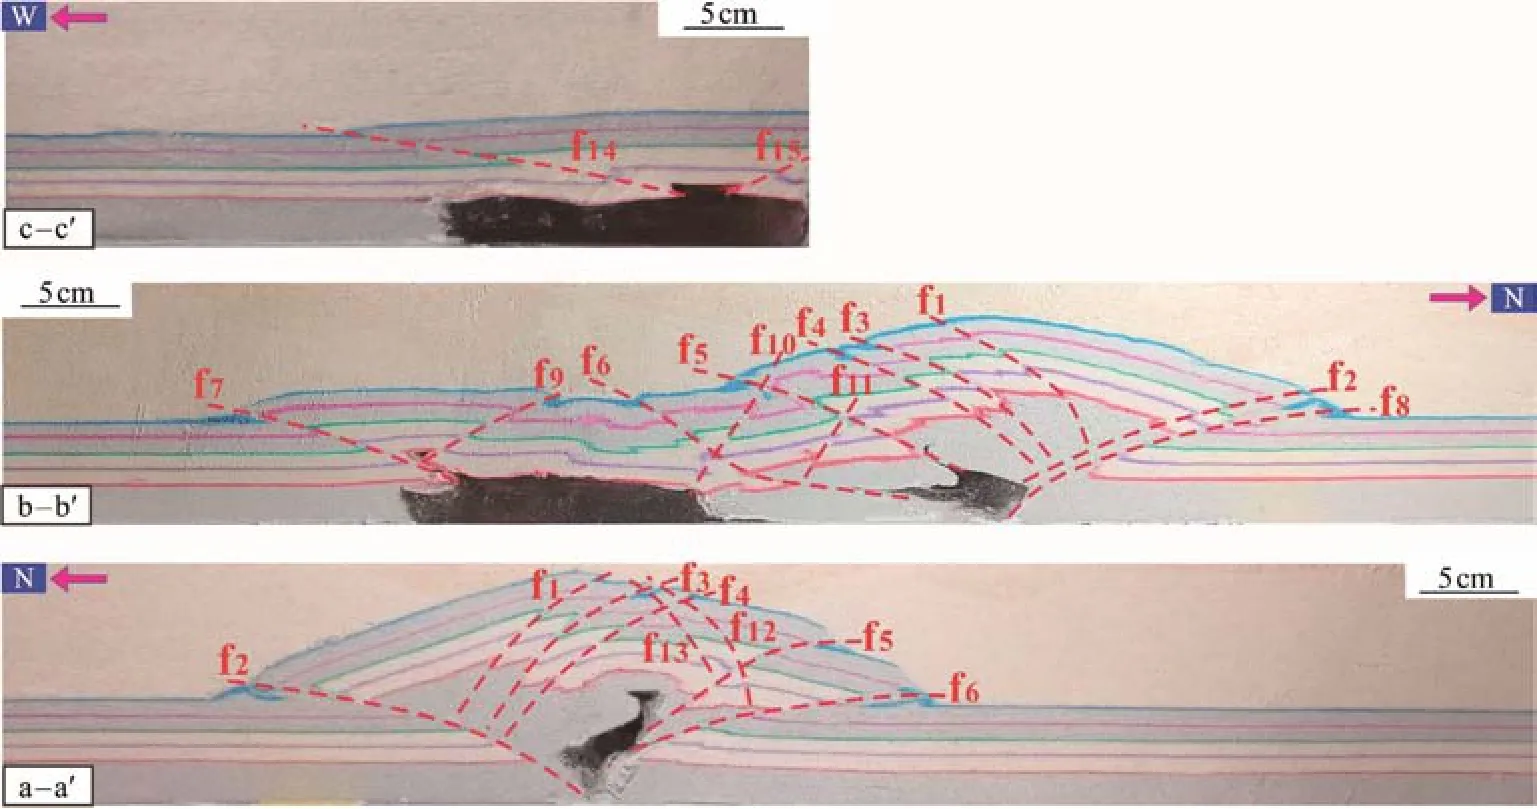
Fig.14 The section slicing results of Experiment 3. The slicing positions are shown in Fig.13i. Representative slice sections at three different locations are selected for comparison. Except for faults f10 – f15, the numbers of other faults correspond to those of the plane faults in Fig.13.
7 Discussion
7.1 Origin of Deformation of the Makran Accretionary Wedge
Smith calculated the maximum sedimentary thickness,average slope, average dip angle of the basement, and average spacing of thrust faults in the Makran accretionary wedge (Table 3) and compared them with corresponding data from wedges in other subduction areas to identify the factors controlling its deformation. The results showed that the maximum sedimentary thickness was not the main factor controlling the spacing between the faults and their development (Smithet al., 2012). Large-scale mud diapirs were observed in the Makran accretionary wedge. Grando and McClay (2017) claimed that these mud diapirs originated from the overlying sediments due to the overpressure caused by the wedge-induced load and the downward subduction of the basement.
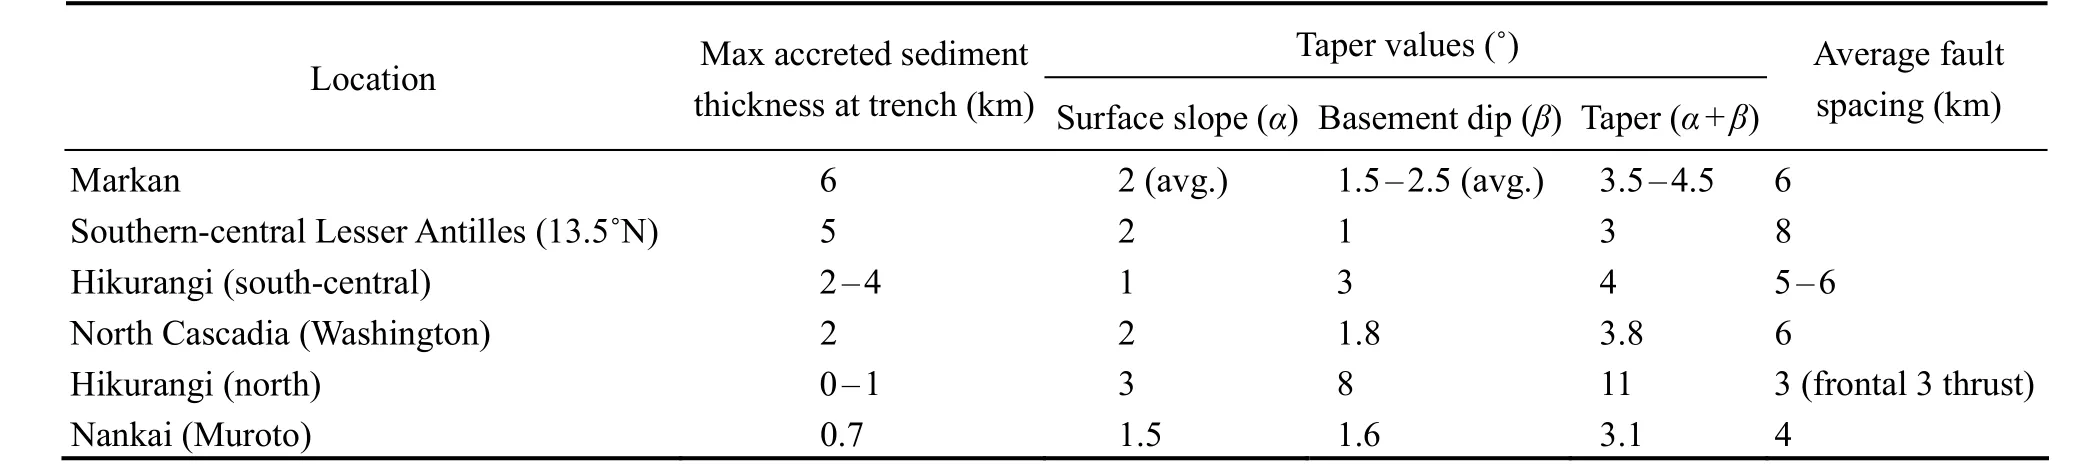
Table 3 Comparison of the structural parameters of the Makran accretionary wedge with those of other subduction zones
The experiments reported in this study provide insights into the factors controlling the morphological development and the spacing between thrust faults. The interpretation results of the slices in Experiments 1 and 2 (Figs.10 and 12, respectively) were significantly different. The spacing between faults was small in Experiment 1, mostly around 3 – 4 cm, but was larger in Experiment 2, mostly around 5– 7 cm. Moreover, the shape of the faults observed in Experiment 1 was relatively straight, while the faults observed in Experiment 2 were listric. The plastic layer had a significant influence on the development of accretionary wedges and faults. The simulation results of Experiment 2 were generally the most similar to the interpretation results of the actual seismic section. The latter are presented as follows:1) The interpretation of the actual N – S seismic section showed that the intervals between adjacent thrust faults that had developed in the imbricate fan zone of the Makran accretionary wedge mostly spanned 5 – 8 km, and the single thrust faults were listric (Fig.15a). The results of slices of the experimental section also reflected a typical thrust imbricate structure (Fig.15b). The distance between thrust faults f6and f11was 4.7 cm in the experimental model, which is equivalent to the 4.7 km in the field, and that between thrust faults f11and f13was 6.4 cm, which is equivalent to 6.4 km. Therefore, the intervals between adjacent thrust faults in the experimental section were close to those in the actual accretionary wedge, and thrust faults f1, f5, f6,f11, and f13were listric.
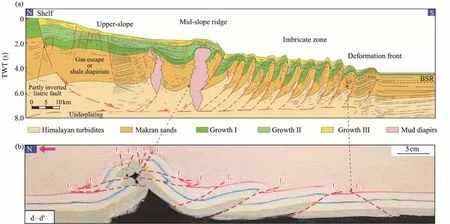
Fig.15 Comparison between actual seismic section interpretation and experimental section interpretation. (a), the N – S A – A'seismic section interpretation of the Makran accretionary wedge, with reference to Grando and McClay (2007). (b), experiment 2 section interpretation. The actual section location is shown in Fig.1, and the experimental section location is shown in Fig.11i.
2) The bottoms of the thrust faults in the actual N – S seismic section extended to the uniform décollement (Fig.15a). The slicing results in the experiment showed that thrust faults f1, f5, f11, and f13also extended to the décollement at the bottom (Fig.15b).
3) The actual N – S seismic section had a prominent backthrust fault in the front (Fig.15a). A significant backthrust fault, f17, was also obtained in the thrust front in the section slices in Experiment 2 (Fig.15b).
4) The interpretation of the actual N – S seismic section showed prominent divisions in the Makran accretionary wedge. The uplift heights of the mid-slope and upper-slope zones were significantly greater than that of the imbricate fan zone, and the uplift of the deformation front was the shortest (Fig.15a). The results of slices of the experimental section also revealed that the uplift height near the rear edge of the thrust was significantly greater than that in the thrust imbricate structure zone, which was higher than the front (Fig.15b).
5) The actual N – S seismic section contained prominent mud diapir structures in the mid-slope and upper-slope zones far from the thrust front (Fig.15a). The results of the slices in Experiment 2 showed that the upwelling of the plastic material was violent and formed a significant diapir structure at the position of the subduction slot far from the thrust front (Fig.15b).
6) The actual N – S seismic section featured prominent stratigraphic subsidence and small normal faults in the upper part of the mud diapir at the mid-slope ridge. The subsidence of the sand layer in the upper part of the diapir structure, as well as some small normal faults, were also observed in Experiment 2.
Thus, the results of Experiment 2 were highly similar to those of the interpretation of the actual seismic section,indicating that the prominent imbricate fans of the Makran accretionary wedge had been generated by the subduction of the oceanic crust. A décollement was observed at the bottom, which influenced the spacing between and the structural morphology of the thrust faults. The shallow,small normal faults might have been formed by the rapid upwelling of the mud diapirs or the rapid uplift of thrust fault-related folds, resulting in the collapse of the upper strata. The mud diapir generated in the mid-slope and upper-slope zones originated from the upwelling of the plastic material at the bottom, and the deep thrust faults became upwelling channels.
7.2 Continuity of Plane Faults
This section primarily discusses the distribution of faults on the eastern plane of the study area due to the limited seismic data obtained in the current study. Few researchers have focused on the continuity of plane faults, but many experimental results have shown that this phenomenon is crucial in the development of structures (Cottonet al.,2000; Yuet al., 2019, 2021). Significant differences were noted in the continuity of faults in the accretionary wedge plane. The continuous length of individual faults reached approximately 250 km (Smithet al., 2012), but some faults were only approximately 15 km long. Special structures were also observed in areas where the continuity of the faults worsened or the segmentation phenomenon occurred, such as in the case of the seamounts and mud diapirs. Fig.3 shows that thrust faults F3', F4', and F5'exhibited good continuity,extending continuously for approximately 240 km. Preexisting extensional faults had no effect on the continuity of the subsequently formed thrust faults. However, the thrust faults exhibited significant segmentation around eastern seamount 5, interrupting the continuity of F4', F12', F16', and F17'. The subduction of the seamount led to the segmentation of the thrust faults. However, the factor contributing to the good continuity of the thrust faults at seamount 4 remains unknown. The E – W seismic sections (Figs.7a and 7b) indicate different subduction depths for seamounts 2,4, and 5, suggesting various stages of subduction. Seamount 2 had the shallowest subduction (early stage), followed by seamount 5 (middle stage), while seamount 4 exhibited the deepest subduction (late stage). Therefore, the subduction of seamounts in the early and middle stages is believed to have affected the development of thrust faults and resulted in the segmentation of plane faults. The results of subduction experiments involving seamounts by Liet al. (2012,2016) intuitively show that this phenomenon has a major destructive effect on fault continuity.
In addition, the seismic sections at lines 130 (Fig.6a)and 148 (Fig.6b) showed that large mud diapir structures had developed in both sections. The development of the thrust fault ceased at the location of the diapir structure in the seismic section at line 148. The presence of the diapir structure in the seismic section at line 130 significantly increased the interval between adjacent thrust faults. The plane also highlights the poor continuity of thrust faults at the mud diapirs at lines 130 and 148. The evolution of the plane in Experiment 3 (Fig.13) showed that the thrust faults regularly developed in the early stage but preferentially deformed after spreading to the preexisting diapirs,with no observable deformation outside this area. Therefore, preexisting diapirs affected the normal development of the thrust faults and led to poor continuity in their distribution on the plane.
8 Conclusions
1) The structural development characteristics of the western part of the Makran accretionary wedge were relatively simple compared to those of its eastern part. The western part mainly featured the development of thrust faults at uniform intervals, whereas the eastern part had significantly fewer thrust faults. The scale and number of mud diapirs significantly increased, and the basement underwent a prominent tectonic uplift.
2) The spacings between and shapes of deep thrust faults in the Makran accretionary wedge were constrained by décollement. Shallow normal faults were formed by the rapid upwelling of mud diapirs or the rapid uplift of thrust fault-related folds, resulting in tensile fractures in the upper part or even the collapse of the upper strata. The thrust faults provided good channels for the migration of upwelling plastic material at the bottom, which moved along the thrust faults and gathered in the hanging walls to form diapir structures. A sharp upwelling was observed in the plastic material at the bottom of the area near the trench,resulting in the formation of large-scale diapir structures in the mid- and upper slopes of the accretionary wedge.
3) The preexisting diapir structures and the subduction of the seamounts affected the development of the thrust faults, resulting in poor continuity and fault segmentation distributed on the plane.
Acknowledgements
This study was funded by the National Natural Science Foundation of China (No. 42076069). The constructive and detailed comments of two anonymous reviewers improved both the content and presentation of this article.
杂志排行

Journal of Ocean University of China的其它文章
- Using Natural Radionuclides to Trace Sources of Suspended Particles in the Lower Reaches of the Yellow River
- Eutrophication of Jiangsu Coastal Water and Its Role in the Formation of Green Tide
- Evaluation of the Shallow Gas Hydrate Production Based on the Radial Drilling-Heat Injection-Back Fill Method
- Microstructure Characterization of Bubbles in Gassy Soil Based on the Fractal Theory
- Morphological and Sulfur-Isotopic Characteristics of Pyrites in the Deep Sediments from Xisha Trough, South China Sea
- Deformation Characteristics of Hydrate-Bearing Sediments