Comparisons of Wave Force Model Effects on the Structural Responses and Fatigue Loads of a Semi-SubmersibleFloating Wind Turbine
2024-03-12HANYanqingLEConghuanZHANGPuyangandXUShengnan
HAN Yanqing , LE Conghuan , ZHANG Puyang and XU Shengnan
1) State Key Laboratory of Hydraulic Engineering Simulation and Safety, Tianjin University, Tianjin 300072, China
2) School of Hydraulic Engineering, Ludong University, Yantai 264025, China
3) School of Civil Engineering, Tianjin University, Tianjin 300072, China
4) Shandong Marine Aerospace Equipment Technological Innovation Center, Yantai 264004,China
Abstract The selection of wave force models will significantly impact the structural responses of floating wind turbines. In this study,comparisons of wave force model effects on the structural responses and fatigue loads of a semi-submersible floating wind turbine(SFWT) were conducted. Simulations were performed by employing the Morison equation (ME) with linear or second-order wave kinematics and potential flow theory (PFT) with first- or second-order wave forces. A comparison of regular waves, irregular waves,and coupled wind/waves analyses with the experimental data showed that many of the simulation results and experimental data are relatively consistent. However, notable discrepancies are found in the response amplitude operators for platform heave, tower base bending moment, and tension in mooring lines. PFT models give more satisfactory results of heave but more significant discrepancies in tower base bending moment than the ME models. In irregular wave analyses, low-frequency resonances were captured by PFT models with second-order difference-frequency terms, and high-frequency resonances were captured by the ME models or PFT models with second-order sum-frequency terms. These force models capture the response frequencies but do not reasonably predict the response amplitudes. The coupled wind/waves analyses showed more satisfactory results than the wave-only analyses. However,an important detail to note is that this satisfactory result is based on the overprediction of wind-induced responses.
Key words floating wind turbine; wave force model; potential flow theory; Morison equation; second-order wave forces
1 Introduction
The advantages of floating wind turbines (FWTs) in capturing wind power in deep waters are highly regarded.Various floating wind turbine concepts, including semisubmersibles, tension leg platforms, and spar types, have been proposed based on the experiences of the oil and gas industry. However, as a new type of offshore platform,FWTs have many differences from traditional floating oil platforms. For example, the hulls of the FWTs are usually smaller and lighter than those of the floating oil platforms.The ratio of the wavelength to the hull’s main dimension affects the selection of the wave force model; the inertial force dominates at a small ratio, while the drag effect is more pronounced at a large ratio. In addition, the presence of the upper wind turbines and towers increases the degrees of freedom of the whole system at different natural frequencies, which may cause more resonances. Therefore,simple linear wave force model analyses are not enough to capture the stochastic response of FWTs.
Potential flow theory (PFT) and the Morison equation(ME) are two practical approaches for modeling wave forces. For a semi-submersible, the PFT accounting for the Froude-Krylov loads and the diffraction effects are usually used to calculate the wave forces (Kvittemet al., 2012;Liuet al., 2018). However, the ME is also considered suitable in some literature (Robertsonet al., 2017; Xuet al.,2019a). Kvittemet al.(2012) investigated the effects of wave force modeling for a semi-submersible floating wind turbine (SFWT). The PFT model and the ME model were used without considering the second-order effects, with the ME models giving more satisfactory motions compared with the PFT models. In the OC5 project, different wave force models were used and compared to investigate the effects on the responses of an SWFT (Robertsonet al.,2017). However, the conclusions of the wave force model effects were unclear because the participants used different codes, and the simulation results used for comparison with the experimental data were averaged.
Nonlinear wave force effects on the responses of FWTs have received much attention in recent years. These effects may be due to the nonlinear wave force model, wave kinematics, or both (Pegalajar-Juradoet al., 2017). The secondorder difference-frequency (second-order Diff-Fre) wave forces, which can be calculated based on PFT, are crucial for the dynamic responses of SFWTs (Coullingetal., 2013a;Xuet al., 2019b; Zhanget al., 2020). The full quadratic transfer functions (QTFs) are more recommended in the literature than Newman’s approximation, which may underpredict the platform motion. Second- order wave forces may excite structural natural frequency resonances, which can cause more significant extreme responses and fatigue loads than first-order wave forces. The nonlinear hydrodynamic effects can also be captured by ME with secondor higher-order wave kinematics. Xuet al.(2019b) studied the nonlinear wave force effects on the structural responses and fatigue damages of an SFWT due to fully nonlinear wave kinematics based on ME. The structural responses of the platform, the tower, and the tensions in mooring lines were compared using linear wave kinematics and fully nonlinear wave kinematics. They found that the extreme responses and fatigue damages were significantly affected by wave nonlinearity. Second-order sumfrequency (second-order Sum-Fre) forces, which can excite high-frequency modes, are usually assumed to be unimportant and neglected (Coullinget al., 2013a; Chuanget al., 2020). However, the second-order Sum-Fre wave force may excite the tower or rotor vibration mode of an SFWT, whose natural frequencies are commonly higher than the first-order wave frequencies (Robertsonet al.,2017). Further study on the high-frequency responses of the SFWT system is needed.
This study aims to identify and discuss the wave force model effect on an SFWT’s structural responses and fatigue forces. Simulations were conducted by employing ME with linear or second-order wave kinematics and PFT with first- or second-order wave forces based on the models and methodologies presented in Sections 2 and 3. Load cases are introduced and listed in Section 4. The regular waves, irregular waves, and coupled wind/wave analysis results are compared with the experimental data and discussed in Section 5.
2 Floating Wind Turbine Model
The OC4 DeepCwind SFWT is considered in this work(Robertsonet al., 2014). The SFWT consists of a semisubmersible platform (Fig.1), an NREL 5 MW wind turbine,and three catenary mooring lines. The platform is designed with a water depth of 200 m. The draft depth of the hull is 20 m below the mean sea level (MSL), and the freeboard height is 10 m above MSL. The platform is provided with buoyancy by three side columns and one center column.The upper and lower side columns have diameters of 12 and 24 m, respectively, with ballast water inside. The center column has a diameter of 6.5 m without ballast water inside. The distances between the axes of the center column and side columns are 40.87 m, and the distances between the axes of the side columns are 50 m. The cross braces connect the columns with a diameter of 1.6 m. Each catenary mooring line is associated with the fairlead on a side column to keep the platform in position. Table 1 shows the main properties of the OC4 DeepCwind SFWT. More detailed information about the OC4 DeepCwind SFWT can be found in Ref. (Jonkmanet al., 2009; Robertsonet al.,2014).

Table 1 Main properties of the OC4 DeepCwind SFWT
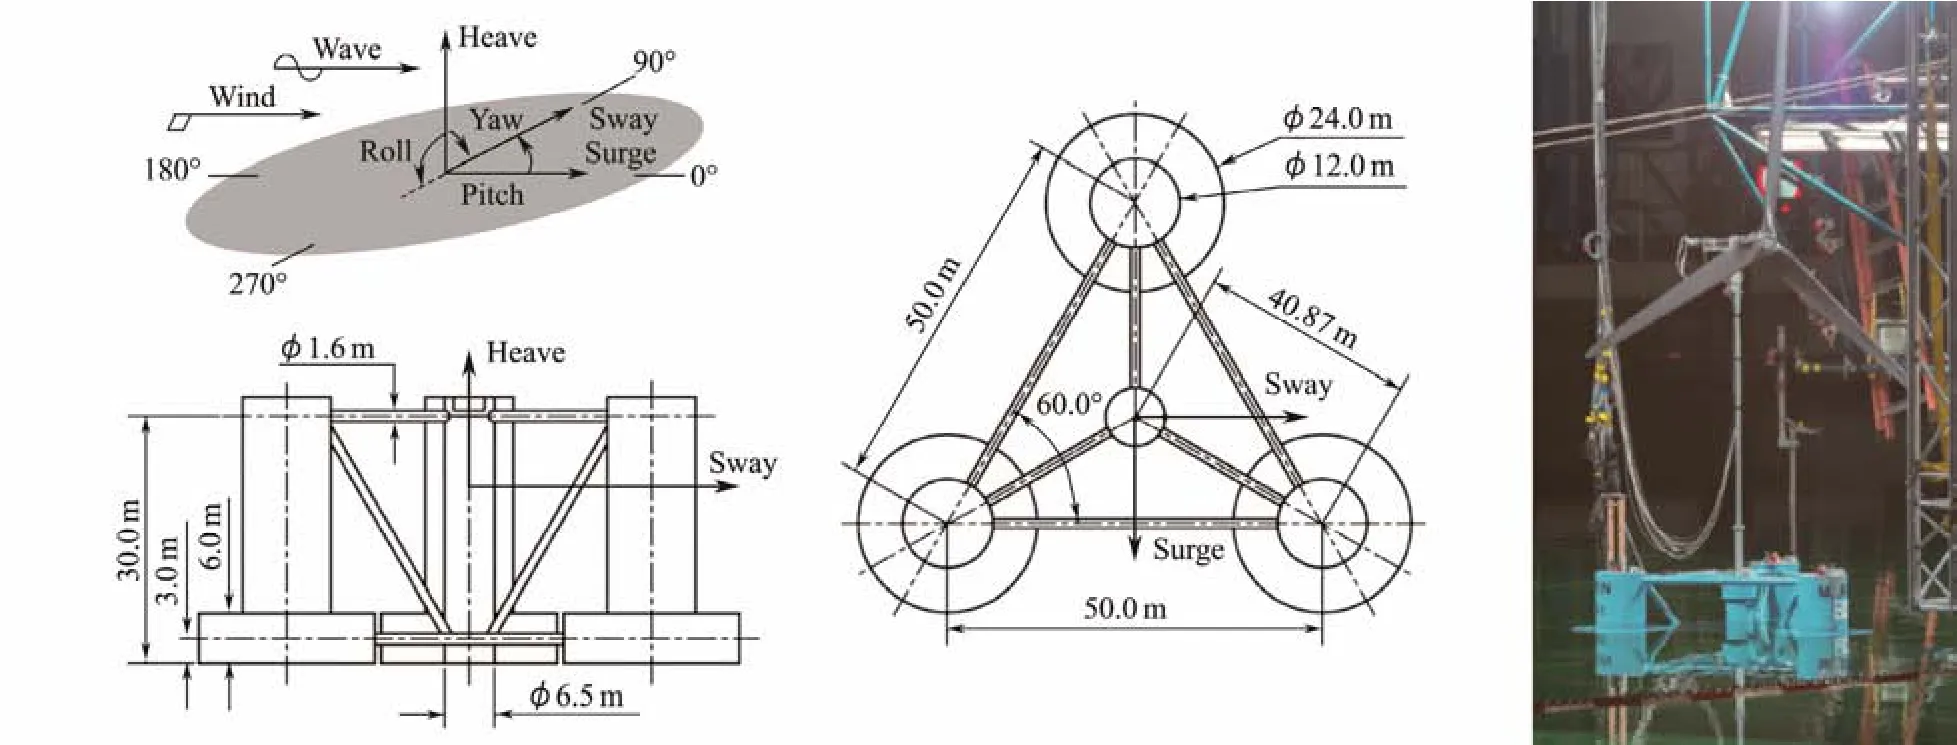
Fig.1 OC4 DeepCwind SFWT (Helder and Pietersma, 2013; Robertson et al., 2014).
Experimental data recorded from the OC4 DeepCwind SFWT at MARIN offshore wave basin are used for the comparisons (Coullinget al., 2013b). In the model tests,the semi-submersible and the NREL 5 MW wind turbine were conducted at 1/50th scale. The system was moored using three scaled catenary chains. The SFWT was tested under regular waves-only, irregular waves-only, and coupled irregular waves and dynamic wind conditions. Platform motions, tower top and tower base forces and moments, and mooring line tensions were recorded in the model tests; see Ref. (Coullinget al., 2013b) for more details on the OC4 DeepCwind SFWT model tests.
3 Methodologies
3.1 Fully Coupled Analysis Method
The OC4 DeepCwind SFWT is simultaneously subjected to various loads during its operation, for example, aerodynamic forces, wave forces, and mooring forces. The fully coupled dynamics equation of motion is given as
whereMis the mass matrix of the OC4 DeepCwind SFWT,Ais the added mass matrix,ζis the six degrees of motion,Kis the stiffness matrix,Fwis the aerodynamic forces,FIis the wave exciting forces,Fdis the drag force from ME,Fcis the radiation damping forces, andFmis the mooring system restoring forces. The numerical models of the SFWT are constructed using OpenFAST, an NRELdeveloped wind turbine computer-aided tool (NREL, 2021).Fully coupled analyses in regular waves-only, irregular waves-only, and coupled wind and wave conditions were conducted. In view of the purpose of this study, which is to compare the wave force model effects on the structural responses and fatigue loads of the SFWT, the wave force models will be emphasized below.
3.2 Wave Force Models
As mentioned above, PFT and ME are two practical approaches for modeling wave forces. This section describes the wave force models used in this study.
3.2.1 Potential flow theory
For a semi-submersible, PFT accounting for the Froude-Krylov loads and the diffraction effects is usually used to calculate the wave forces. The first-order wave forces on a marine structure, whose characteristic dimension is large relative to a typical wavelength for a regular incoming wave,can be given as follows:
whereXiis theith component of the first-order wave forces per unit wave amplitude, andAis the wave amplitude. For an irregular sea state, the total wave forces can be represented as a superposition of the different wave frequencyωkcomponents
The second-order wave forces for an irregular sea state,including the contributions of the sum and difference frequency components in PFT, can be expressed by
3.2.2 Morison equation and second-order wave kinematics
In extreme sea states, the effects of flow separation must be considered when using the wave forces from PFT. In addition, many floating wind turbine simulation codes cannot model wave forces per PFT models and applies only ME models for all sea states. Therefore, the ME model is compared with the PFT model in this study to address these situations. The ME is applicable for calculating wave forces for small structures in scale compared with the wavelength of the incident wave. The transverse wave forcedFnper unit length for a cylinder can be expressed by
whereρis the water density;AandDare the cross- section area and the diameter of the slender member, respectively;ris the displacement of the local member;uis the velocity of the wave particles; andCd, Caare the drag and added mass coefficients, respectively. For the OC4-Deep-Cwind SFWT, the ME model is a reasonable approximation due toD/L≤ 0.2 in most wave conditions, in whichDis the main dimension of the platform hull andLis the characteristic wavelength (Robertsonet al., 2014). The added mass coefficientsCaxfor the surge direction andCazfor the heave direction are computed as
whereA11(ω) andA33(ω) are the added mass ofω-frequency in the surge and heave directions, which are calculated from PFT, respectively. Theoretically, the added mass coefficientsCaxandCazare functions of frequency.However, they are usually used as fixed values in numerical simulations. This study takes these coefficients as fixed values corresponding to the spectral peak period,which will, to some extent, increase the wave forces on the platform.Vis the volume of the platform, andVRis the reference volume of the heave plates. For a flat circular plate with a diameter of 2a, the reference volumeVRis(DNV, 2010)
The second-order contributions to wave kinematics are also considered in the ME models. The second-order wave kinematics are calculated using the first-order wave kinematics, and extra energies are added to the wave spectrums at the sum and difference frequencies. The extrapolated second-order horizontal wave-particle velocities,u(2), for the regions between the still water level and first-order free-surface elevation can be expressed by (Sharma and Dean, 1981)
where (x, z) is the position,tis the time, andu(1)is the first-order wave-particle velocity.
3.3 Fatigue Damage Estimate Method
The 1 Hz damage equivalent fatigue load (DEFL) is applied to compute the short-term fatigue loads of the platform (DNV, 2019). The short-term 1 Hz DEFL is given by
4 Load Cases and Environmental Conditions
This study aims to compare the effects of different wave force models (PFT and ME) on the dynamic responses of the SFWT. To verify the experimental data in the OC4 project, a series of regular waves and irregular waves with or without wind conditions, which are listed in Table 2, is assessed with the comparisons. The measured time series of the wave elevations and wind velocities measured in the OC4 project experiments (Coullinget al., 2013b; Robertsonet al., 2017) is directly imported into the simulation.Different wave force components (with or without secondorder terms) are considered to address the second-order wave force effects on the structural responses and fatigue damages of the SFWT. Therefore, each Load Case is split into six sub-load cases, taking Load Case 1 (LC1) as an example.
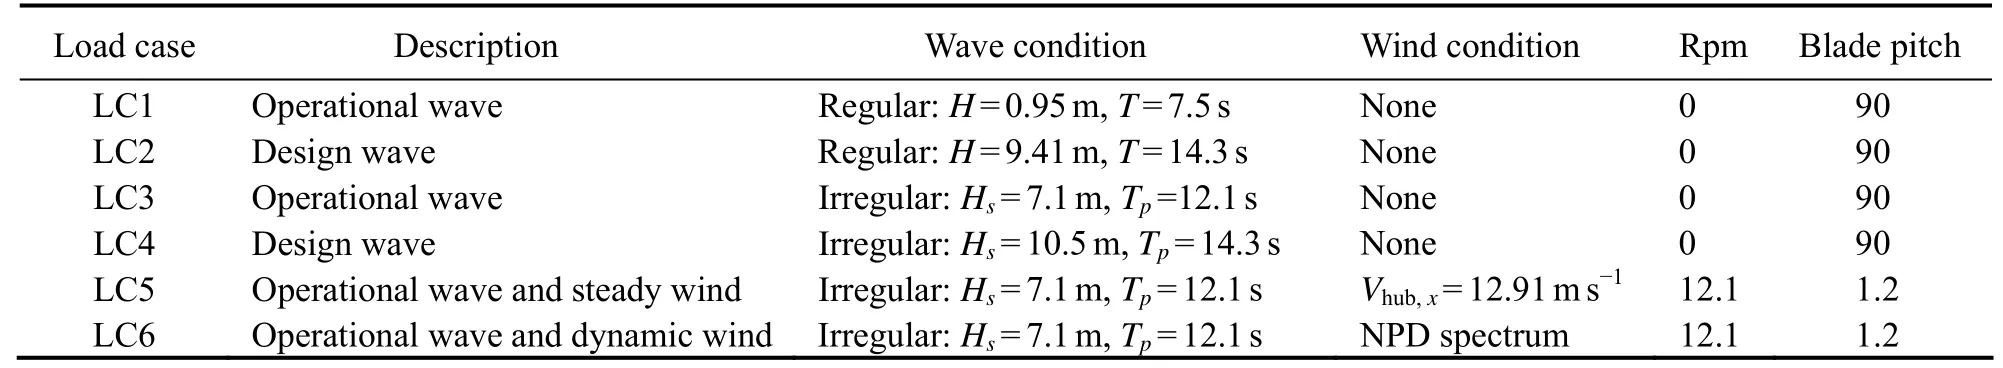
Table 2 Load cases and the corresponding environmental conditions
1) LC1-M1: ME with first-order wave kinematics.
2) LC1-M2: ME with second-order wave kinematics.
3) LC1-F1: first-order wave forces using PFT with firstorder viscous drag forces using ME.
4) LC1-F2S: first- and second-order Sum-Fre wave forces using PFT with first-order viscous drag forces using ME.
5) LC1-F2D: first- and second-order Diff-Fre wave forces using PFT with first-order viscous drag forces using ME.
6) LC1-F2ALL: first- and second-order Sum-Fre and Diff-Fre wave forces using PFT with second-order viscous drag forces using ME.
The year passed quickly and Ronny had made some progress but hardly enough to bring him up to grade level. He was the only one who didn’t know that, though. As far as he knew, he read just fine.
5 Results and Discussion
The results and discussions from comparing wave force model effects on the structural responses and fatigue loads of the SFWT are presented in this section. Load cases, in-cluding regular waves, irregular waves, and coupled wind/waves, are considered. Each Load Case was run based on the PFT and ME models with or without second-order effects, which are mentioned in Section 4. The comparisons of the wave force model effects on the dynamic responses of platform motion, tower base bending moment,and tension in the mooring line are studied for operational and design conditions.
5.1 Regular Wave Conditions
Simulations of the SFWT subjected to regular wavesonly conditions (LC1 and LC2) were conducted. The simulation results of using different wave force models were compared with the experimental data (Coullinget al., 2013b;Robertsonet al., 2017). In the simulations of regular wave conditions, the wind turbine was parked, and the blades were feathered as well as in the model tests. The response amplitude operators (RAOs) and time series for platform surge, heave, and pitch motions, tower base bending moments, and tensions in mooring lines are used to perform the comparison. Fig.2 shows the RAOs in the operational wave condition (LC1) and design wave condition (LC2).Fig.3 presents the time series of platform motions and structural loads in the tower base and mooring lines. Many of the results are relatively consistent for the platform motions and the loads in the tower base and mooring lines.However, some notable differences are found between the simulations using different wave force models and the model test data.

Fig.2 RAOs for platform motions and loads in tower base and mooring lines. Notable differences are found in platform heave, tower base fore-aft bending moments, and mooring line 2 tensions.
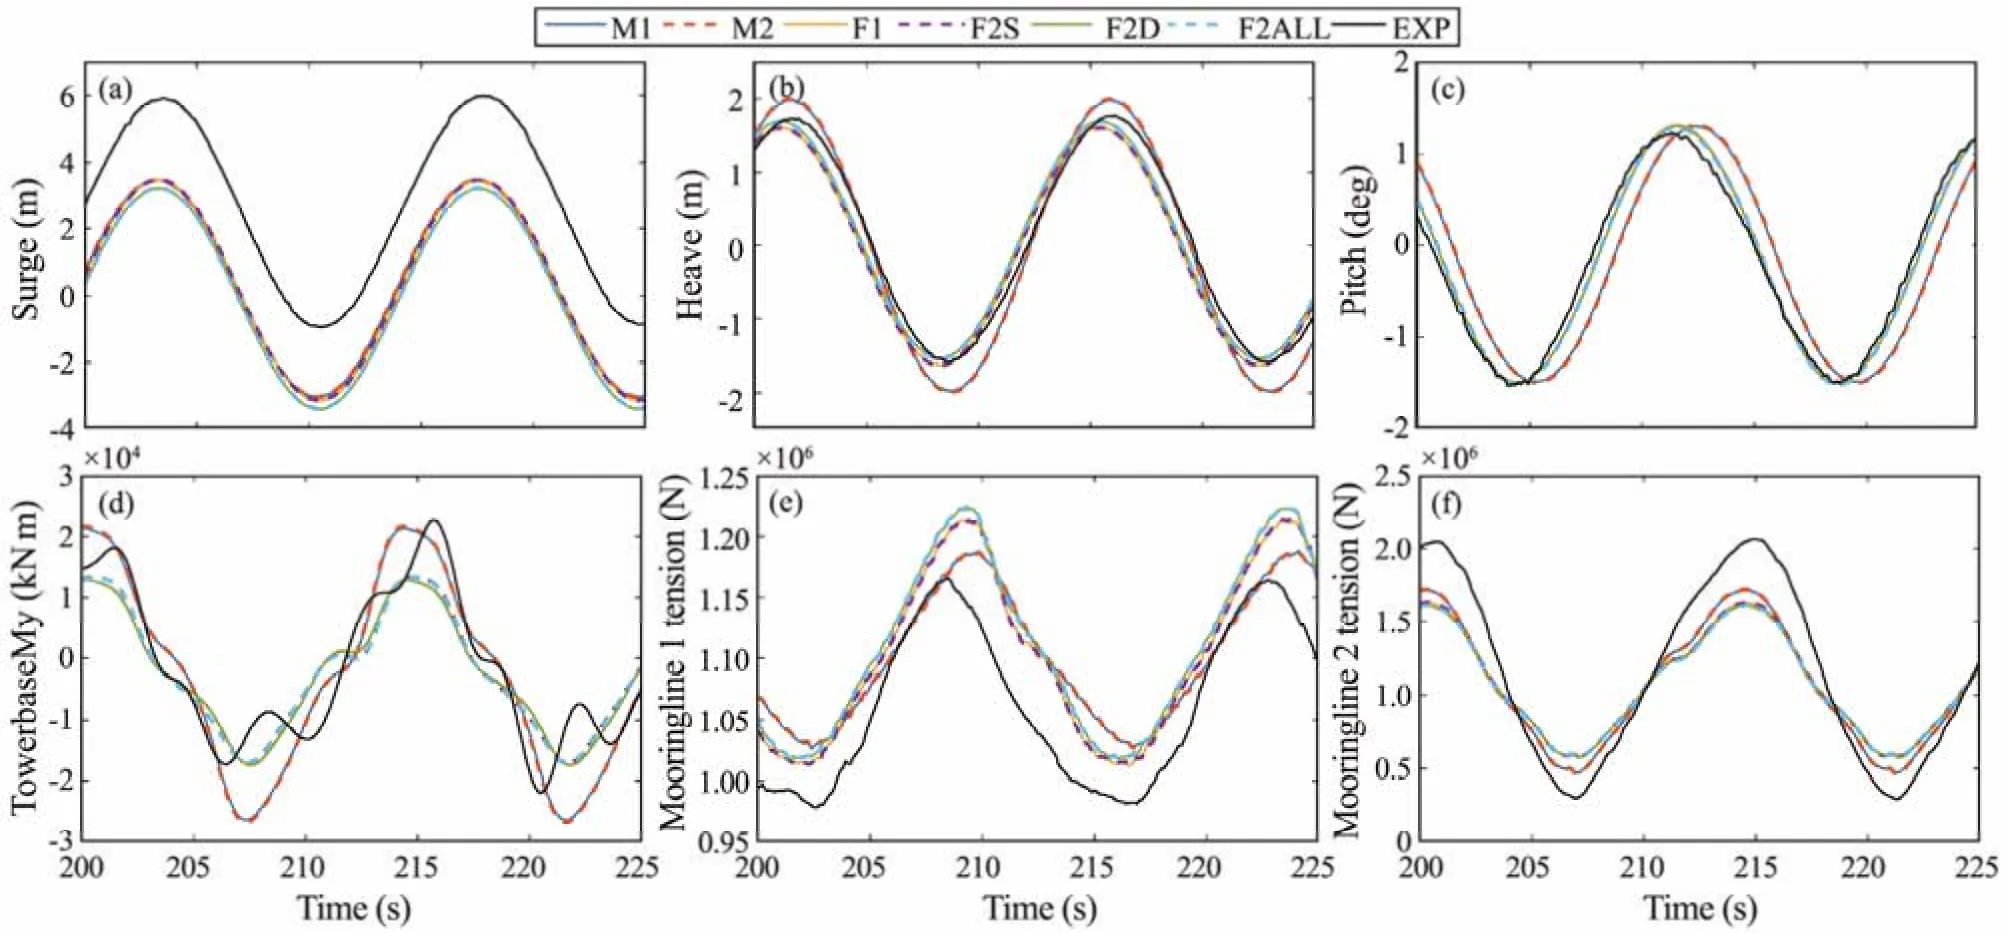
Fig.3 Time series for platform motions and loads in tower base and mooring lines in LC2.
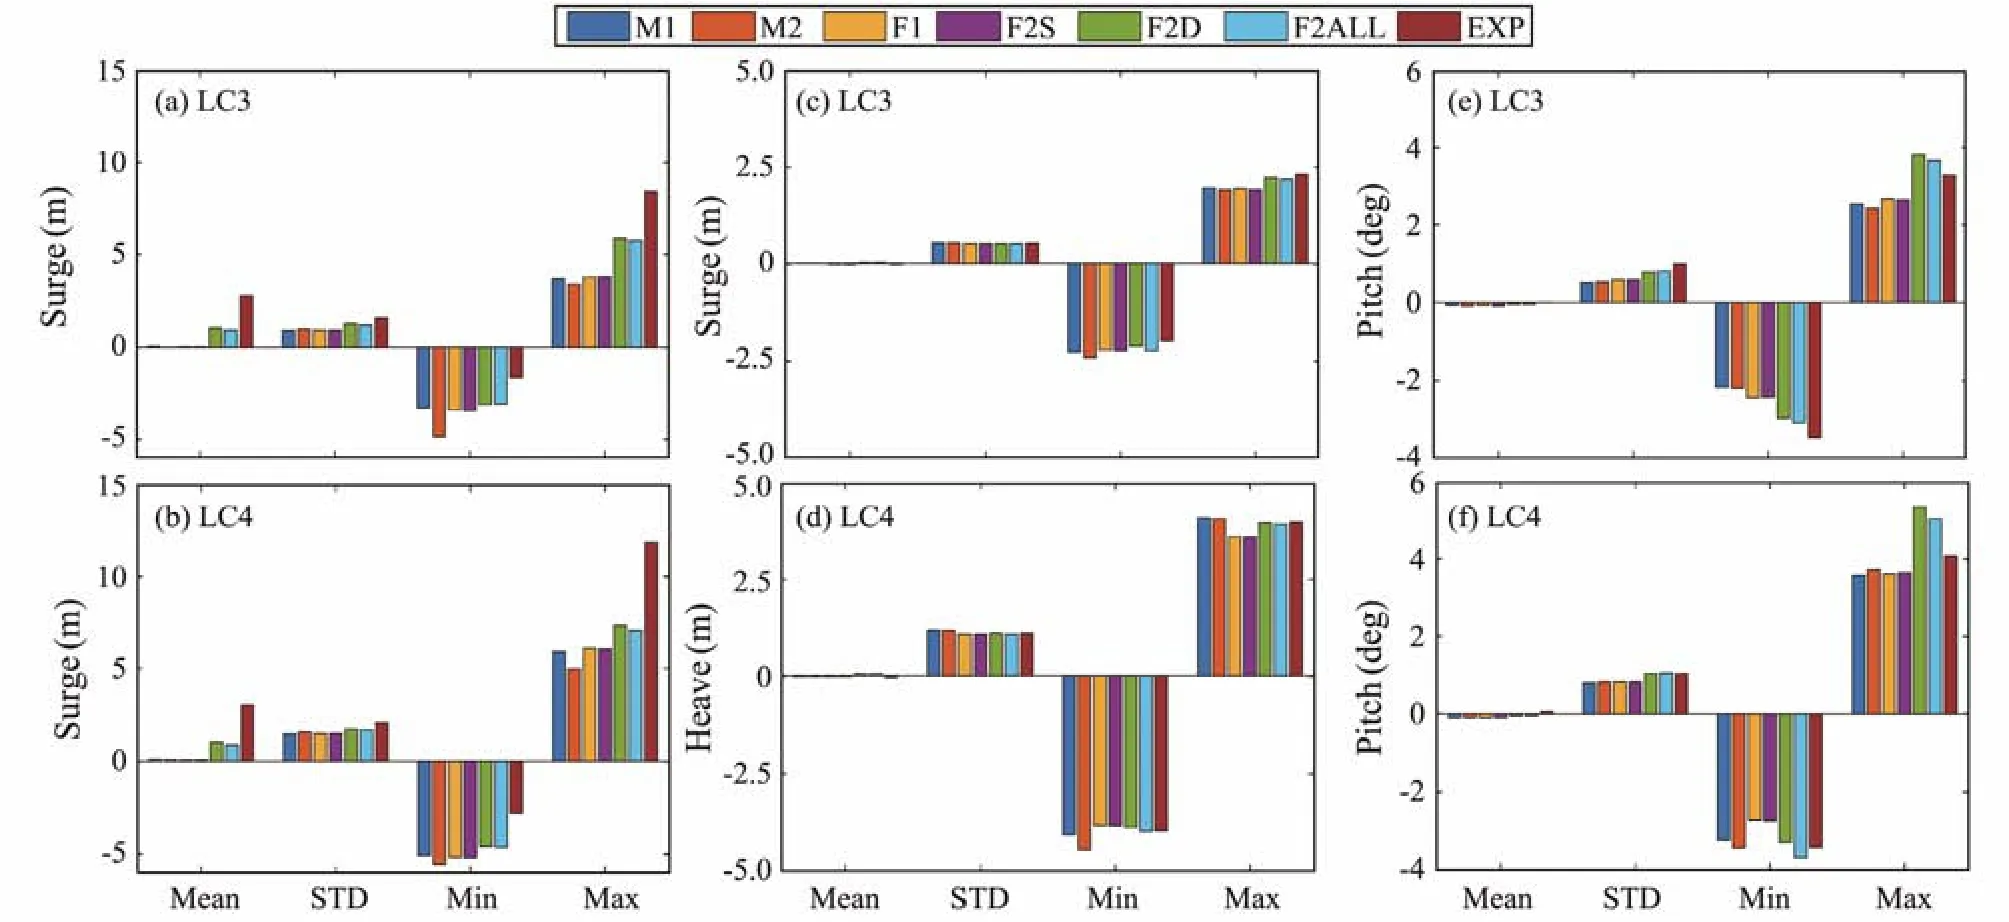
Fig.4 Statistical values of platform motions in irregular wave conditions (LC3 and LC4).

Fig.5 Statistical values of tower base bending moments and tensions in mooring lines in irregular wave conditions (LC3 and LC4).
As shown in Fig.2(a), similar magnitudes for the RAOs of surge motions are found in the simulation results and experimental data. However, for the time series of the surge in Fig.3(a), the simulation models underpredict the mean surge responses. This underprediction is likely due to the lack of mean wave forces in the simulation models.The RAOs of heave are consistent in LC1 (Fig.2(b)),while the ME models (M1 and M2) slightly overpredict the heave RAOs in LC2. Therefore, special attention should be paid to the selection of the added mass coefficientsCazand the axial viscous coefficientsCd, especially in the design wave conditions. Fig.2(d) shows the RAOs of the tower base fore-aft bending moments. All simulation models slightly underpredict the RAOs in LC1. In LC2, the ME models give relatively good results. The RAOs of the tensions in mooring lines 1 (downwind) and 2 (upwind) are investigated in Figs.2(e) and 2(f). The tensions in downwind mooring line 1 are well predicted in the simulation models. For upwind mooring line 2 in LC2, larger discrepancies are found in the PFT models than in the ME models. All simulation models underpredict the tension in mooring line 2, indicating that the dynamic effects in the mooring line were not well modeled in the simulations.
5.2 Irregular Wave Conditions
Two irregular wave load cases (LC3 and LC4) were used to compare the second-order wave force model effects on the structural responses of the SFWT. Figs.4 and 5 show the statistical results of platform motions and loads in the tower base and mooring lines, respectively. Some notable discrepancies are found in the surge, pitch, tower base fore-aft bending moments, and tensions in mooring line 2.Therefore, the power spectral densities (PSDs) for these responses are further investigated in Fig.6.
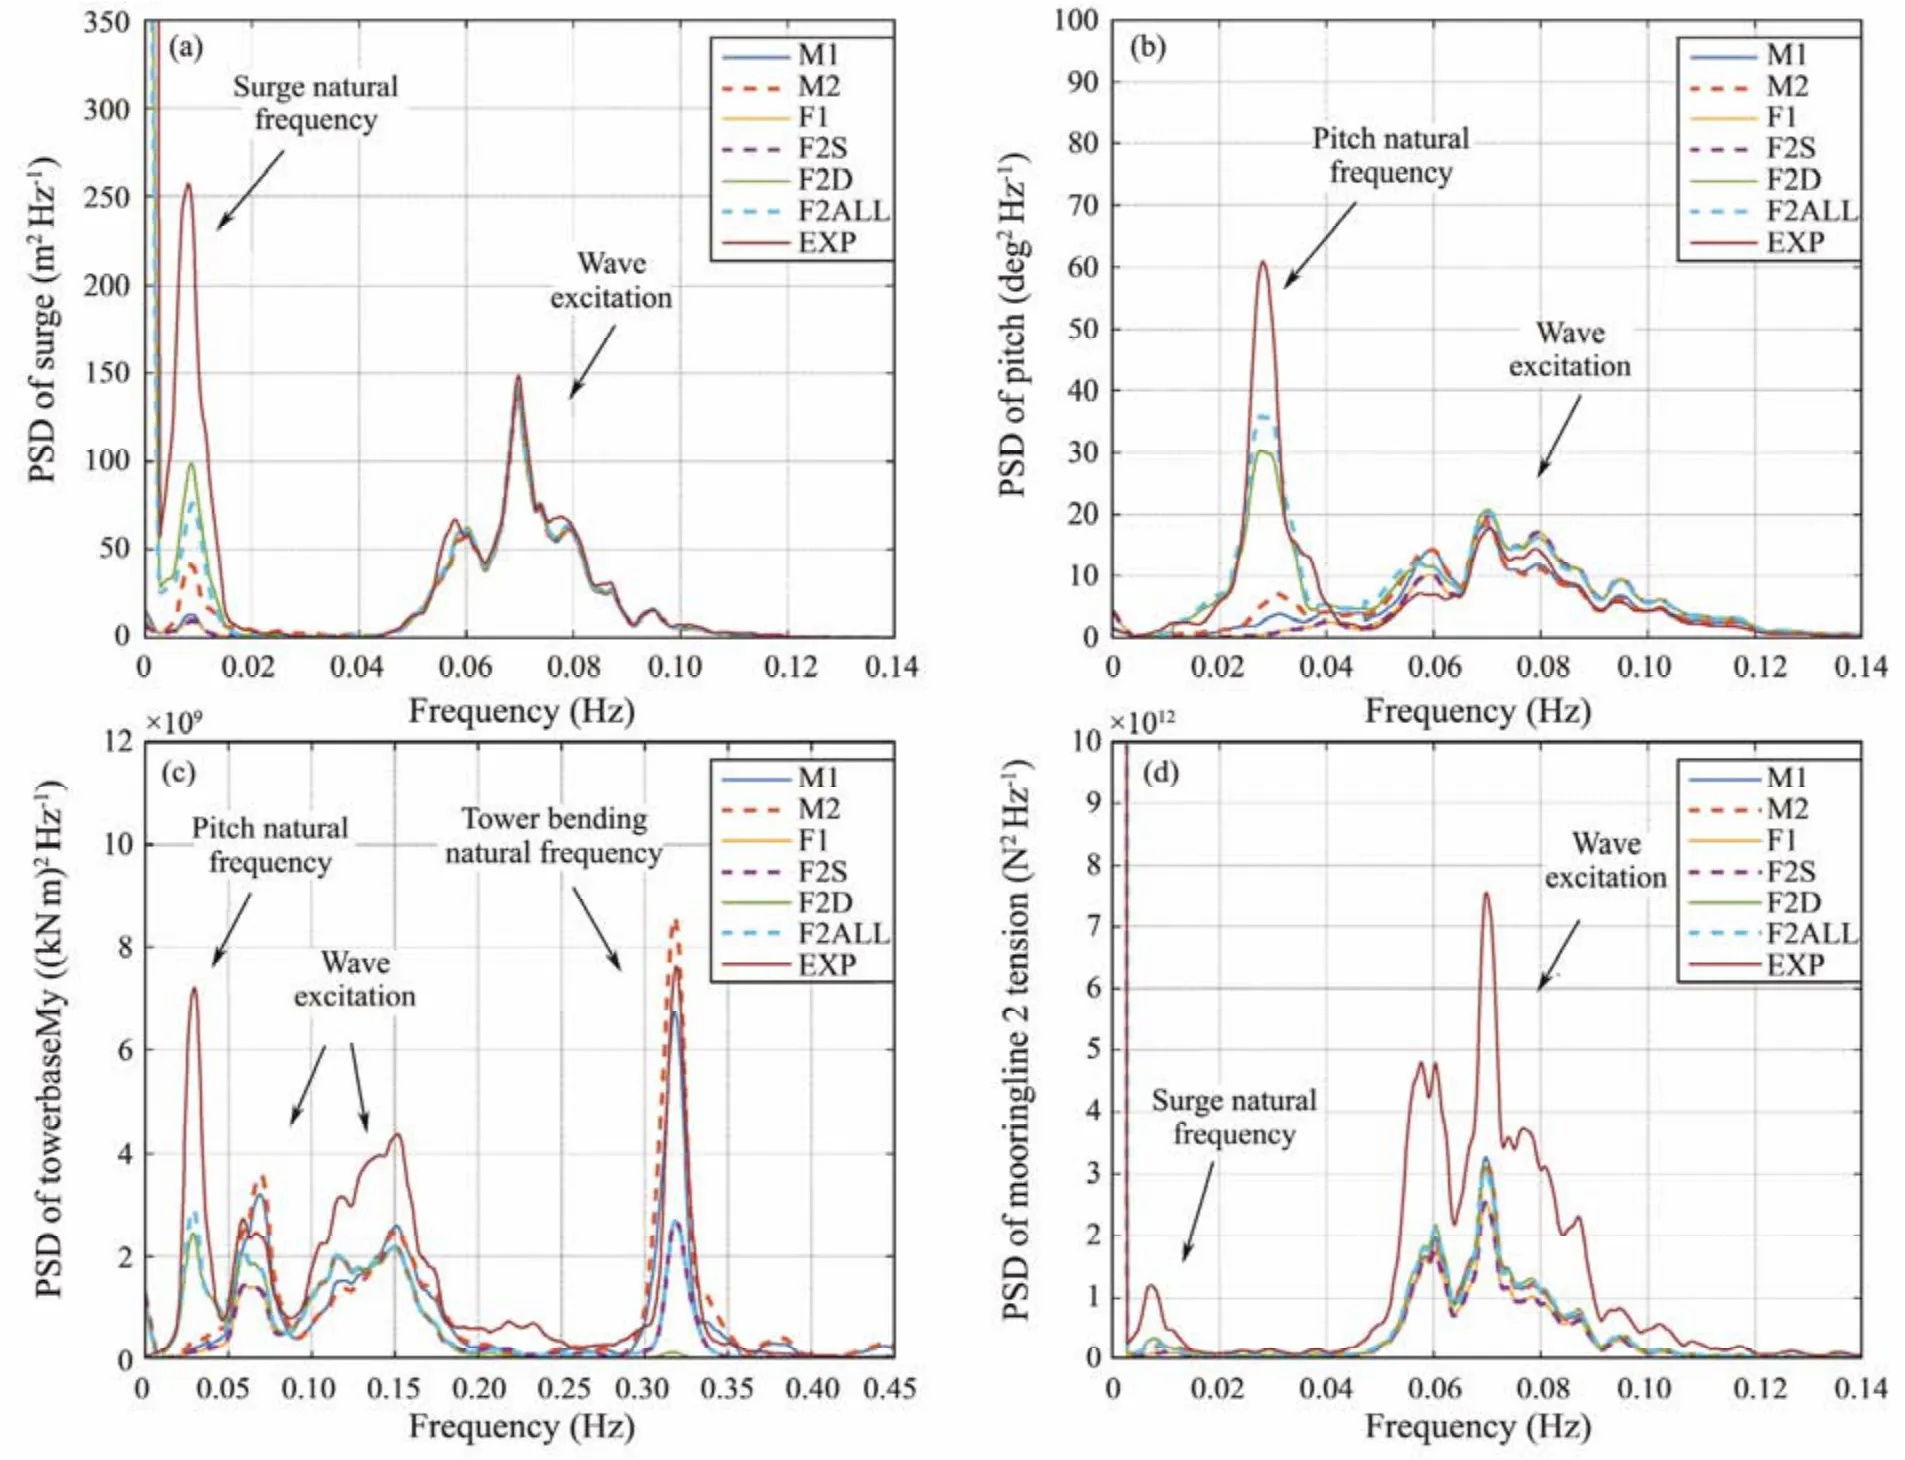
Fig.6 Power spectral density of platform motions and loads in tower base and mooring lines in LC4.
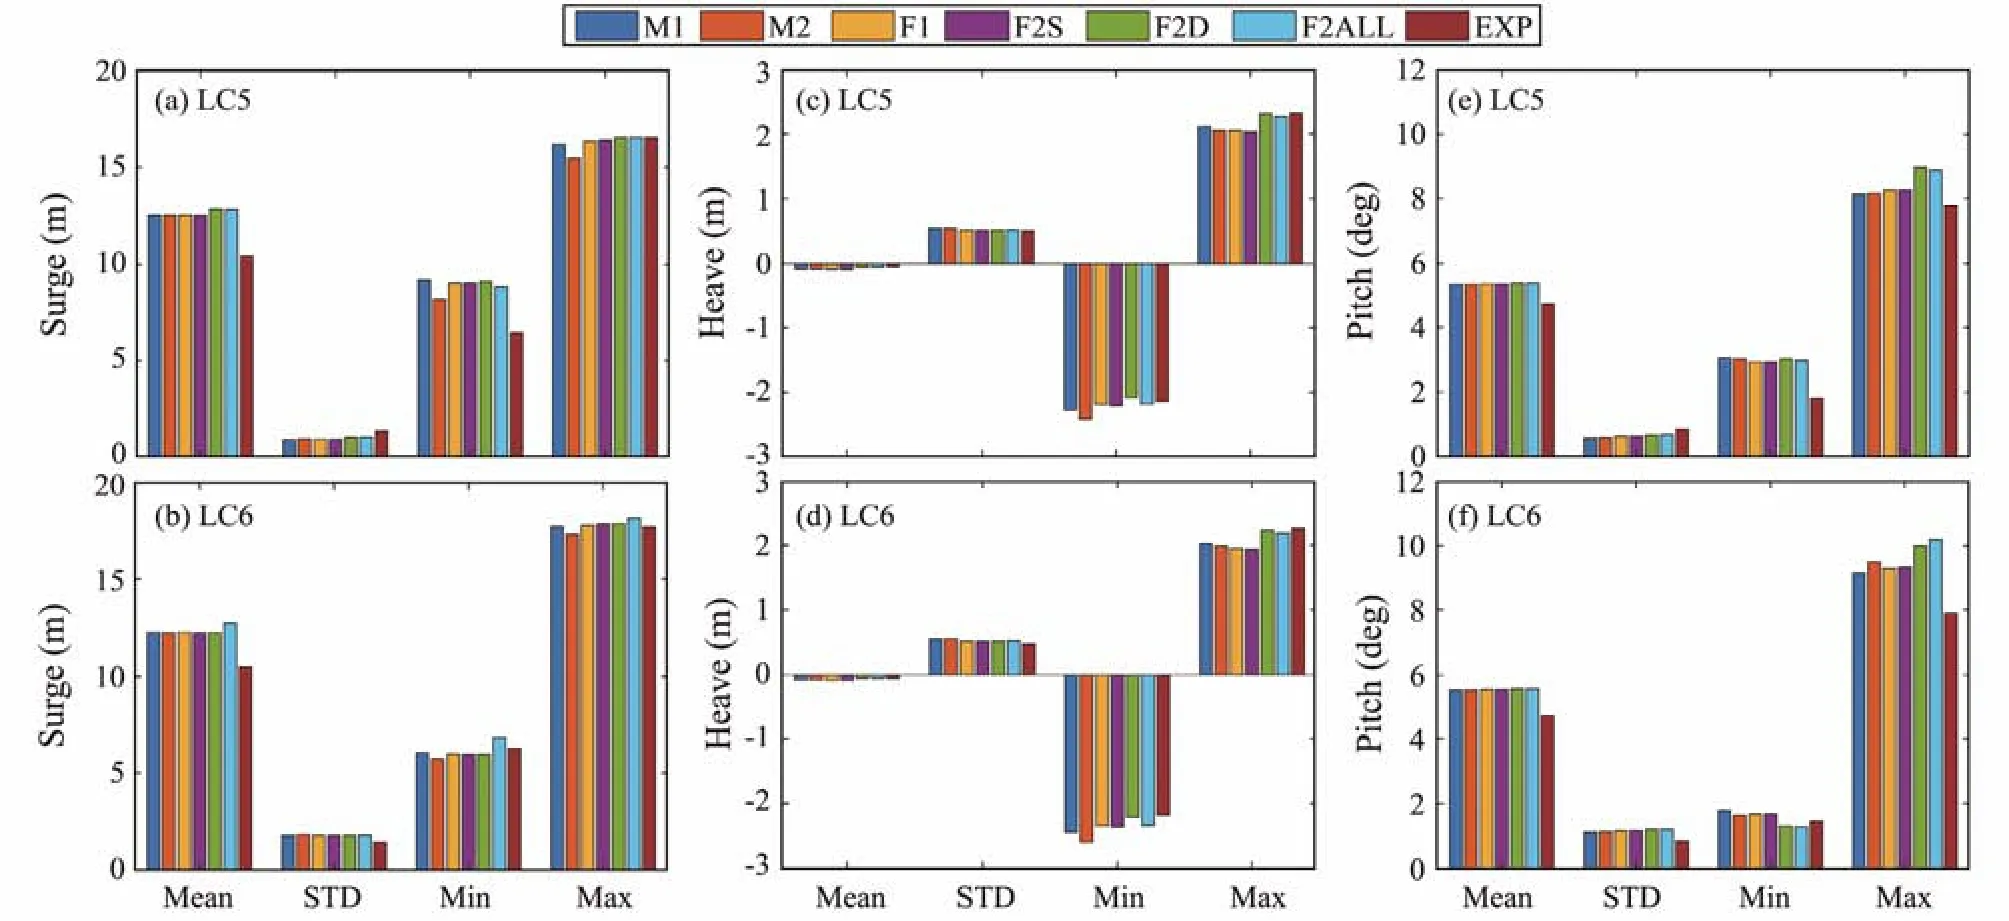
Fig.7 Statistical values of the platform motions in irregular wave conditions (LC5 and LC6).

Fig.8 Statistical values of loads in tower base and mooring lines in irregular wave conditions (LC5 and LC6).
For the surge in Figs.4(a) and 4(b), the ME models (M1 and M2) and the PFT models (F1 and F2S) give nearly zero-mean values. The mean values are non-zero in the models (F2D and F2ALL) that consider the effects of second-order Diff-Fre wave forces. However, these simulation models all underpredict the mean values compared with the experimental data because the mean wave forces could not be simulated accurately. The standard deviations (STDs)for the surge are reasonably consistent, especially for the models that consider the second-order Diff-Fre wave forces.The min and max surge responses have notable discrepancies. Further explanation of the PSD of the surge in LC4,as shown in Fig.6(a), indicates that the wave frequency responses are well captured for these simulation models,but the surge resonant responses are underpredicted. Figs.4(c) and 4(d) show that the simulations give satisfactory heave motion results from the models that consider the effects of second-order wave forces. Figs.4(e) and 4(f)show the statistical results for the pitch. The mean and STD values for the pitch are well predicted in the simulations. However, the max pitch responses are slightly overpredicted in the models of F2D and F2ALL. Further information on the PSDs for the pitch is shown in Fig.6(b).Although the statistical results are consistent, the wave frequency pitch responses appear to be slightly overpredicted, whereas the pitch natural frequency responses are underpredicted.
Figs.5(a) and 5(b) show the statistical results for tower base fore-aft bending moments in LC3 and LC4, respectively. The ME models (M1 and M2) give more satisfactory STDs and extreme values than the PFT models. For the PFT models, the results of the F2S model that considers the second-order Sum-Fre wave forces are closer to the experimental data in LC3 (operational wave condition).However, in LC4 (design wave condition), whose spectral peak period is larger, the accuracy of the F2S model is reduced. Drag forces seem to be more critical in an extreme seaway than in a moderate one. Fig.6(c) shows the PSDs of tower base fore-aft bending moments in LC4. The pitch natural frequencies, wave frequencies, and tower base bending frequency responses are found in the PSDs.The PFT models (F2D and F2ALL) that consider the second-order Diff-Fre forces capture the low-frequency pitchinduced responses, while the ME models (M1 and M2)and the PFT models (F2S and F2ALL) that consider the second-order Sum-Fre forces capture the high-frequency tower base resonances. Furthermore, the ME models (M1 and M2) give more reasonable predictions of the tower bending natural frequency responses. However, all simulation models do not seem to have produced particularly good predictions for the wave frequency responses. Figs.5(c) and 5(d) indicate that the simulations obtain satisfactory results for the tensions in mooring line 1. However, the prediction of tensions in mooring line 2 has notable discrepancies, especially in LC4. Fig.6(d) shows the PSDs for tensions in mooring line 2. All simulation models capture the response frequencies but do not reasonably predict the response amplitudes. The results of the PFT models that consider the second-order Diff-Fre wave forces are closer to the test result.
5.3 Coupled Wind/Wave Conditions
The results and discussions from responses in two wind and waves environmental conditions (LC5 and LC6) are presented in this section. LC5 is a coupled steady wind and irregular waves sea state, while LC6 is a coupled dynamic wind and irregular waves sea state. Figs.7 and 8 show the statistical results of the platform motions and loads in the tower base and mooring lines, respectively. The PSDs for the responses are further investigated in Fig.9.

Fig.9 PSD of platform motions and loads in the tower base and mooring lines in LC6.
As mentioned before, the simulation models underpredict the surge motion in the irregular wave conditions (LC3 and LC4). However, as shown in Figs.7(a) and 7(b), the statistical simulation surge results are in good agreement with the experimental results in the coupled wind/wave conditions. Moreover, the simulation models give consistent mean values, which are slightly larger than the experimental mean values, both in LC5 and LC6. In addition,as shown in Fig.9(a), the increases in the surge natural frequency response in the PSDs of the surge indicate that the wind forces, which are overpredicted in the simulations,govern the mean surges in the simulations of the coupled wind/wave conditions. Therefore, although the surge results are consistent, the underlying causes of the similar results are different. In Figs.7(c) and 7(d), the simulation models give satisfactory results for statistical values of platform heave. As shown in Figs.7(e) and 7(f), the simulation models slightly overpredict the statistical values for platform pitch. This finding can be explained in Fig.9(b), indicating that the wind-induced low-frequency and wave frequency responses are slightly overpredicted, whereas the pitch natural frequency responses are underpredicted.
5.4 Fatigue Loads
To compare the wave force model effects on fatigue damages of the SFWT, the fatigue loads for the tower base fore-aft bending moments and tensions in mooring line 2 are calculated as 1 Hz DEFLs, described in Section 3.3.
Fig.10 shows the 1 Hz DEFLs for tower base fore-aft bending moments in irregular waves-only (LC3 and LC4)and coupled wind/wave conditions (LC5 and LC6). The ME models (M1 and M2) give consistent results with the experimental data, while the PFT models give satisfactory results in the wind/wave conditions. However, in irregular waves-only conditions, the PFT models underpredict the fatigue loads for the tower base, even for the models that consider the second-order Sum-Fre wave forces. Fig.11 presents the 1 Hz DEFLs for tensions in downwind mooring line 2. In the irregular waves-only conditions, the simulation results underpredict the fatigue loads of mooring line 2.However, the simulation results are fairly consistent with the experimental data in the coupled wind/wave conditions,thereby indicating that the wind-induced fatigue loads on mooring line 2 may be overpredicted for the simulation models.

Fig.10 1 Hz DEFLs for the tower base fore-aft bending moment.

Fig.11 1 Hz DEFLs for the tensions in mooring line 2.
6 Conclusions
In this study, the wave force model effects on structural responses and fatigue loads of an SFWT were compared.Load cases, including regular waves, irregular waves, and coupled wind and waves, are considered and run based on the PFT and ME simulation models with or without second-order terms.
Many of the simulation results and the experimental data are relatively consistent for the regular waves-only conditions for the platform motions and the loads in the tower base and mooring lines. However, the RAOs for heave,tower base bending moments, and tensions in mooring line 2 exhibit notable discrepancies. PFT models produce more satisfactory results of platform heave but larger discrepancies of tower base bending moment than the ME models. In addition, all simulation models underpredict the tension in mooring line 2 because the dynamic effects of the mooring line could not be simulated.
In the irregular waves-only analysis, PFT models that consider the second-order Diff-Fre wave forces are able to capture the low-frequency responses, and the ME models and the PFT models that consider the second-order Sum-Fre wave forces are able to capture the high-frequency resonances. Thus, these simulation models appear to be able to capture the response frequency but cannot reasonably predict the response amplitude. The coupled wind and waves analysis showed more satisfactory results than the irregular waves-only analyses. However, an important detail to note is that the underlying causes of the overpredicted wind-induced response should be taken seriously.
The ME models give consistent tower base fore-aft bending moment DEFLs with the experimental data. However,in the irregular waves-only conditions, the PFT models underpredict the fatigue loads for the tower base. The simulation results are fairly consistent in the coupled wind and wave conditions, thereby indicating that the wind- induced fatigue loads may be overpredicted for the simulation models.
Acknowledgements
This research was funded by the National Natural Science Foundation of China (No. 51809135), the Shandong Provincial Natural Science Foundation (No. ZR2018BEE 047), the National Natural Science Foundation of China –Shandong Joint Fund (No. U2006229), and the SKL of HESS (No. HESS-1808). The authors would like to acknowledge the OC4 project participants for their experimental data and the OpenFAST teams.
Abbreviations
SFWT: semi-submersible floating wind turbine MSL: mean sea level
PFT: potential flow theory
ME: Morison equation
DEFL: damage equivalent fatigue load
QTF: quadratic transfer function
LCs: load cases
Second-order Diff-Fre: second-order difference-frequency
Second-order Sum-Fre: second-order sum-frequency
M1: ME with linear wave kinematics
M2: ME with second-order wave kinematics
F1: first-order wave forces using PFT with first-order viscous drag forces using ME
F2S: first-order and second-order Sum-Fre wave forces using PFT with first-order viscous drag forces using ME
F2D: first-order and second-order Diff-Fre wave forces using PFT with first-order viscous drag forces using ME
F2ALL: first-order and second-order Sum-Fre and Diff-Fre wave forces using PFT with second-order viscous drag forces using ME
RAO: response amplitude operator
STD: standard deviation
PSD: power spectral density
杂志排行

Journal of Ocean University of China的其它文章
- Using Natural Radionuclides to Trace Sources of Suspended Particles in the Lower Reaches of the Yellow River
- Eutrophication of Jiangsu Coastal Water and Its Role in the Formation of Green Tide
- Evaluation of the Shallow Gas Hydrate Production Based on the Radial Drilling-Heat Injection-Back Fill Method
- Microstructure Characterization of Bubbles in Gassy Soil Based on the Fractal Theory
- Morphological and Sulfur-Isotopic Characteristics of Pyrites in the Deep Sediments from Xisha Trough, South China Sea
- Deformation Characteristics of Hydrate-Bearing Sediments