Role of Stokes Drift in Ocean Dynamics Under Typhoon Conditions in the Bohai Sea
2024-03-12LIHaoqianWANKaiWANGMenghanDENGZenganandCAOYu
LI Haoqian , WAN Kai, WANG Menghan, DENG Zeng’an, , and CAO Yu
1) North China Sea Marine Forecasting Center, Qingdao 266061, China
2) Shandong Provincial Key Laboratory of Marine Ecology and Environment & Disaster Prevention and Mitigation,Qingdao 266061, China
3) North China Sea Offshore Engineering Survey Institute, Qingdao 266061, China
4) School of Marine Science and Technology, Tianjin University, Tianjin 300072, China
5) South China Sea Marine Forecasting Center, Guangzhou 510006, China
Abstract The effect of Stokes drift production (SDP), which includes Coriolis-Stokes forcing, Langmuir circulation, and Craik- Leibovich vortexes, on the upper ocean during typhoon passage in the Bohai Sea (BS), China, is investigated by using a coupled wavecurrent model. The role of SDP in turbulent mixing and the further dynamics during the entire typhoon period are comprehensively studied. Experimental results show that SDP greatly increases turbulent mixing at all depths under typhoon conditions by up to seven times that under normal weather conditions. SDP generally strengthens sea surface cooling by more than 0.4℃, with the maximum reduction in sea surface temperature (SST) at the during-typhoon stage exceeding 2℃, which is approximately seven times larger than that under normal weather conditions. The SDP-induced decrease in current speed can exceed 0.2 m s−1, and the change in current direction is generally opposite the wind direction. These results suggest that Stokes drift depresses the effect of strong winds on currents by intensifying turbulent mixing. Mixed layer depth (MLD) is distinctly increased by O(1) during typhoons due to SDP and can deepen by more than 5 m. In addition, the continuous effects of SDP on SST, current, and MLD at the after-typhoon stage indicate a hysteretic response between SDP and typhoon actions.
Key words Stokes drift production; Langmuir turbulence; rurbulent mixing; typhoon; coupled model
1 Introduction
Surface waves greatly affect circulation and thermohaline structures and thus modulate production and dissipation in the upper ocean. Stokes drift production (SDP) and wave breaking are the two main mechanisms through which surface waves affect upper ocean structures and dynamics.Previous studies (Kantha and Anne Clayson, 2004; Nohet al., 2004; Liet al., 2013) have proven that the wavebreaking effect is limited to several meters immediately below the ocean surface. Stokes drift has been widely confirmed to play a key role in upper ocean dynamics and thermohaline mechanisms. SDP regulates the turbulent mixing of upper layers principallyvialarge-scale Coriolis-Stokes forcing (CSF), small-scale Langmuir circulation (LC), and resolved-scale Craik-Leibovich vortex forcing (CLVF). As a result of SDP (which is used to refer to CSF, LC, and CLVF thereafter), the instability of the vertical shear in the upper layers may be promoted, thus allowing for the deepened penetration of the momentum and heat flux and therefore the depression of the mixed layer.
Many modifications based on the Mellor-Yamada closure scheme (M-Y2.5), a typical second-moment turbulent closure model, have been proposed to improve the parameterization of turbulent mixing by introducing Stokes drift. Kantha and Anne Clayson (2004, KC04) added LCinduced kinetic energy into M-Y2.5 parameterization and solved the issue of an excessively thin simulated mixing layer. Harcourt (2015, H15) adopted the inhomogeneous pressure-strain rate and pressure-scalar gradient closures and modified the stability function in the second-moment model to match the CLVF term. On the basis of the above improved parameterizations, the mechanisms between wave processes and upper ocean thermal structures under normal weather conditions were discussed (Liet al., 1995;Polton and Belcher, 2007; McWilliamset al., 2012; Zhanget al., 2012; Liet al., 2013; Pearsonet al., 2015; Nohet al.,2016; Wanget al., 2018), suggesting that LC can enhance upper ocean mixing notably.
Typhoons, as extreme weather events, drastically affect the ocean surface, induce intense waves with wave heights of up to 15 m, and drive strong currents with speeds as high as > 1 m s−1. As a consequence, thermohaline structures can be greatly changed. Air-sea fluxes, as the direct contributor to the typhoon energy budget, remarkably dictate typhoon intensity (Emanuel, 1991). In typhoon prediction models, the sea surface temperature (SST) and current are used to calculate air-sea heat and momentum fluxes. The responses of the SST and current to typhoons are considerably modified by upper-ocean turbulent mixing. Thus,accurately estimating turbulent mixing, particularly its wave-induced component, under extreme conditions, such as typhoons, is necessary. The effects of wave- induced mixing on thermal responses to typhoons in the Yellow,East, and South China Seas and east of the Luzon Strait have been previously discussed (Zhanget al., 2012; Liet al., 2014; Zhanget al., 2017; Fanet al., 2018; Zhanget al., 2018). However, the role of SDP (CSF, LC, and CLVF) in mixing and other dynamics under typhoon conditions, despite their rarity in the Bohai Sea (BS), is poorly studied.
The BS is characterized by its shallow but complex topography and lies to the northwest of the Pacific Ocean. It consists of Liaodong Bay, Bohai Bay, Laizhou Bay, the Central Sea Area, and Bohai Strait (Fig.1a). This region suffers from frequent storm activities, including typhoons.Although typhoons occur infrequently in this region, they can cause dramatic losses and heavy damage considering the dense population around this region. This possibility motivates us to investigate the role of SDP under extreme weather conditions.
In this study, we analyze how the SDP term regulates turbulent mixing and consequently the ocean responses to typhoons under extreme weather conditions by introducing Langmuir turbulence (viaLC) into the turbulence model and CSF and resolved-scale CLVF into momentum equations. A case study on Super Typhoon Matsa (2005) is then presented and discussed.
2 Methods
A coupled wave-current modeling system (Fig.2) is constructed by combing the Princeton ocean model with the generalized coordinate system (POMgcs, Ezer and Mellor,2004) and the simulating waves nearshore model (SWAN,Booijet al., 1999). Stokes drift is calculated with the wave spectrum from SWAN by using the following equation(Webb and Fox-Kemper, 2011):
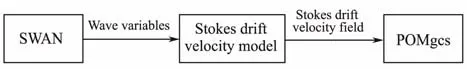
Fig.2 Brief diagram of the wave-current modeling system illustrating the input and output of different modules.
whereSfθis the wave frequency-direction spectrum,θis the wave direction, andfis the wave frequency. The Stokes drift field is then introduced into POMgcs to represent SDP.The impacts of currents on waves are not considered in this work, and we mainly focus on the effects of SDP on ocean dynamics. We do not discuss the feedback impacts from currents to waves. The specific scheme is given in the following subsections.
2.1 Ocean Current Model
POMgcs, which was developed on the basis of its predecessor, namely, the Princeton ocean model (Blumberg and Mellor, 1987), is a 3-D, primitive-equation, free-surface, coastal circulation model with the M-Y2.5 turbulence closure scheme. It has been widely used to simulate ocean currents/circulation.
When CSF and the resolved-scale CLVF are considered,the horizontal momentum equations in POMgcs can be modified as follows (McWilliams and Restrepo, 1999; Reichlet al., 2016a; Caoet al., 2019):
wherex, yare the horizontal coordinates;kis the vertical coordinate;skis the layer thickness of thekth level;ωis the vertical velocity; (U, V) are the horizontal components of the Eulerian mean current with (Us, Vs) as the horizontal components of Stokes drift;fis the Coriolis parameter;ρ0is the reference water density andρ'is the density deviation;KMis the vertical mixing coefficient;Fxis the horizontal viscosity term; andFyis the horizontal diffusion term. (CSFX, CSFY) are the horizontal components of CSF.(CLVFX, CLVFY) are the horizontal components of CLVF.
The parameterization H15, which is based on M-Y2.5,is introduced to represent LC. In consideration of LC, the turbulent kinetic energy (TKE) and turbulent length scale equations are modified accordingly. The inclusion of LC can be represented as following:
with
whereqis the TKE;lis the turbulence length scale;KHandKqare the vertical diffusion coefficients for temperature and turbulence kinetic energy, respectively;is the corrected density;is the wall proximity function;Fqis the horizontal diffusion term for TKE; andFlis the turbulence length scale. The constantsE1=E3= 1.8,B1= 16.6 are taken in accordance with Mellor and Yamada (1982).E6is a new parameter related to Langmuir turbulence,and its value is equal to 4E1following KC04.andvωare vertical turbulent flux terms.KMSis a new vertical kinematic viscosity coefficient derived from the new stability functionSMSin H15.
The modeling domain covers the entire BS region that ranges from (37.083˚N, 117.52˚E) to (41.033˚N, 122.47˚E).The horizontal resolution is 1/20˚ × 1/20˚, which is thought to be sufficiently fine for resolving the associated processes in this study. Bathymetry is extracted from the global 2 min ETOPO2 dataset of the National Oceanic and Atmospheric Administration. Given that the average water depth is about 18 m and the maximum is less than 70 m in the BS,six terrain-following coordinates are specified in the vertical. All of the model outputs are interpolated to six standardz-levels,i.e., 0, 5, 15, 25, 35, and 65 m. The internal-mode time step of the current model is 200 s, and the corresponding external-mode time step is 3.33 s.
The model initialization fields consist of temperature,salinity, and current velocity obtained from China Ocean Reanalysis. A stable current field is obtained by spinning up the POMgcs for two years. The integration time of diagnostic experiments spans from 7 August 2005 to 10 August 2005 and covers the entire duration of Super Typhoon Matsa in the BS. The simulation is forced by heat fluxes and winds derived from the National Centers for Environmental Prediction and the European Centre for Medium-Range Weather Forecasts (ECMWF), respectively. The temporal resolution of heat fluxes and winds is 6 h. The spatial resolution of wind is interpolated from 1/8˚ × 1/8˚ to 1/20˚ × 1/20˚ by using the nearest interpolation algorithm.In addition, the tidal elevation forcing at the open lateral boundaries includes the four main tidal components of M2,S2, K1, and O1derived from a 3-D tidal model (Hanet al.,2006).
2.2 Ocean Wave Model
SWAN is a third-generation wave model based on the spectral action balance equation adopting the linear random gravity wave theory. It is widely used to simulate regional sea surface waves. The modeling domain, topography, wind forcing, horizontal resolution, and time step(200 s) for wave simulations are all consistent with those used in the current model (POMgcs). The output time interval of wave parameters is 1 h.
2.3 Typhoon Winds and Stokes Drift
Super Typhoon Matsa is selected as the representative study case because it is one of the strongest typhoons that visited the BS. The wind field of Matsa is taken from the ECMWF dataset. Fig.1b shows Matsa’s track. Matsa first appeared to the east of the Philippines on 31 July 2005,developed into a strong typhoon on 4 August, and made landfall on 6 August in Zhejiang Province, China. It entered the BS on 8 August and gradually decayed into an extratropical cyclone the day after. Matsa impacted the BS mainly from 8 August 2005 to 9 August 2005 (Fig.1a)when its maximum wind speed exceeded 20 m s−1. Here,we focus on the outputs in the entire typhoon period,i.e., 7– 10 August 2005. Four panels in Fig.3 illustrate the evolution of surface winds during Typhoon Matsa.
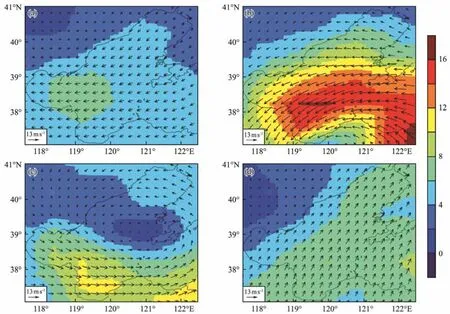
Fig.3 Evolution of sea surface winds (10 m) (magnitude in color) at 0000 UTC on (a) 7, (b) 8, (c) 9, and (d) 10 August 2005.
The calculated Stokes drift on the sea surface is given in Fig.4, which shows that Stokes drift is largely determined by surface winds given the consistent direction and positive correlation of their magnitude.

Fig.4 Horizontal distribution of Stokes drift direction and speed (m s−1) at 0000 UTC on (a) 7, (b) 8, (c) 9, and (d) 10 August 2005.
3 Model Validation
The tidal constituents’ harmonic constants and SSTs are validated to verify the accuracy of our simulations. The tidal constants from observations at eight tidal stations (Table 1; Zhanget al., 2009) in the BS are compared with the tidal constants analyzed from the simulations performed by our modeling. Fig.5 presents the fitted results of the observed and simulated tidal amplitudes for M2and K1. It shows a favorably good agreement. The good agreement of the corresponding tidal phase lag indicates the absence of noticeable systematic errors in our simulations.
Table 1 Locations of eight tidal stations in the BS
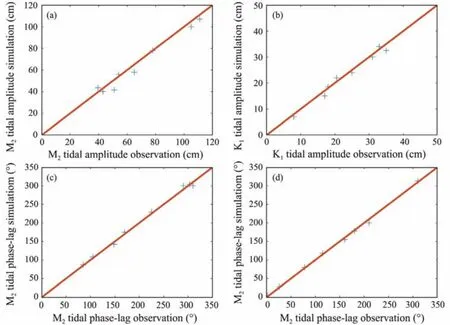
Fig.5 Fitted plots of the observed and simulated amplitudes of (a) M2 and (b) K1 and the observed and simulated phase-lags of (c) M2 and (d) K1.
We also compare the simulated SST with the satellite remote-sensing SST (from the Copernicus Marine Service,Fig.6). The spatial pattern of the simulated SST on 7 August matches that of satellite data, especially in the three bays. The simulated temperature is lower than the observation only in the Bohai Strait. The mean absolute error of SST is about 0.90℃, and in some regions the deviation of SST is very small, indicating that the model results are basically accurate.

Fig.6 Horizontal distributions of SST (℃) from (a) simulations and (b) satellite remote-sensing observations on 7 August 2005.
4 Results and Discussion
In our previous study (Caoet al., 2019), the specific effects of each SDP term (LC, CSF, and CLVF) on ocean dynamics under normal weather conditions were comprehensively investigated and compared with each other. Therefore, we will not repeat this work given the space limitation of this article. In the present work, two additional sensitivity experiments are implemented: WAVE- ALL, which includes all SDP terms, and WAVE-NON, which excludes SDP. WAVE-NON is the controlled experiment, and the responses of ocean processes to the typhoon, as well as the impacts of SDP on turbulent mixing and ocean dynamics,are detected by comparing the simulations of WAVE-NON with those of WAVE-ALL. We present and discuss our results in detail at three stages,i.e., pre-typhoon, duringtyphoon, and after-typhoon.
First, we determine how vertical turbulent mixing is regulated by the SDP term under typhoon conditions.KMandKMSare the vertical kinetic viscosity coefficients from WAVE-NON and WAVE-ALL, respectively. Fig.7a shows the monthly mean vertical kinetic viscosity coefficient under normal weather conditions (June 2005) from our previous study (Caoet al., 2019). The mixing coefficient at the pre-typhoon stage on 7 August (Fig.7b) is generally consistent with that under normal weather conditions (Fig.7a). The slight differences between the 5 and 15 m levels observed in Figs.7a and 7b may have resulted from the highly stable vertical stratification in August 2005. The impacts of Stokes drift on upper ocean mixing tend to strengthen with the increase in depth, indicating that the waves can generally penetrate to the bottom depth in the BS. At the during-typhoon stage (8 August), the mixing coefficients (KMandKMS) are largely elevated by approximately one order of magnitude, demonstrating that strong winds favor the injection of the TKE into a considerably deeper level as a consequence of the enhancement in turbulent mixing (Fig.7c). The vertical kinetic viscosity is further enhanced with SDP. The difference betweenKMandKMSunder typhoon conditions exceeds 0.008 m2s−1, which is approximately seven times larger than that under normal weather conditions. This result highlights the importance of SDP in turbulent mixing under typhoon conditions. The influences of Stokes drift on mixing are relatively strong in the upper 30 m at the duringtyphoon stage (Fig.7c) in contrast to those in the 30 – 50 m configuration at the pre-typhoon stage (Fig.7b). At the after-typhoon stage (10 August), TKE injection is markedly decreased. As a result, the magnitudes ofKMandKMSgenerally decrease to their pre-typhoon levels (Fig.7d) but are still higher than their normal weather levels (Figs.7a and 7b). These results suggest that KMand KMSare gradually recovering to their pre-typhoon levels. The deviation betweenKMandKMSon 10 August is similar to that at the pre-typhoon stage. Its maximum value of about 0.001 m2s−1appears at the 15 m layer, which is shallower than that at the pre-typhoon stage. The peak signature of the SDP term can be found in deeper layers shortly after the passage of the typhoon, and its level is also gradually restored to normal.

Fig.7 Vertical kinetic viscosity coefficient (m2 s−1) (a) under normal weather conditions (adopted from Cao et al., 2019);vertical kinetic viscosity coefficient (m2 s−1) simulated at 0000 UTC on (b) 7, (c) 8, and (d) 10 August 2005 in this study. KM and KMS are the kinetic viscosity coefficients from WAVE-NON and WAVE-ALL, respectively.
4.1 Pre-Typhoon Stage
This stage occurred before 8 August 2005, when Masta was close to but had not entered the BS. The horizontal distributions of SST simulated by WAVE-NON and WAVEALL on 7 August are shown in Figs.8a and 8b, respectively.Fig.8c illustrates the differences between the SSTs from the two simulations. The SST from WAVE-ALL is lower than that from WAVE-NON in most of the study regions,indicating that SDP generally decreases SST. In particular,in the southern part of Liaodong Bay, the eastern part of Bohai Bay, and the Miaodao Islands, the reduction in SST reaches about 0.3℃. This situation is similar to the summer case under normal weather conditions previously discussed by Caoet al.(2019). The difference in SST percentage (Fig.8d) shows that large changes appear near Laizhou Bay and Bohai Bay. The maxima of these changes can reach about 1.8% (Zhaoet al., 2019). In most of the BS regions, the effect of Stokes drift on SST is less than 0.4%,suggesting that, similar to that under normal weather conditions, the impact is relatively slight at the pre-typhoon stage.
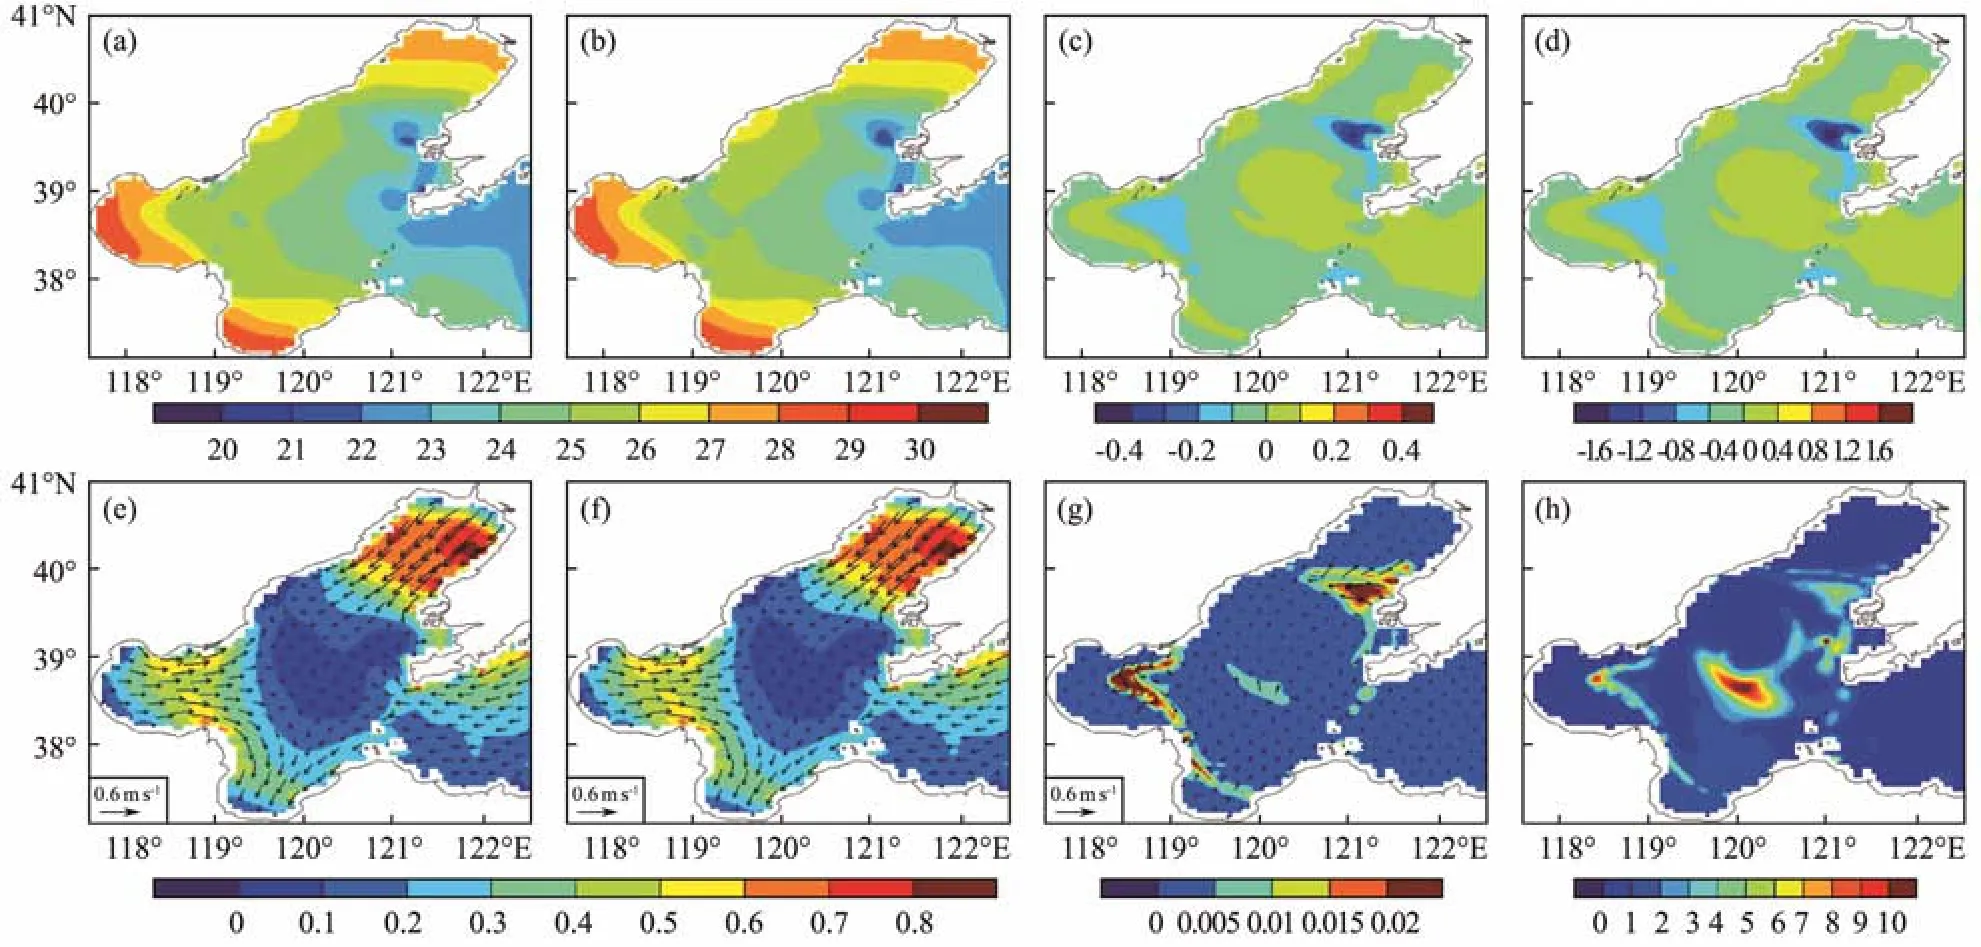
Fig.8 Horizontal distributions of (a) SST (℃) from WAVE-NON, (b) SST (℃) from WAVE-ALL, (c) SST difference (℃)between WAVE-NON and WAVE-ALL, (d) SST difference in percentage (%) between WAVE-NON and WAVE-ALL, (e)current (m s−1) from WAVE-NON, (f) current (m s−1) from WAVE-ALL, (g) current difference (m s−1) between WAVE-NON and WAVE-ALL, (h) current difference in percentage (%) between WAVE-NON and WAVE-ALL at 0000 UTC on 7 August 2005. Contours depict current speed, and arrows represent the current direction.
MLD is defined as the depth of the water layer with a temperature difference of 0.5℃ from the sea surface in accordance with Yablonsky and Ginis (2008). The profile along 38.333˚N, as the widest section crossing the BS, is plotted to illustrate the spatial variability of MLD. Fig.9a shows that in most of the coastal waters, the mixed layer penetrates deep down to the sea floor, indicating that the water is well mixed. When the longitude exceeds 119˚E,MLD decreases rapidly and remains stable at about 1 m due to the obvious vertical stratification of temperature during summer and the marked temperature difference between the surface and subsurface. In WAVE-ALL, the mixed layer is deepened slightly. However, this amount of change is negligible compared with the entire water depth,indicating that the impact of Stokes drift is relatively weak under low-wind conditions.
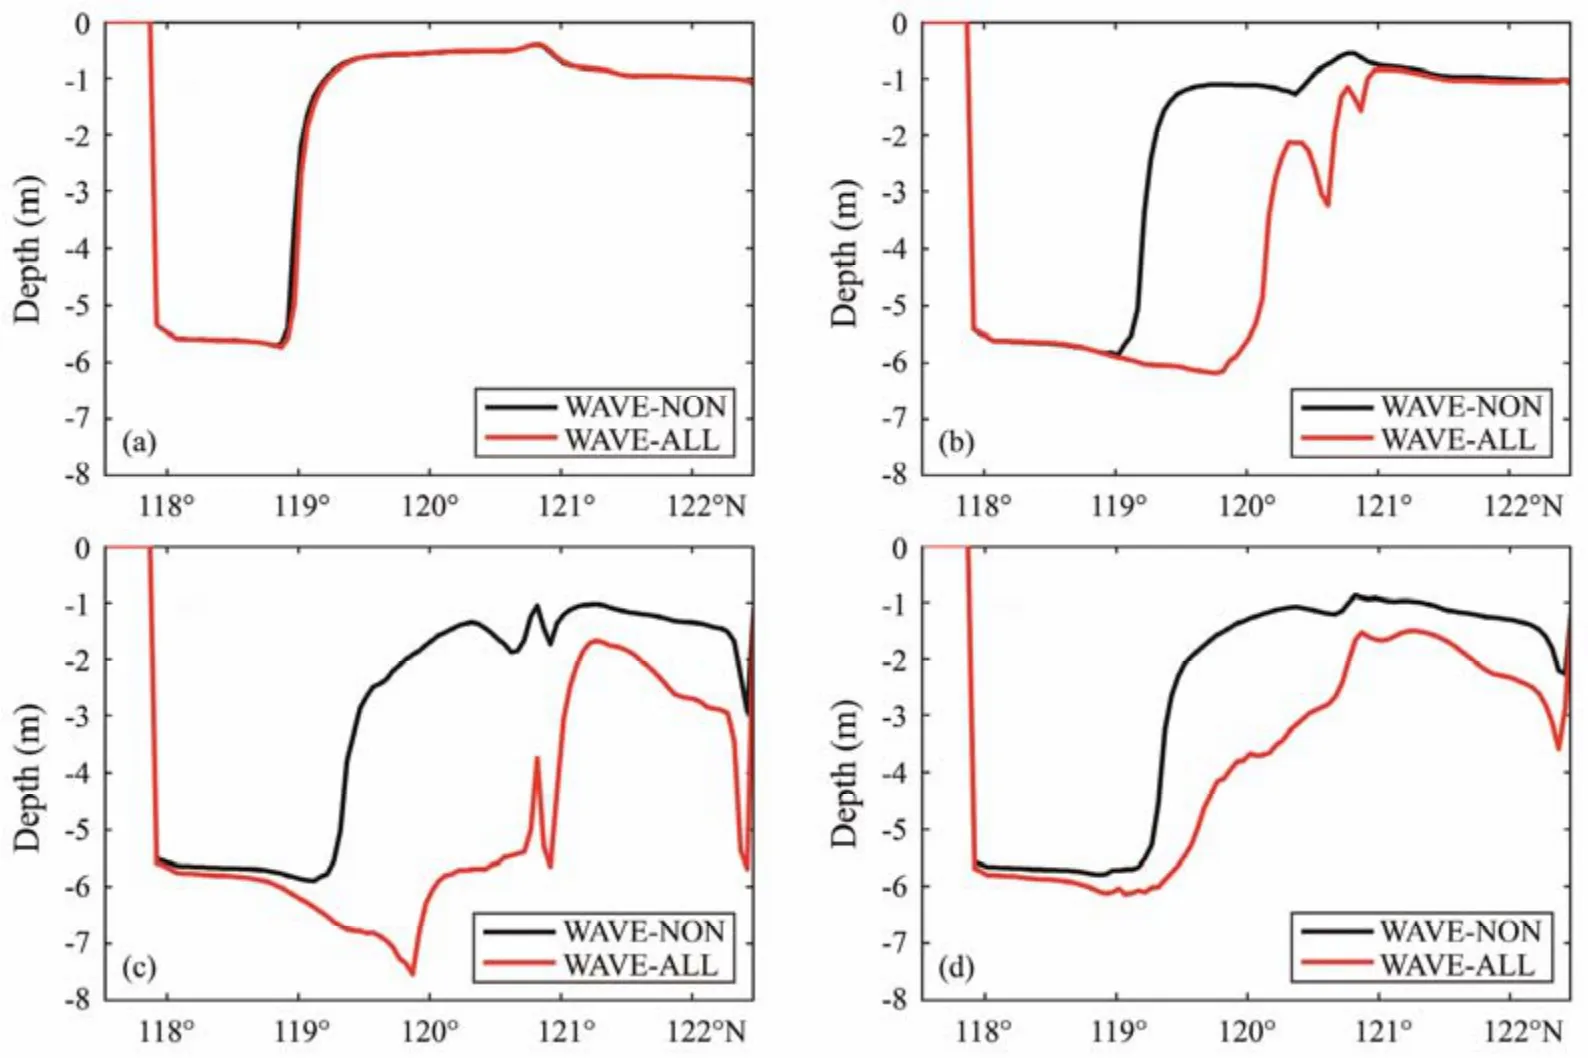
Fig.9 MLD from WAVE-NON and WAVE-ALL along the 38.333˚N section at 0000 UTC on (a) 7, (b) 8, (c) 9, and (d) 10 August 2005.
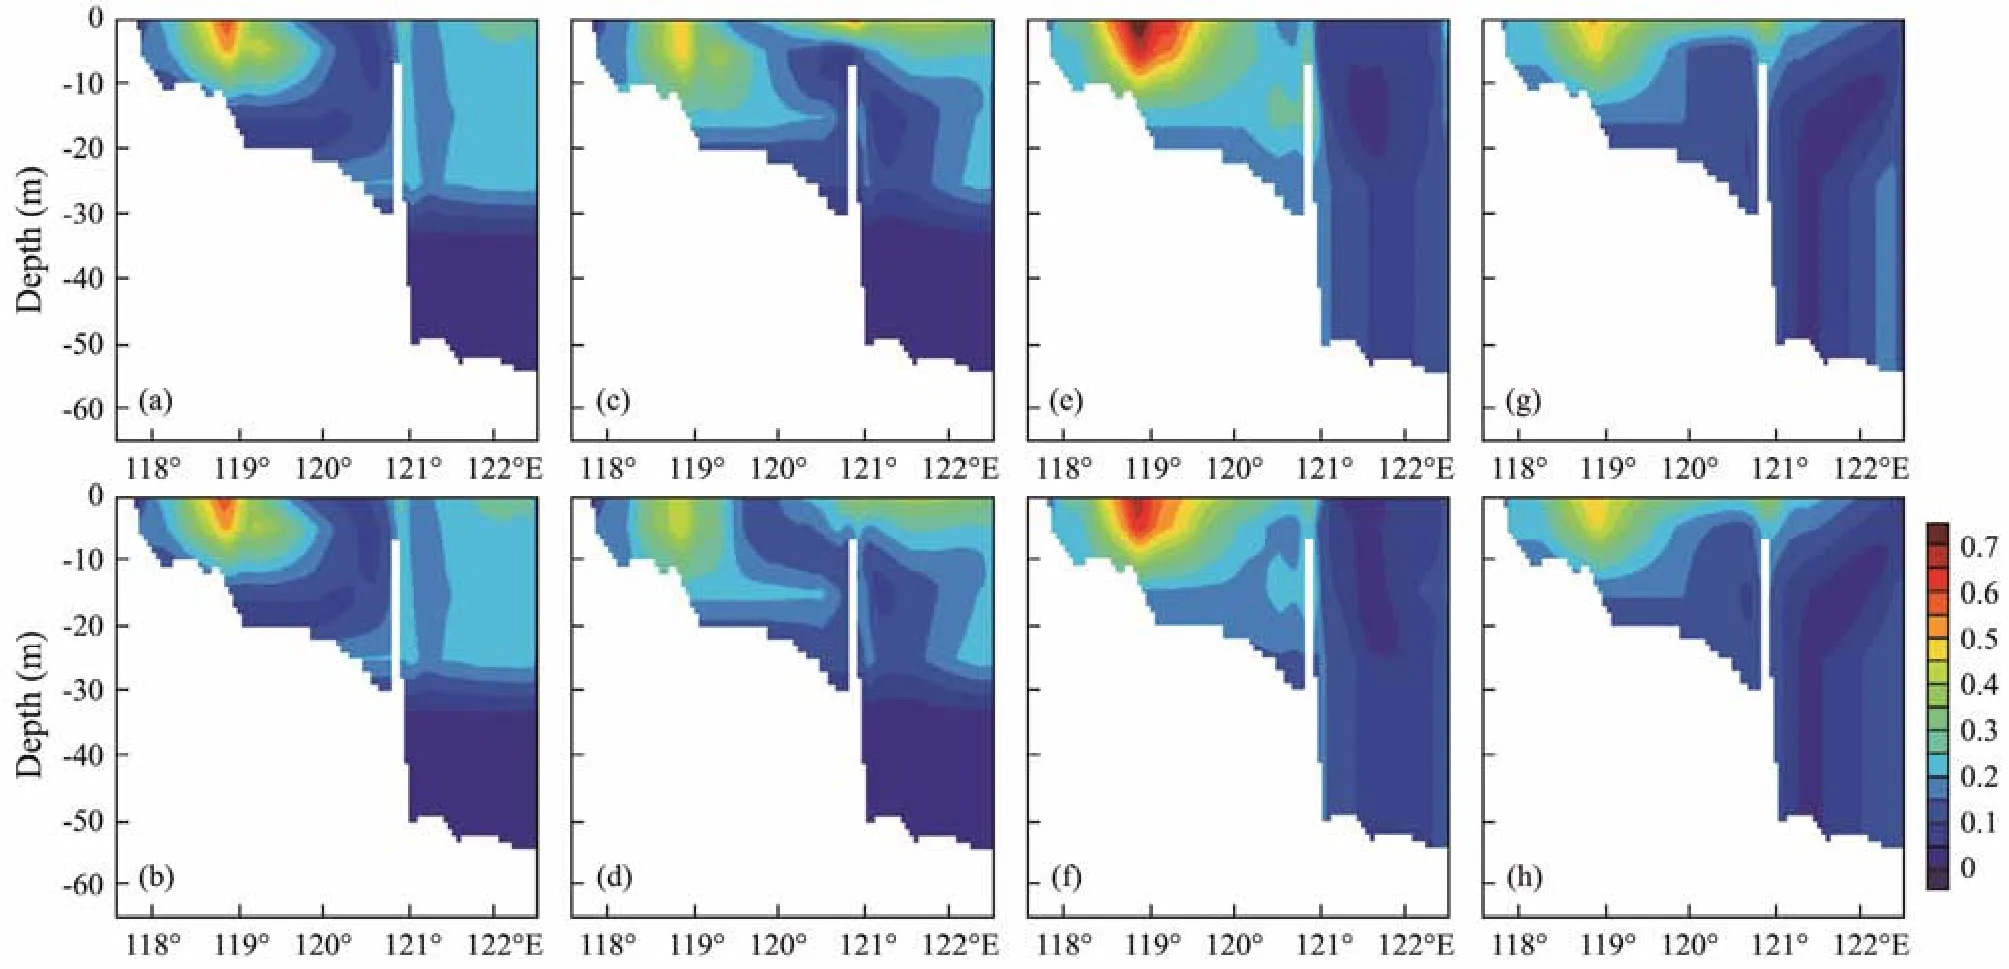
Fig.10 Vertical current speed (m s−1) profiles along 38.333˚N from WAVE-NON (up) and WAVE-ALL (down) at 0000 UTC on (a, b) 7, (c, d) 8, (e, f) 9, and (g, h) 10 August 2005.
On 7 August, currents mainly flow from Liaodong Bay,Bohai Bay, and Bohai Strait toward the Central Sea area and Laizhou Bay (bottom four panels in Fig.8). The current direction is largely controlled by winds and tides. As shown in Fig.8g, SDP slightly influences the surface current speed, with the maximum change being less than ± 0.02 m s−1. A change of about 10% (Fig.8h) occurs in the Central Sea Area due to the very low local current speeds. The majority of the BS region shows a change of approximately ±5%. The vertical current speed profile along the 38.333˚N section (Figs.10a and 10b) reveals that speeds are slightly reduced at almost all depths, to a certain extent rendering the currents more evenly distributed in the vertical.
4.2 During-Typhoon Stage
When Matsa entered the BS on 8 August, the typhooninduced cooling along the typhoon’s traveling path is considerable. The SST in this period rapidly decreases by more than 2℃ (Fig.11a) relative to that on 7 August (Fig.8a).The difference in SST between WAVE-NON and WAVEALL at the during-typhoon stage reaches a maximum of about 1.4℃ (Fig.11c), which is considerably higher than that at the pre-typhoon stage (Fig.8c). The rate of SST change at the during-typhoon stage reaches about 6%, which is approximately O(1) larger than that at the pre-typhoon stage. Reichlet al.(2016b) demonstrated that the total air-sea heat flux can be reduced by at least 10% with the reduction of 0.5℃ in SST. Fig.11c shows that SDP promotes the lifting of deep cold water, resulting in additional cooling at the surface, and Matsa largely strengthens the effect of SDP on ocean thermal processes, leading to an obvious reduction in SST and a noticeably expanded cooling range.
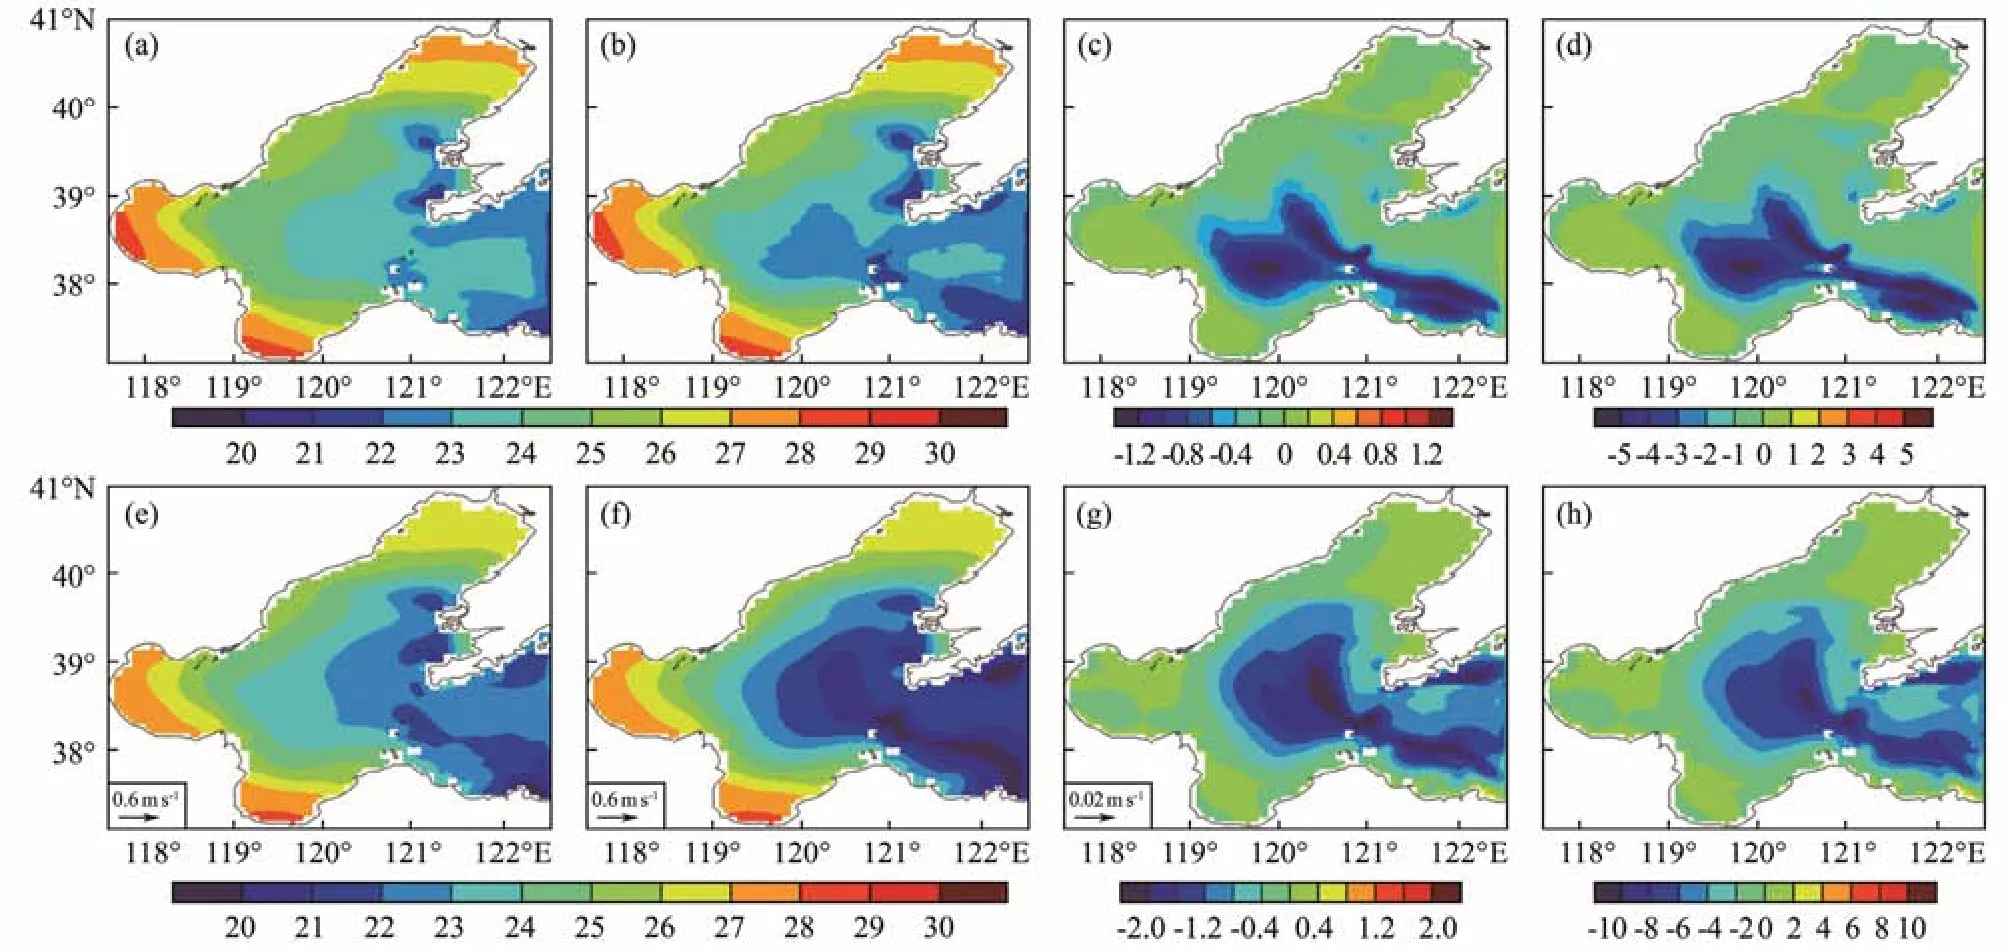
Fig.11 Horizontal distributions of (a) SST (℃) from WAVE-NON, (b) SST (℃) from WAVE-ALL, (c) SST difference (℃)between WAVE-NON and WAVE-ALL, (d) SST difference in percentage (%) between WAVE-NON and WAVE-ALL at 0000 UTC on 8 August 2005 and (e) SST (℃) from WAVE-NON, (f) SST (℃) from WAVE-ALL, (g) SST difference (℃)between WAVE-NON and WAVE-ALL, and (h) SST difference in percentage (%) between WAVE-NON and WAVE-ALL at 0000 UTC on 9 August 2005.
One day after Matsa entered the BS (9 August), the range and intensity of cooling are further increased (Fig. 11e). SST is generally reduced by the action of SDP (Fig.11f). The temperature changes in the Central Sea Area and Bohai Strait are noticeable with the maxima of more than 2℃and the alteration in percentage exceeding 10% (Figs.11g and 11h) because the relatively large water depth in this region facilitates the pulling of deep cold water up to the surface by SDP effects. Although the intensity of winds on 9 August is significantly weakened compared with that on 8 August, the subsequent change in heat flux in the vertical caused by SDP persists, leading to a hysteretic change in SST.
MLD in the deep water region (approximately from 119˚E to 121˚E) is distinctly increased by about 5 m on 8 August (Fig.9b) due to SDP. The small increase in MLD in the region from 121˚E to 122.5˚E is due to the small SST difference in this area (Fig.8c). Given the continuous forcing of typhoon winds, the mixed layer is further deepened with MLD in the deep water region exceeding 3 m, and the maxima reaching about 7.5 m (Fig.9c). By contrast, MLD rapidly decreases in the vicinity of the typhoon center. This finding is consistent with the result reported by Reichlet al.(2016b). In consideration of Stokes drift, MLD is generally deepened by about O(1).
The surface current is strengthened, especially in Bohai Strait and the Central Sea Area, wherein the wind speed of the typhoon is relatively high (top four panels in Fig. 12).The current velocity in Liaodong Bay, which is unaffected by the typhoon, basically equals that on 7 August (Fig.12a).The maximum of the Stokes drift-induced decrease in surface current speed exceeds 0.2 m s−1, which is a massive effect as illustrated in Fig.12d. The coincidence of the area with the largest current speed change (Fig.12c) with the region with the significant SST alteration (Fig. 11c) demonstrates that SDP plays a great role in vertical turbulent mixing and TKE in this area.
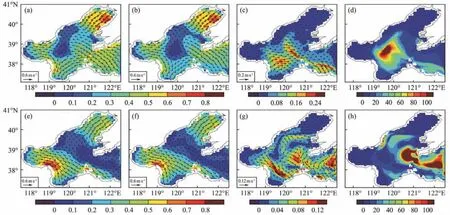
Fig.12 Horizontal distributions of (a) current (m s−1) from WAVE-NON, (b) current (m s−1) from WAVE-ALL, (c) current difference (m s−1) between WAVE-NON and WAVE-ALL, (d) current difference in percentage (%) between WAVE-NON and WAVE-ALL at 0000 UTC on 8 August 2005 and (e) current (m s−1) from WAVE-NON, (f) current (m s−1) from WAVE-ALL, (g) current difference (m s−1) between WAVE-NON and WAVE-ALL, and (h) current difference in percentage(%) between WAVE-NON and WAVE-ALL at 0000 UTC on 9 August 2005.
Comparing the vertical current profile on 7 August (Fig.10a) reveals that Matsa forces the currents to become evenly distributed within the entire shallow depths (Fig.10c) on 8 August. The inclusion of SDP further reduces the current speed at the entire depth in the BS (Fig.10d). However, given the short duration of typhoon action, the TKE transmitted from the atmosphere to the ocean is mainly limited to a depth of a few meters right below the sea surface. Therefore, the vertical current is sheared in the Central Sea Area and Bohai Strait with a large velocity difference between surface and deep waters.
On 9 August, one day after Masta intruded into the BS,the surface current speed is prominently decreased by approximately 0.3 m s−1in the region with high wind speed(Fig.12e). The current is wholly directed to Laizhou Bay before the typhoon and flows basically along the wind direction at the during-typhoon stage, illustrating that under typhoon conditions, the wind is the dominant factor controlling ocean dynamics and is even more important than the tidal current. The influence of SDP on the current is further enhanced, and the current is generally weakened,particularly in northern Laizhou Bay. The maximum alteration in percentage (Fig.12h) exceeds 100% owing to the low current speed in the Central Sea Area. The Stokesinduced differences in current direction between 8 and 9 August (shown in Figs.12c and 12g) are both generally opposite the wind direction, suggesting that to a certain degree, Stokes drift depresses the effect of strong winds on currents by strengthening vertical turbulent mixing.
The current speeds in the upper and lower layers are similar, and the energy transported from the atmosphere to the ocean can be fully injected into the whole depth (Fig.10e). As a result of typhoon wind, currents generally flow in the same direction, and the current speed is increased obviously in Bohai Bay and the Central Sea Area (Figs.10c and 10e). By contrast, the current speed is low in the Bohai Strait owing to its closeness to the typhoon center and the opposite direction between the wind and current.In addition to SDP, the vertical distribution of current speed(Figs.10e and 10f) is noticeably changed. Specifically, its magnitude is decreased in general.
4.3 After-Typhoon Stage
Matsa weakened into an extratropical cyclone after 9 August. At this stage, SST rises gradually from 10 August(Fig.13a) and after but does not fully recover to pre- typhoon levels relative to that on 7 August (Fig.8a). SDP mainly reduces SST in Bohai Strait and the Central Sea Area, and the extent and range of the reductions (Figs.13c and 13d) are similar to those on 9 August (Figs.11g and 11h). The additional cooling at the after-typhoon stage indicates that SDP not only affects SST on the synoptic time scale but could also impact the total heat budget for an extended time interval. In the absence of strong typhoon winds, MLD decreases from 10 August. MLD simulated from WAVE-All is deeper than that from WAVE-NON(Fig.9d), with an SDP-caused increase of approximately about 3.4 m. The order of magnitude of MLD at this stage roughly coincides with that on 8 August, but MLD is generally deeper than that on 8 August, proving a hysteretic response between SDP and typhoon action.

Fig.13 Horizontal distributions of (a) SST (℃) from WAVE-NON, (b) SST (℃) from WAVE-ALL, (c) SST difference (℃)between WAVE-NON and WAVE-ALL, (d) SST difference in percentage (%) between WAVE-NON and WAVE-ALL, (e)current (m s−1) from WAVE-NON, (f) current (m s−1) from WAVE-ALL, (g) current difference (m s−1) between WAVE-NON and WAVE-ALL, and (h) current difference in percentage (%) between WAVE-NON and WAVE-ALL at 0000 UTC on 10 August 2005.
The circulation structure at this stage significantly differs from that at the pre-typhoon stage (7 August). As shown in Fig.13e, the main direction of currents on 10 August is eastward. Specifically, the currents flow from Liaodong Bay and Bohai Bay to Laizhou Bay and Bohai Strait.The currents have relatively low speeds in Bohai Strait and Liaodong Bay. SDP mainly decreases the surface current speed in the northern Laizhou Bay and the southern Bohai Strait (Fig.13g) by 0.04 – 0.08 m s−1. This reduction demonstrates that the effect of Stokes drift persists even after the typhoon has moved out of the study area. The difference rate (Fig.13h) is generally reduced because of the weakened winds, indicating that the impact of Stokes drift on the surface current is largely related to wind speed.As the wind varies, the current is changed from the surface deep down, forming the temporary stratification of the current speed (Fig.10g). SDP promotes an integral change at all depths that increases the uniformity of the vertical distribution of currents (Fig.10h) and therefore weakens t he stratification of flows.
5 Conclusions
The specific role of SDP in turbulent mixing and dynamics in the BS under typhoon conditions is rarely known because no study has focused on this topic, given the infrequent visits of tropical storms to this region. Here, we use a coupled POMgcs-SWAN modeling system to investigate the influences of Stokes drift on mixing and dynamics in the BS under typhoon conditions for the first time.A case study on Super Typhoon Matsa (2005) is comprehensively performed and presented.
At the pre-typhoon stage, the effects of SDP on SST,MLD, and currents are relatively weak, and the structures of temperature and currents are generally similar to those under the normal weather condition that was discussed in our previous study (Caoet al., 2019). As Masta acted on the study area at the during-typhoon stage, turbulent mixing is greatly promoted by approximately one order of magnitude. This effect is suggestive of a large amount of downward TKE injection into the deep due to strong winds.The difference betweenKMandKMSexceeds 0.008 m2s−1,which is approximately seven times larger than the difference between these parameters at the pre-typhoon stage,proving that Stokes drift plays a significant role in turbulent mixing under typhoon conditions. As a result, SSTs and current speed are greatly reduced, whereas MLD is increased. However, the vertical temperature structure is not substantially changed, and the TKE that is transmitted from the atmosphere to the ocean is mainly confined to the surface layer. Flows are vertically stratified, and a noticeable speed difference exists between the surface and deep layers. One day after the action of strong typhoon winds, Stokes drift brings deep cold water up to the surface. This process strengthens surface cooling and weakens temperature stratification. Stokes drift causes notable temperature differences in the Central Sea Area and Bohai Strait with a maximum of more than 2℃ (> 10%) because the relatively large water depth in this region facilitates the pulling of deep cold water to the surface by SDP effects. The numerical results show that under the condition of high wind speeds, the Stokes drift-induced reduction in SST can be altered by O(1). The vertical temperature structure is also changed greatly. This change is accompanied by a general increase in MLD save for a rapid decrease near the center of the typhoon. The vertical distribution of temperature tends to be highly uniform under modulation by Stokes drift. The current speed is further reduced by over 0.2 m s−1at the during-typhoon stage and is approximately ten times larger than the maximum current speed change of about 0.02 m s−1caused by Stokes drift under the normal weather condition. The maximum current change exceeds 100%, reflecting the great influence of Stokes drift on the surface current at the duringtyphoon stage. After the addition of SDP, the change in current direction is generally opposite the wind direction,suggesting that Stokes drift depresses the action of high wind speed on currents by intensifying vertical mixing.
The mixing at the after-typhoon stage remains larger than that at the pre-typhoon stage, although the strong wind has almost disappeared. The residual effect of SDP continuously maintains SST at low levels, and the alterations in SST are similar to those at the during-typhoon stage,indicating that SDP not only affects SST on a synoptic time scale but also affects the total heat budget on long time scales. The Stokes-induced change in current speed decreases to 0.04 – 0.08 m s−1, and the alteration in percentage is also generally reduced because of the weakened winds. These changes indicate that the effect of Stokes drift on surface currents is largely dependent on wind speed.However, the change in current speed at this stage is still greater than that at the pre-typhoon stage, and the change in current direction is opposite the wind direction. SDP continuously promotes coordinated changes at all depths,thus increasing the uniformity of the currents in the vertical.
The combined effects of SDP (CSF, LC, and CLVF) on turbulent mixing and ocean dynamics under typhoon conditions are comprehensively analyzed and discussed. SDP is of great importance to ocean dynamical processes, especially under typhoon weather conditions. The effects of these wave processes on ocean dynamics are essential for improving ocean prediction and disaster forecasting. SDP not only affects physical processes but also alters the distributions of organics and nutrients in the ocean. Therefore,the role of SDP in ocean bioecological processes should be an interesting topic for further research.
Acknowledgements
This work was supported by the National Natural Science Foundation of China (No. 42176020), and the National Key Research and Development Program (No. 2022 YFC3105002).
杂志排行

Journal of Ocean University of China的其它文章
- Using Natural Radionuclides to Trace Sources of Suspended Particles in the Lower Reaches of the Yellow River
- Eutrophication of Jiangsu Coastal Water and Its Role in the Formation of Green Tide
- Evaluation of the Shallow Gas Hydrate Production Based on the Radial Drilling-Heat Injection-Back Fill Method
- Microstructure Characterization of Bubbles in Gassy Soil Based on the Fractal Theory
- Morphological and Sulfur-Isotopic Characteristics of Pyrites in the Deep Sediments from Xisha Trough, South China Sea
- Deformation Characteristics of Hydrate-Bearing Sediments