Data Quality Control Method of a New Drifting Observation Technology Named Drifting Air-Sea Interface Buoy
2024-03-12LIShuoWANGBinDENGZenganWUBaoqinZHUXiandeandCHENZhaohui
LI Shuo , WANG Bin , , DENG Zeng’an , WU Baoqin, ZHU Xiande,and CHEN Zhaohui
1) National Ocean Technology Center, Tianjin 300112, China
2) School of Marine Science and Technology, Tianjin University, Tianjin 300072, China
3) Key Laboratory of Ocean Observation Technology, Ministry of Natural Resources, Tianjin 300112, China
4) People’s Liberation Army 92859, Tianjin 300061, China
5) Physical Oceanography Laboratory, Ocean University of China, Qingdao 266100, China
Abstract An integral quality control (QC) procedure that integrates various QC methods and considers the design indexes and operational status of the instruments for the observations of drifting air-sea interface buoy was developed in the order of basic inspection followed by targeted QC. The innovative method of combining a moving Hampel filter and local anomaly detection complies with statistical laws and physical processes, which guarantees the QC performance of meteorological variables. Two sets of observation data were used to verify the applicability and effectiveness of the QC procedure, and the effect was evaluated using the observations of the Kuroshio Extension Observatory buoy as the reference. The results showed that the outliers in the time series can be correctly identified and processed, and the quality of data improved significantly. The linear correlation between the quality- controlled observations and the reference increased, and the difference decreased. The correlation coefficient of wind speed before and after QC increased from 0.77 to 0.82, and the maximum absolute error decreased by approximately 2.8 m s−1. In addition, air pressure and relative humidity were optimized by 10−3 – 10−2 orders of magnitude. For the sea surface temperature, the weight of coefficients of the continuity test algorithm was optimized based on the sea area of data acquisition, which effectively expanded the applicability of the algorithm.
Key words drifting air-sea interface buoy; quality control; oceanic variables; meteorological variables; continuity test
1 Introduction
The drifting air-sea interface buoy (DrIB), a small-sized,lightweight, and cost-effective mini-buoy, is mainly used to measure basic variables at the air-sea interface by expendable and drifting methods in real time. The large-scale application of the DrIB can realize the high-frequency acquisition of key meteorological (wind speed, wind direction, and air pressure at approximately 3 m and air temperature and relative humidity at approximately 2.8 m above the sea surface) and oceanic (sea surface temperature (SST)and wave parameters) variables in the global ocean (Centurioniet al., 2019), which is beneficial to understanding ocean dynamics, air-sea interaction, and global climate change and forecasting of modal accuracy.
The external structure of the DrIB consists of two parts:the above-water and underwater units (Fig.1). The above water unit includes a hemispherical float and a mast, and the underwater unit consists of two mutually perpendicular water sails and an underwater counterweight. The DrIB is composed of a meteorological observation module, a hydrographic observation module, a measurement and control system, a communication module, and a power supply module. After the DrIB is deployed, it carries out observations of key meteorological and hydrological variables at the air-sea interface by drifting with the currents.After preliminary online calibration, the observations are transmitted to the shore/ship-based data management system, which can receive, process, store, and distribute observations in real time through the satellite communication system. The DrIB has a sampling frequency of 1 Hz,and the output data are the average of 120 samples with optional sampling intervals of 10 min / 30 min / 1 h. Table 1 shows the observational performance of the DrIB and the instruments installed on it.
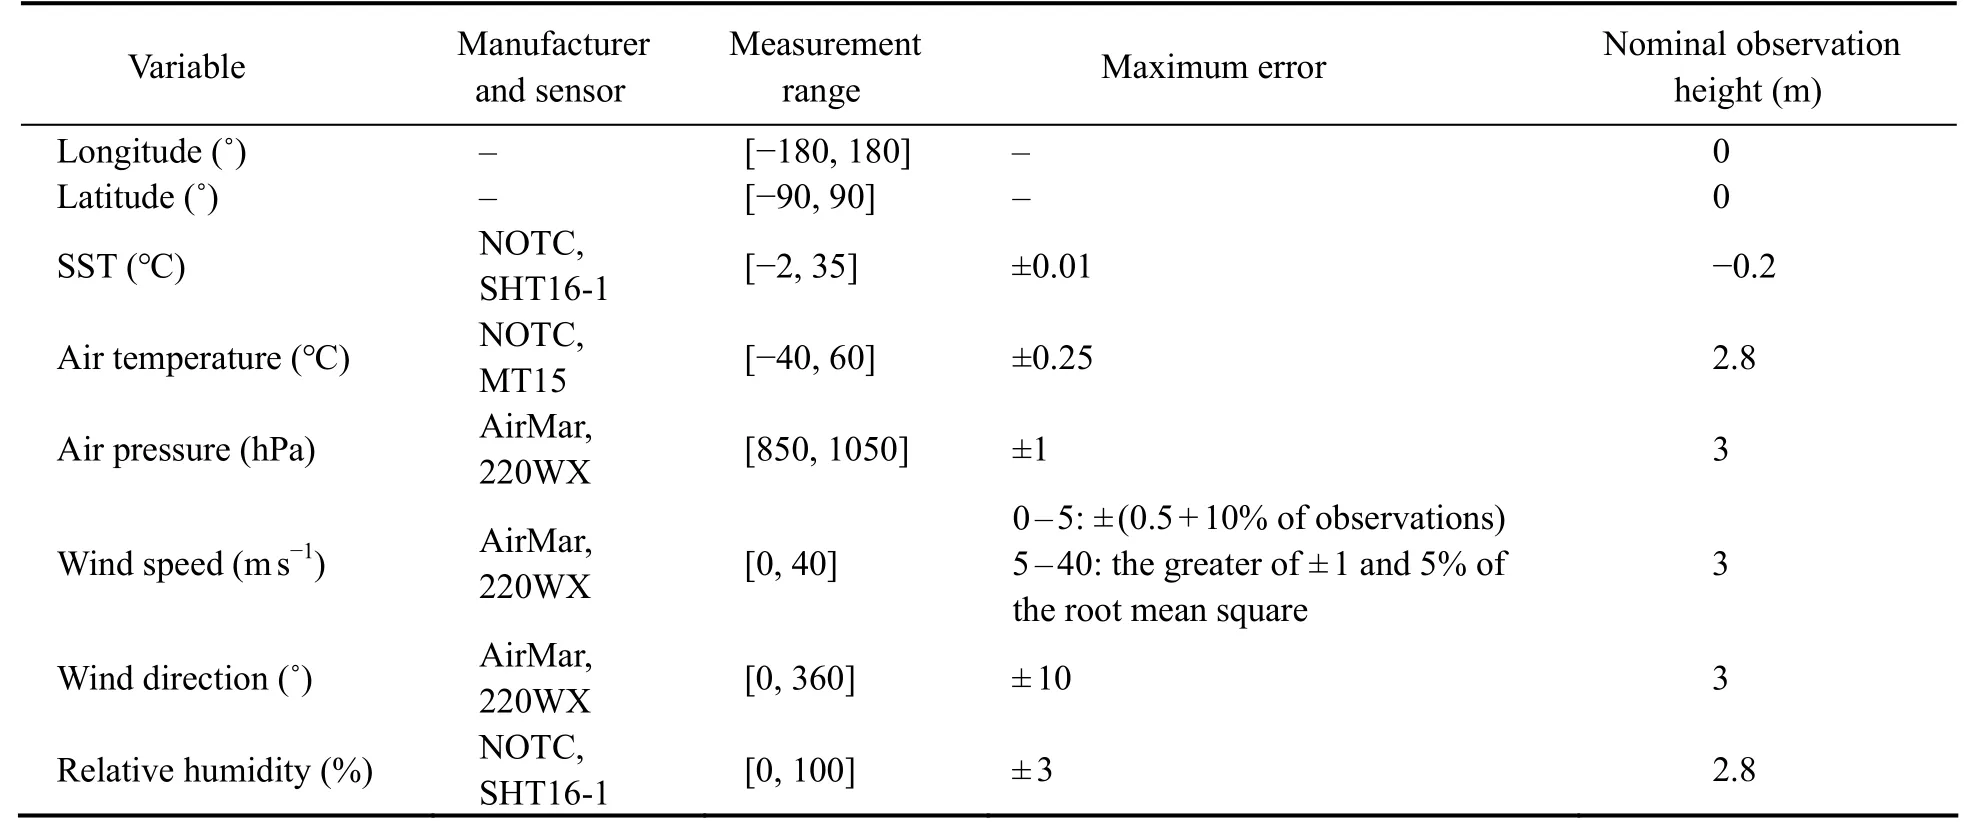
Table 1 Observation indexes and associated instruments of the DrIB
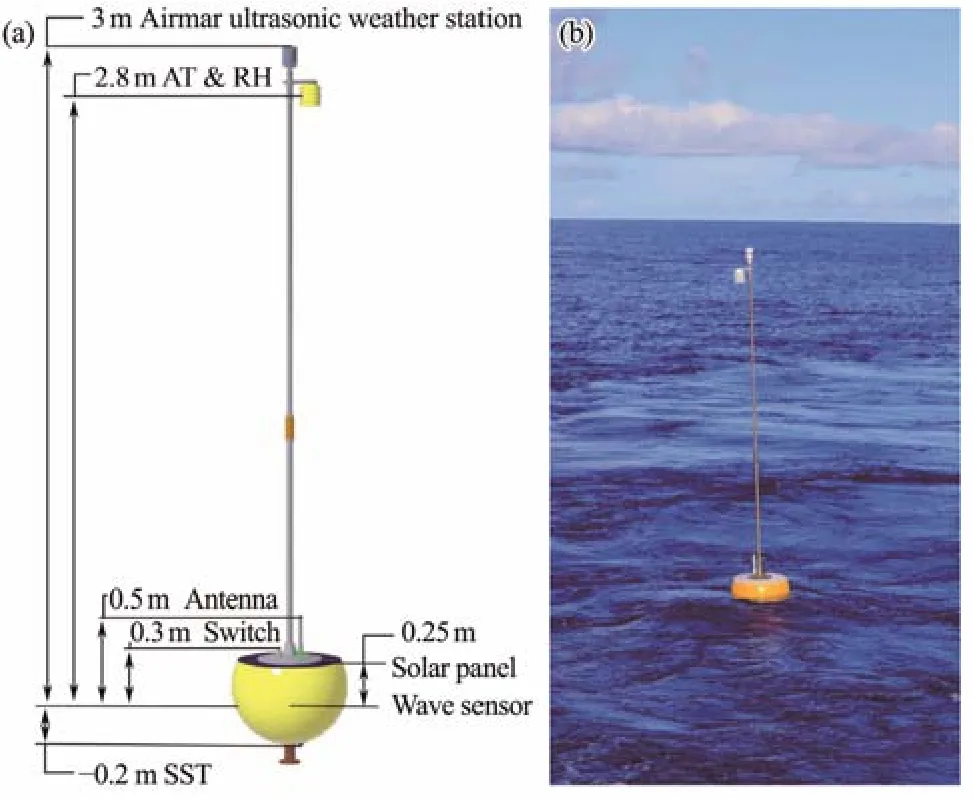
Fig.1 (a) Dimensional view of the drifting air-sea interface buoy and (b) the site of drifting air-sea interface buoy observation in the Western Pacific. The abbreviations AT and RH in (a) represent air temperature and relative humidity,respectively.
Marine science is an observation-based discipline (Wuet al., 2020). Observations are the critical foundation for scientific research, which is directly affected by data quality. However, operation errors, marine environment, unstable communication transmission,etc., can interfere with the observation results and cause data anomalies, and most of the observations cannot be applied directly. Therefore,rigorous and effective quality control (QC) of the received data and removal of the error and abnormal values hidden in the time series are necessary to improve the accuracy and reliability of observations.
For the QC research of marine environmental observations, many institutions and experts have shared their valuable experiences. Foreign research has been carried out earlier, and after continuous improvement and development,QC technology is more mature nowadays. For example,the drifting buoy of the Surface Velocity Program (SVP)can transmit back its position and SST data, and the SVP data collection center conducts QC based on whether the value violates the set continuity criterion (Hansen and Herman, 1989; Hansen and Poulain, 1996). The National Data Buoy Center of America manages 50 ocean stations and more than 100 moored buoys. It has developed an automated QC program to perform transmission error checks,range inspections, time continuity checks, correlation checks,etc.(Jarraud, 2008; National Data Buoy Center, 2009). The Kuroshio Extension Observatory (KEO) buoy was first deployed in 2004. Currently, the time series and statistical properties of hydrometeorological variables, including wind,air temperature, air pressure, relative humidity, precipitation, long- and short-wave radiation, seawater temperature,salinity,etc., can be independently checked and identified for data quality by a complete QC program (Andersonet al., 2021). In addition, the glider toolbox based on Matlab is specially used to correct the thermal lag bias of the salinity observed by underwater gliders (Troupinet al.,2015).
Comparatively, China’s research is relatively late. Verified by the observations of weather stations and ocean observatories, real-time meteorological and hydrological data can be quality-controlled by determining the range threshold and physical relationships between elements (Li and Li, 1997). The QC software developed by the National Marine Data and Information Service realizes the automatic QC of the data collected by ocean observatories (Yanget al.,2017); Wuet al.(2019)used a laboratory high-precision salinometer to compare and evaluate the observations of the ship-borne Conductivity, Temperature, Depth (CTD)instrument for complete QC. Liuet al.(2020)proposed a real-time QC procedure including thermal lag correction and 12 tests based on the temperature-salt profile obtained by the domestic Sea Wing underwater glider. Renet al.(2021) innovatively integrated the spike inspection and PauTa criterion, effectively eliminating the abnormal values in sea temperature and salinity observations.
In summary, extensive research has been carried out on QC technologies of weather and ocean observatories, fixed buoy observations, and data from underwater sensors on mobile apparatus. However, studies on simultaneous observations of key meteorological and hydrological variables at the air-sea interface through drifting ways are relatively scarce. Moreover, with the rapid development of the DrIB observation network, observations have accumulated,and QC research has become urgent. In addition, drifting or mobile apparatuses, such as wave gliders and unmanned ships, are currently emerging, representing a significant trend in the development of marine observation technologies (Grareet al., 2021). However, no systematic data QC method has been formed yet, and the reliability of observations is uncertain. The research on the QC of DrIB observations and related theories and methods also applies to other mobile observation equipment, which can effectively compensate for shortcomings and solve the problem of poor quality of original data.
With a focus on the air-sea interface scenarios, an integral QC procedure for DrIB observations was established in conjunction with the instrument’s design indexes and operational records. Basic inspection was performed first,and the observed variables were categorized for targeted QC. Two sets of observations from the Northwest Pacific were used as examples to analyze the effect of QC and verify the applicability, effectiveness, and advancement of QC methods and the related procedure.
2 QC Procedure
QC is mainly used for two types of errors in long-term continuous hydrometeorological observations. The gross error exceeds the observation capability of the equipment or normal variation range of the observed variables and is intuitive and easy to identify and eliminate; meanwhile,the outlier is within a reasonable range but deviates from the overall or local trend and thus needs to be screened by a variety of means (Tanet al., 2022).
This paper applied various QC methods, such as land inspection, repetition check, incremental inspection, range inspection, and continuity inspection. Applicable continuity tests were used to carry out targeted QC on location data and meteorological and oceanic variables. The abnormal data were then eliminated or linearly interpolated based on the nearest samples. Each variable was considered as an independent one-dimensional time series. Fig.2 shows the specific steps of the QC procedure.
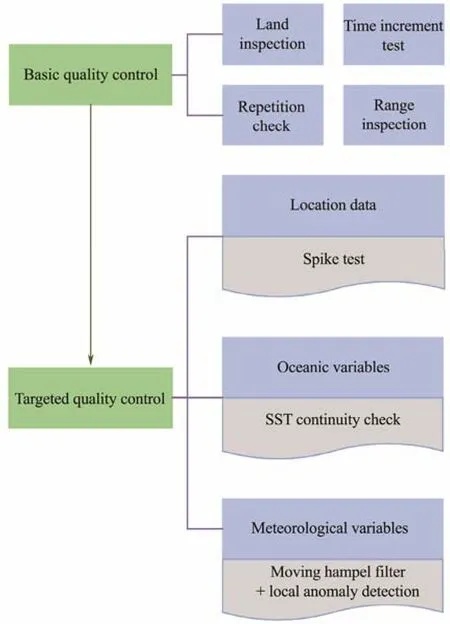
Fig.2 Schematic chart of the QC procedure.
2.1 Basic QC
Previously, QC of observations tended to detect anomalies only from the data themselves, which might have affected efficiency. For DrIB, the observed variables are relatively abundant, and the operation of the buoy and changes in the air-sea environment are recorded well. QC should consider the instrument’s design indexes and operating attitude and maximize the advantages of operation records to identify abnormal data quickly and accurately. The basic QC mainly includes the following steps.
1) Land inspection. Unlike mooring buoy, the DrIB may start operating before entering the sea due to land or shipbased functional test and other reasons, sending land information and directly causing abnormal SST observations.Such errors usually only exist at the initial stage of a continuous-time series. Therefore, land inspection needs to be performed first to eliminate invalid data when the DrIB is not in the sea and ensure that the observations are of the real ocean environment. By assessing whether the swing angle conforms to its in-water motion and whether a fault difference exists between the initial and stable periods of SST to make an accurate judgment of the working environment, the observations on land are removed, and a separate file of land observations is generated to facilitate subsequent inspection and verification.
2) Repetition check. In cases of unstable satellite transmission and failed data storage modules, more than one piece of data may be stored in the land-based data receiving station simultaneously, which results in duplicate errors. The repetition check is applied to eliminate duplications and ensure a ‘one-to-one’ relationship between time and observation. A file of duplications is generated at the same time.
3) Time increment test. Observations should be arranged in chronological order. ‘Time reversal’ is prevented by performing an incremental time test on the time records to ensure correct timing. The data detected with chaotic time are detected. If necessary, the order is adjusted, and deletion and adjustment actions are recorded in real time in the timing-related log.
4) Range inspection. Range inspection is a practical judgment of whether values are reasonable based on the basic cognition of geography, general laws of hydrometeorological variables, and the observation capability of the equipment itself. For example, the SST generally varies within −4℃ to 44℃ (Fenget al., 1999), and the maximum relative humidity does not exceed 100%. The design observation indexes of DrIB are shown in Table 1, and the data beyond the range are considered as set W.
2.2 Targeted QC
After basic QC, evident errors in the time series are eliminated. The working characteristic of ‘drifting with the tide’ determines the continuity and regularity of the observed variables. Next, the observations are divided into three categories: location data, oceanic variables, and meteorological variables. Then, the corresponding continuity criterion is set to identify the values that violate the continuing trend of the series for further targeted QC.
1) Location data. For the sudden abnormal change (spike)in the drifting trajectory of DrIB, the spike test is used to determine whether the latitude and longitude at the spike are correct (Gouretski, 2018), which is determined by the following:
whereln−1,ln, andln+1represent three consecutive longitude or latitude values, andαis a critical parameter, which is considered as 0.1 when the data sampling interval is 1 h.If the formula holds, thenlnis abnormal, and the abnormal values screened are set to G.
2) Oceanic variables. The SVP data collection center integrates the spike and continuity tests and sets a weighted averagemiof iterative changes as the SST ‘spike’ detector to check the continuity of the SST time series (Hansen and Poulain, 1996). The determination ofmiis based on the recent changes in SST experienced by the buoy, and the nearest samples of the detected data are given the highest weight. The test is as follows: the first valid SST ism1, and the observations are tested sequentially by the following:
The SST is anomalous if the formula cannot be formed andmiis not updated. The SVP data collection letsCbe 1/4 and ∆ be 0.5 K and applies the method to the detection of SST data in tropical Pacific Ocean.
Compared with the relatively balanced and stable environment in tropical oceans, mid-latitude oceans exhibit more complex dynamics and a stronger air-sea nonlinear instability interaction. Thus, the SST observations are more dependent on the actual change processes of seawater at the time of acquisition. Moreover, for the improved applicability of the method, the contribution weight ofin situobservations should be appropriately increased in the calculation of the SST ‘spike’ detectormifor DrIB in mid-latitude oceans (Yuet al., 2010). In other words, the value of parameterCshould be increased. After experimental verification, the detection performance is the best when it is raised to 1/3. Correspondingly, ∆ is set to 0.5℃.The QC results may be incorrect when the DrIB crosses a strong front or when the sampling interval is large. Thus,the data are tested in both forward and reverse directions.The values identified as anomalous in both directions are taken as set S.
3) Meteorological variables. Compared with the ocean,the atmosphere is more active and fast-changing, and the changing patterns of key meteorological variables, such as temperature, air pressure, wind speed, and relative humidity, are more significant. When the QC method mentioned above is used for oceanic variables to test meteorological variables, a growing gap exists between the observations and the detectormi, which results in most normal data being judged as abnormal and prevented from being directly applied.
According to statistical theory, meteorological variables observed continuously at fixed positions tend to obey a probability distribution; therefore, statistical tests, such as the PauTa criterion (3δ criterion), which considers data with a residual error of more than three times the standard deviation from the arithmetic mean as outliers, can be used to check data (Luet al., 2019). However, if the arithmetic mean and standard deviation are used as judgment criteria,the extreme outliers are prone to biased results. Hampel filter is a filtering algorithm for identifying anomalies in a time series, and its operating principle is similar to that of the PauTa criterion, except that the criteria are the median and converted median absolute deviation, which can effectively avoid the interference of extreme values (Gholamiet al., 2022). In addition, as the spatial location of DrIB is dynamically changing, and the atmospheric environment varies significantly in different seas, the study of the statistical characteristics of its long-term time series has little significance. Based on the continuity and regularity of temporal and spatial changes of drifting observation, a moving Hampel filter has been proposed to assess the degree of data departure from daily variability using days as the time window unit to find outliers in the time series of meteorological variables observed by DrIB (Liu, 2017; Renet al., 2021). Suppose a time series of observations,q1,q2, ···,qn, with a data acquisition interval of 1 h. The time window for sampling is one day; that is,q1,q2, ···,q25are taken as a group, and the median isqme. Then, the following are obtained:
wheredmstands for the local conversion ofMAD, and theqithat is more than three times ofdmfromqmeis abnormal.After the detection of the first group, the time window moves one piece of information in sequence and conducts detection again until the last group of the time series has been identified. The detected anomalies are set as Q1.
The data in set Q1 are anomalous in terms of mathematical statistics. If the atmospheric environment is relatively stable, the fluctuation of variables is balanced, the local conversionMADis small, and correct data can be easily misclassified as abnormal. Local anomaly detection is further applied to avoid the risk of misjudgment by the moving Hampel filter. Theqsof any observations in the set Q1 is correct if the difference between it and the observation of any adjacent moment does not exceed the set maximum change threshold. The data misjudged as abnormal are considered set Q2. The change threshold should be larger than the design observation error of the DrIB to prevent the instrument’s error from interfering with the judgment.
Given the rapid and instantaneous change, poor data continuity, and complex influencing factors of wind direction,only basic QC is performed. For the abnormal location data set Wg + G, abnormal oceanic observations set Ws + S,and abnormal meteorological observations (except wind direction) set Wq + Q1 − Q2, for the retention of data continuity based on not breaking the statistical characteristics and changing trends of the time series, the results of linear interpolation of the nearest observations are used to replace one or two separate abnormal data. Wind direction anomalies and other variables with more than two consecutive anomalies are deleted.
In summary, the QC procedure of DrIB observations developed in this study focuses on data classification for QC based on the full use of measurements. For oceanic variables, by increasing the weight ofin situobservations in the SST continuity test algorithm, the applicability of the algorithm is extended from tropical waters to higher latitudes, and the accuracy of outlier detection is improved.For meteorological variables, a QC method combining the moving Hampel filter and local anomaly detection is proposed. The median andMADare chosen as determination parameters to avoid interference by extreme values when applying the PauTa criterion. Moving detection performed in one-day steps is more consistent with the working characteristics of DrIB rather than using long-term statistical characteristics of fixed observations. The local anomaly detection method considers the actual physical process of meteorological variables, which effectively reduces the probability of misjudgment in identifying anomalies based on mathematical features only.
3 Application and Validation of QC Procedure
In this study, two sets of DrIB observations, namely,5840 and 8990, were used as examples to systematically analyze the QC performance and verify the methods’ effectiveness and advancement. The results showed that the QC scheme is applied well in the processing of DrIB observations.
3.1 Data Description
DrIB 5840 continued its drift and observation in the Kuroshio Extension from August 30, 2018, to January 1,2019. The sampling interval was 1 h. A total of 2909 records, including longitude, latitude, SST, air temperature,air pressure, wind speed, wind direction, relative humidity,and buoy operation records, were obtained. DrIB 8990 continued to drift and observe in eastern Japan from November 4, 2019, to November 6, 2019. The sampling interval was 10 min, and 251 pieces of data were collected with the same categories as DrIB 5840.
3.2 Analysis of QC Results
Table 2 shows the QC results of DrIB 5840 observations. The roll and pitch angles of the first six observation records were all zero, which was inconsistent with the swaying attitude of the buoy in seas. Fig.3(b) shows a steep descent at the beginning of the SST curve, and the significant difference in SST was more than 3℃. Therefore,these data were judged to be sent by the DrIB on land by mistake. Usually, DrIB functions well, and the observations are reliable and do not exceed the normal range. Thus, the range check focuses on the missing data stored in −999.999 format. Figs.3 and 4(a) show the time series of the ob-served variables and drifting trajectory plotted using the original observations, respectively. The abrupt straight lines on the figures are precisely due to the missing data,that is, the anomalies detected by the range inspection, in which all observed variables were missed twice on December 18, 2018.

Table 2 QC results of observations from DrIB 5840
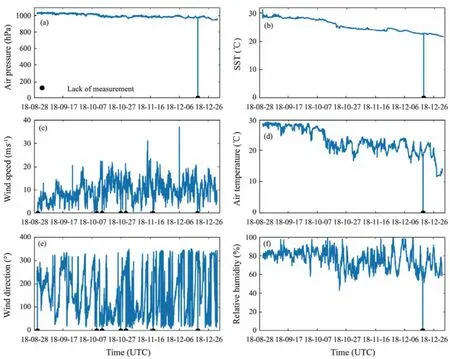
Fig.3 Time series of DrIB 5840 observations (before QC).
After the basic check, the DrIB 5840 observations were classified for targeted QC. After the spike test, two abnormal data were screened out from the longitude and latitude time series, and the two spikes near 32˚N, 144˚E on the drifting trajectory were removed. The drifting trajectory after QC (Fig.4(b)) was clear compared with the previous observation, and the curve was naturally connected without abnormal spikes and easily visualized the dynamic changes of the observed sea areas. In addition, the QC performance was evident and intuitive. The SST observations were of high quality with a few anomalies, and seven records, which included both true anomalies and misjudgment results, were detected by the method proposed by the SVP data collection center (Fig.5(a)). According to the local diagram of SST QC results (Fig.5(b)), three anomalies from 2:00 to 4:00 on September 7, 2018 were consistent with the overall and local developing trends of the time series, which were misjudgment results. After adjusting the coefficients weights in the algorithm, three anomalies were detected and manually checked to confirm that the results were correct. The findings proved that the improved method effectively improved the accuracy of discrimination while expanding the applicability. For meteorological variables, with air pressure used as an example,the air pressure QC results were obtained by checking the SST (Fig.6(a)). The outliers were numerous and primarily distributed in patches, and all the observations from November 22 to 24, 2018 were abnormal, which was inconsistent with the facts. A total of 73 anomalies violating the daily variability of air pressure were detected using the moving Hampel filter, and the percentage of anomalies was 2.5%. By comparison, seven anomalies exceeding 10 hPa of air pressure at adjacent moments were detected from these data after the addition of local anomaly detection (Fig.6(b)). The percentage of anomalies was reduced to 0.24%, which indicates that as the physical processes significantly reduced the probability of misjudgment, the effect of QC was more guaranteed.
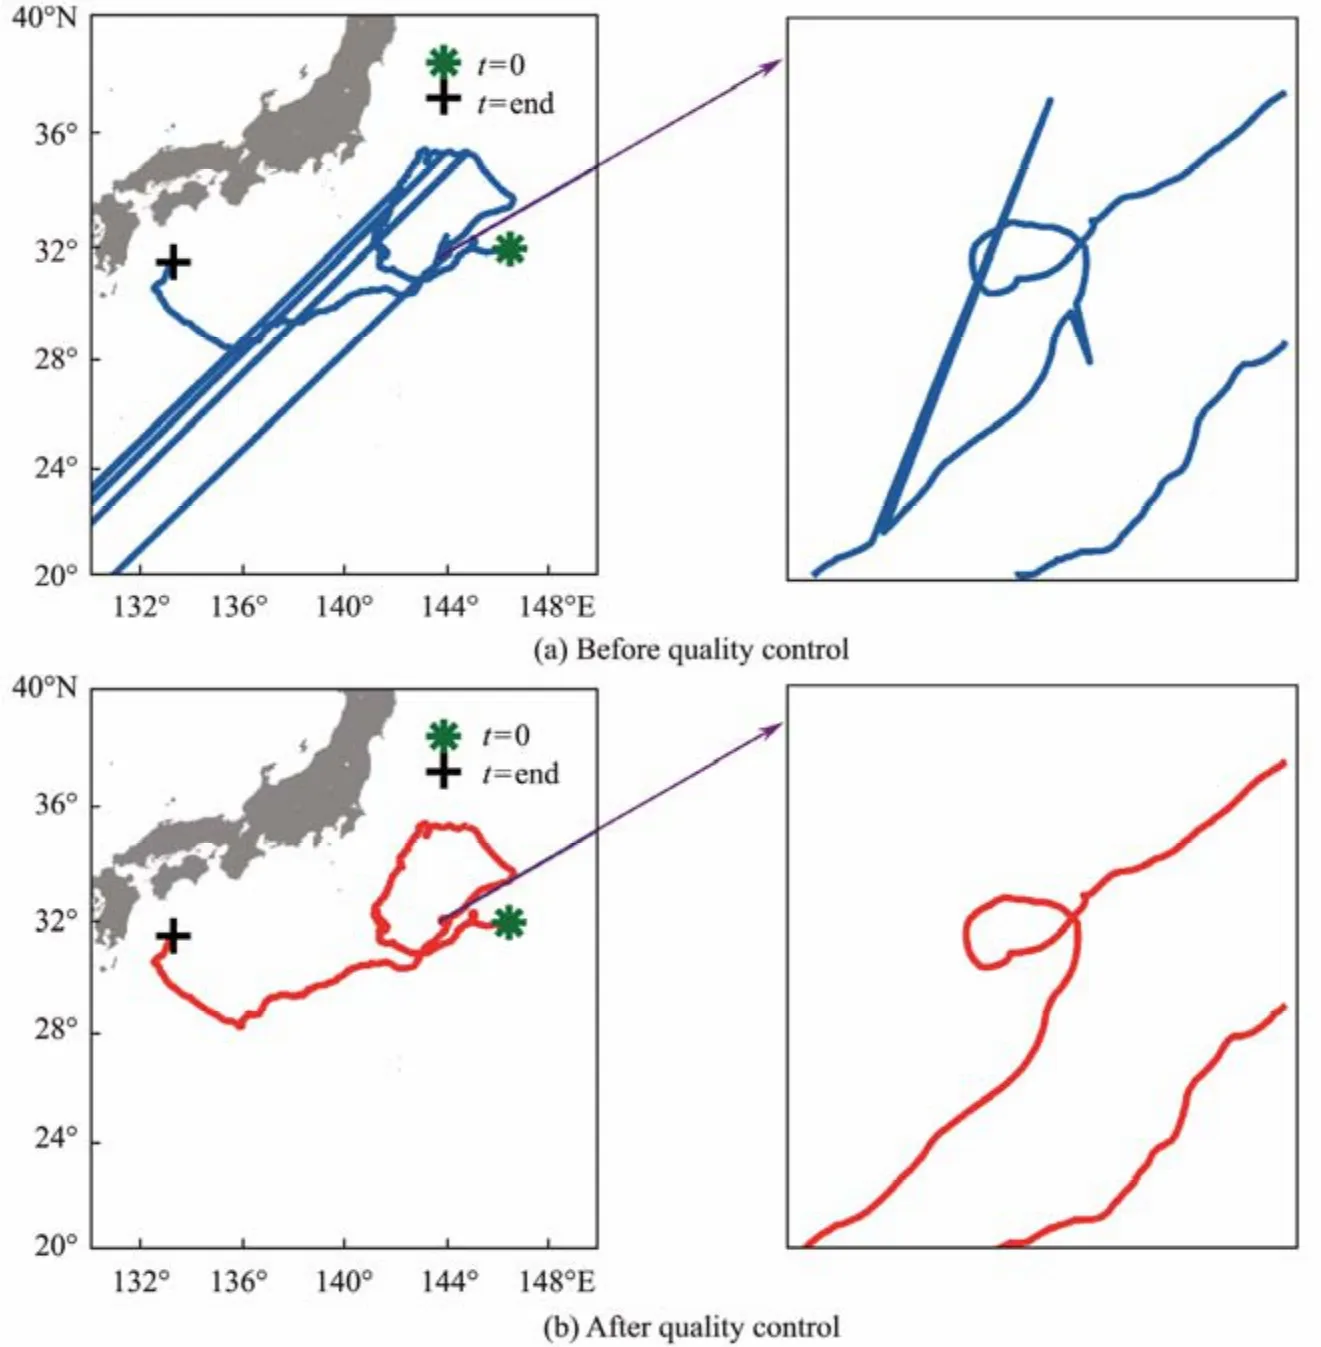
Fig.4 Drifting trajectory of DrIB 5840.
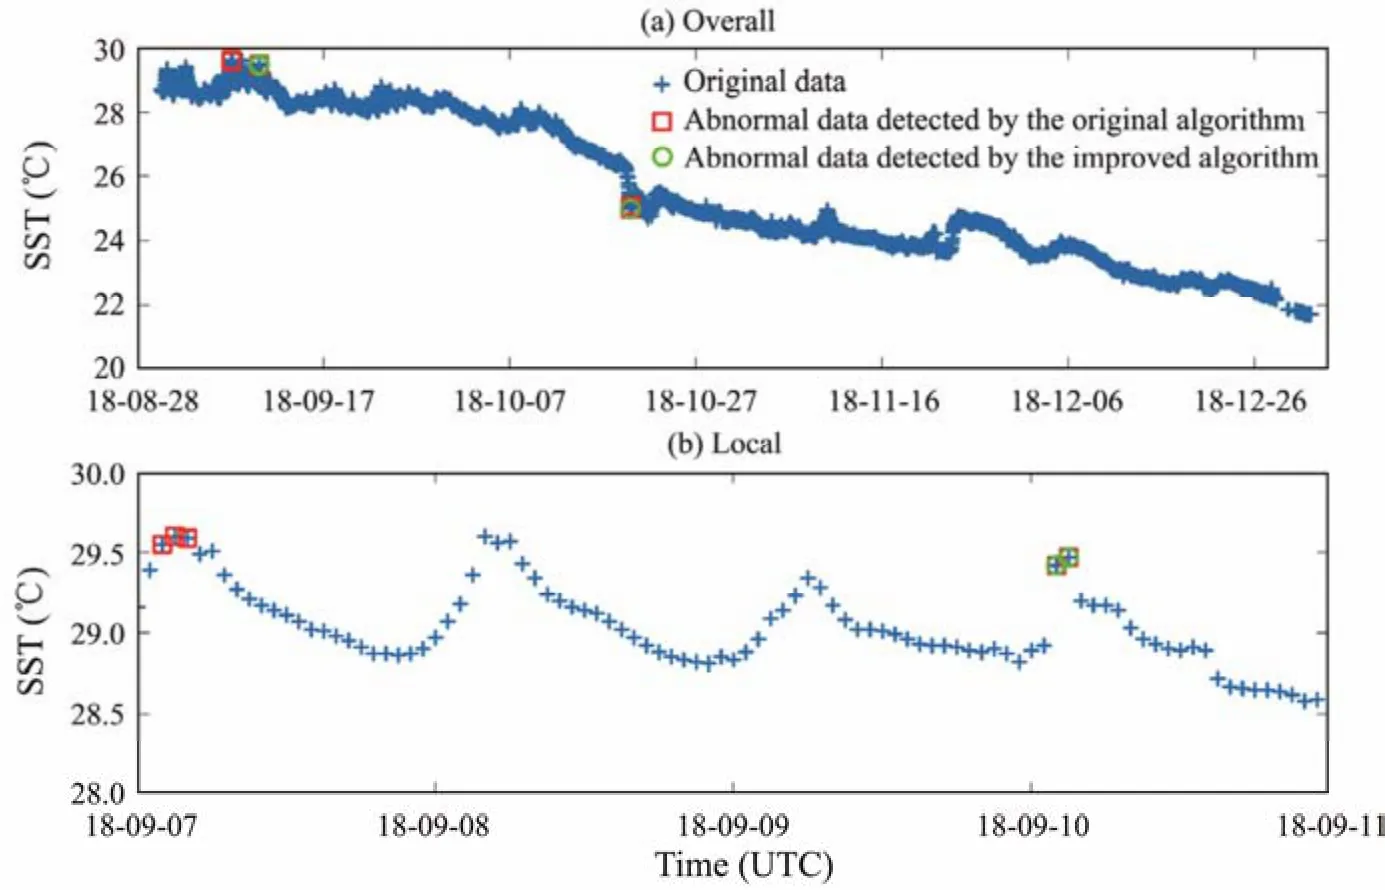
Fig.5 QC results of SST observed by DrIB 5840.
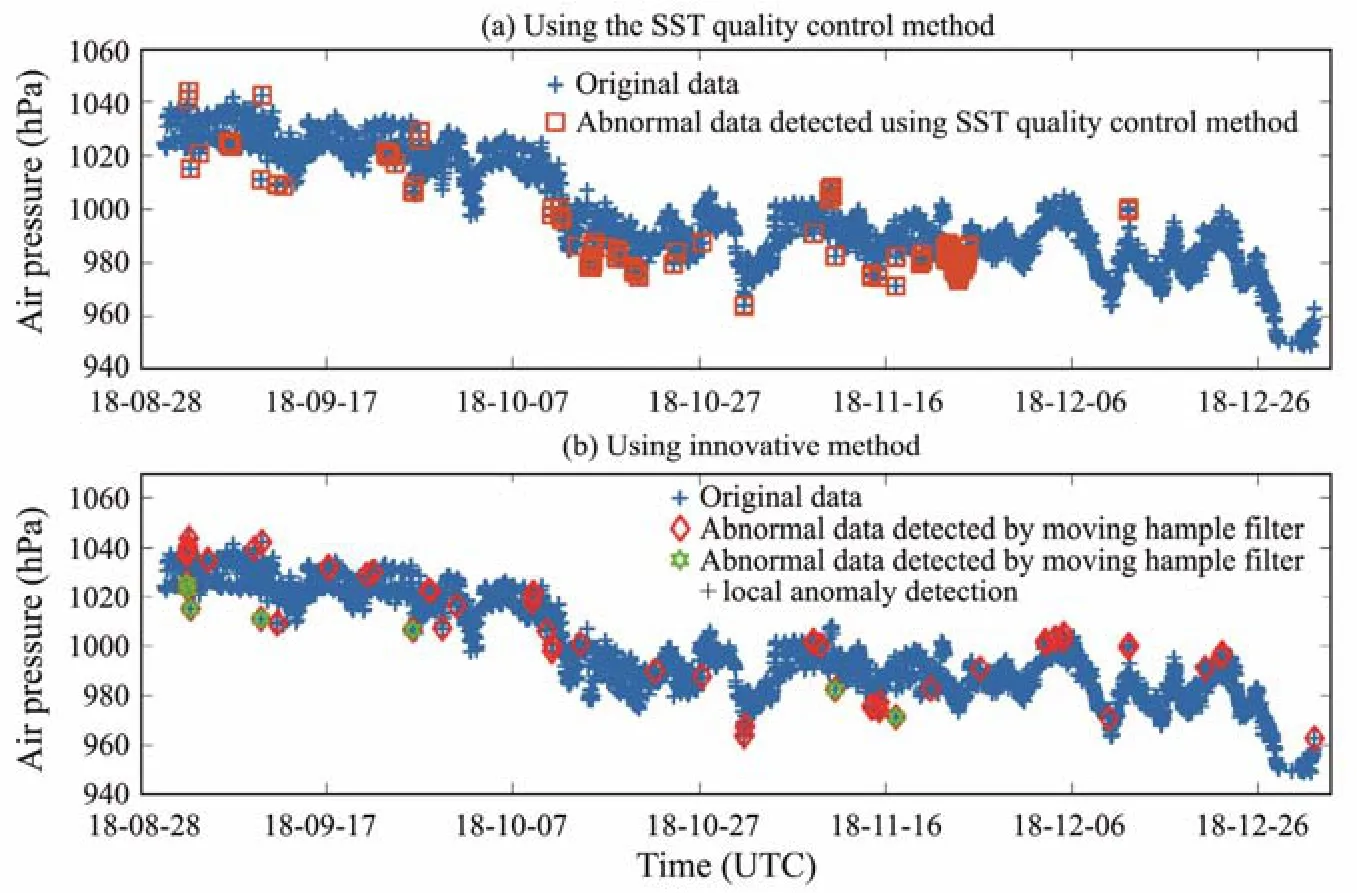
Fig.6 QC results of air pressure observed by DrIB 5840.
Fig.7 shows the DrIB 5840 observations after QC. Abrupt values and outliers out of the developing trends were identified and deleted or replaced by interpolation. The continuity and regularity of the time series were intact, the characteristics of the developing trends were evident, the data quality was significantly improved, and the data can be used for subsequent applications. The DrIB 8990, which had a short observation time, fewer observation data, and better quality, showed no anomaly in the detection by the basic QC. All anomalies in Table 3 came from the targeted QC. Given that the observation interval of DrIB 8990 was 10 min, the criteria of the continuity test for variables were adjusted adaptively. Fig.8 shows the comparison of the time series before and after QC, in which abnormal values were detected from air pressure, wind speed, SST, and relative humidity observations, and the sharp points on the curve were eliminated after QC.
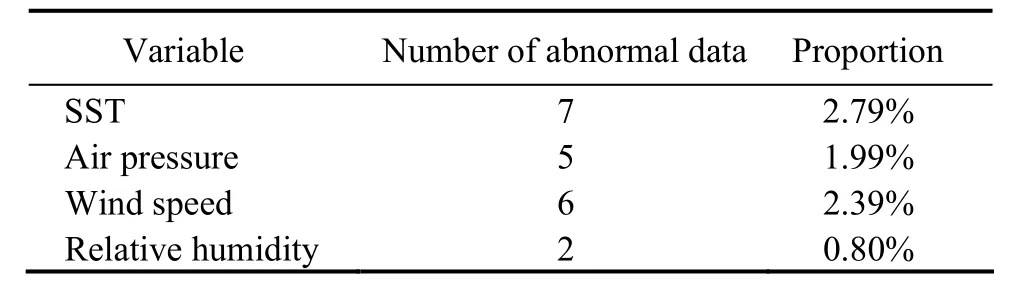
Table 3 QC results of observations from DrIB 8990

Fig.7 Time series of DrIB 5840 observations (after QC).
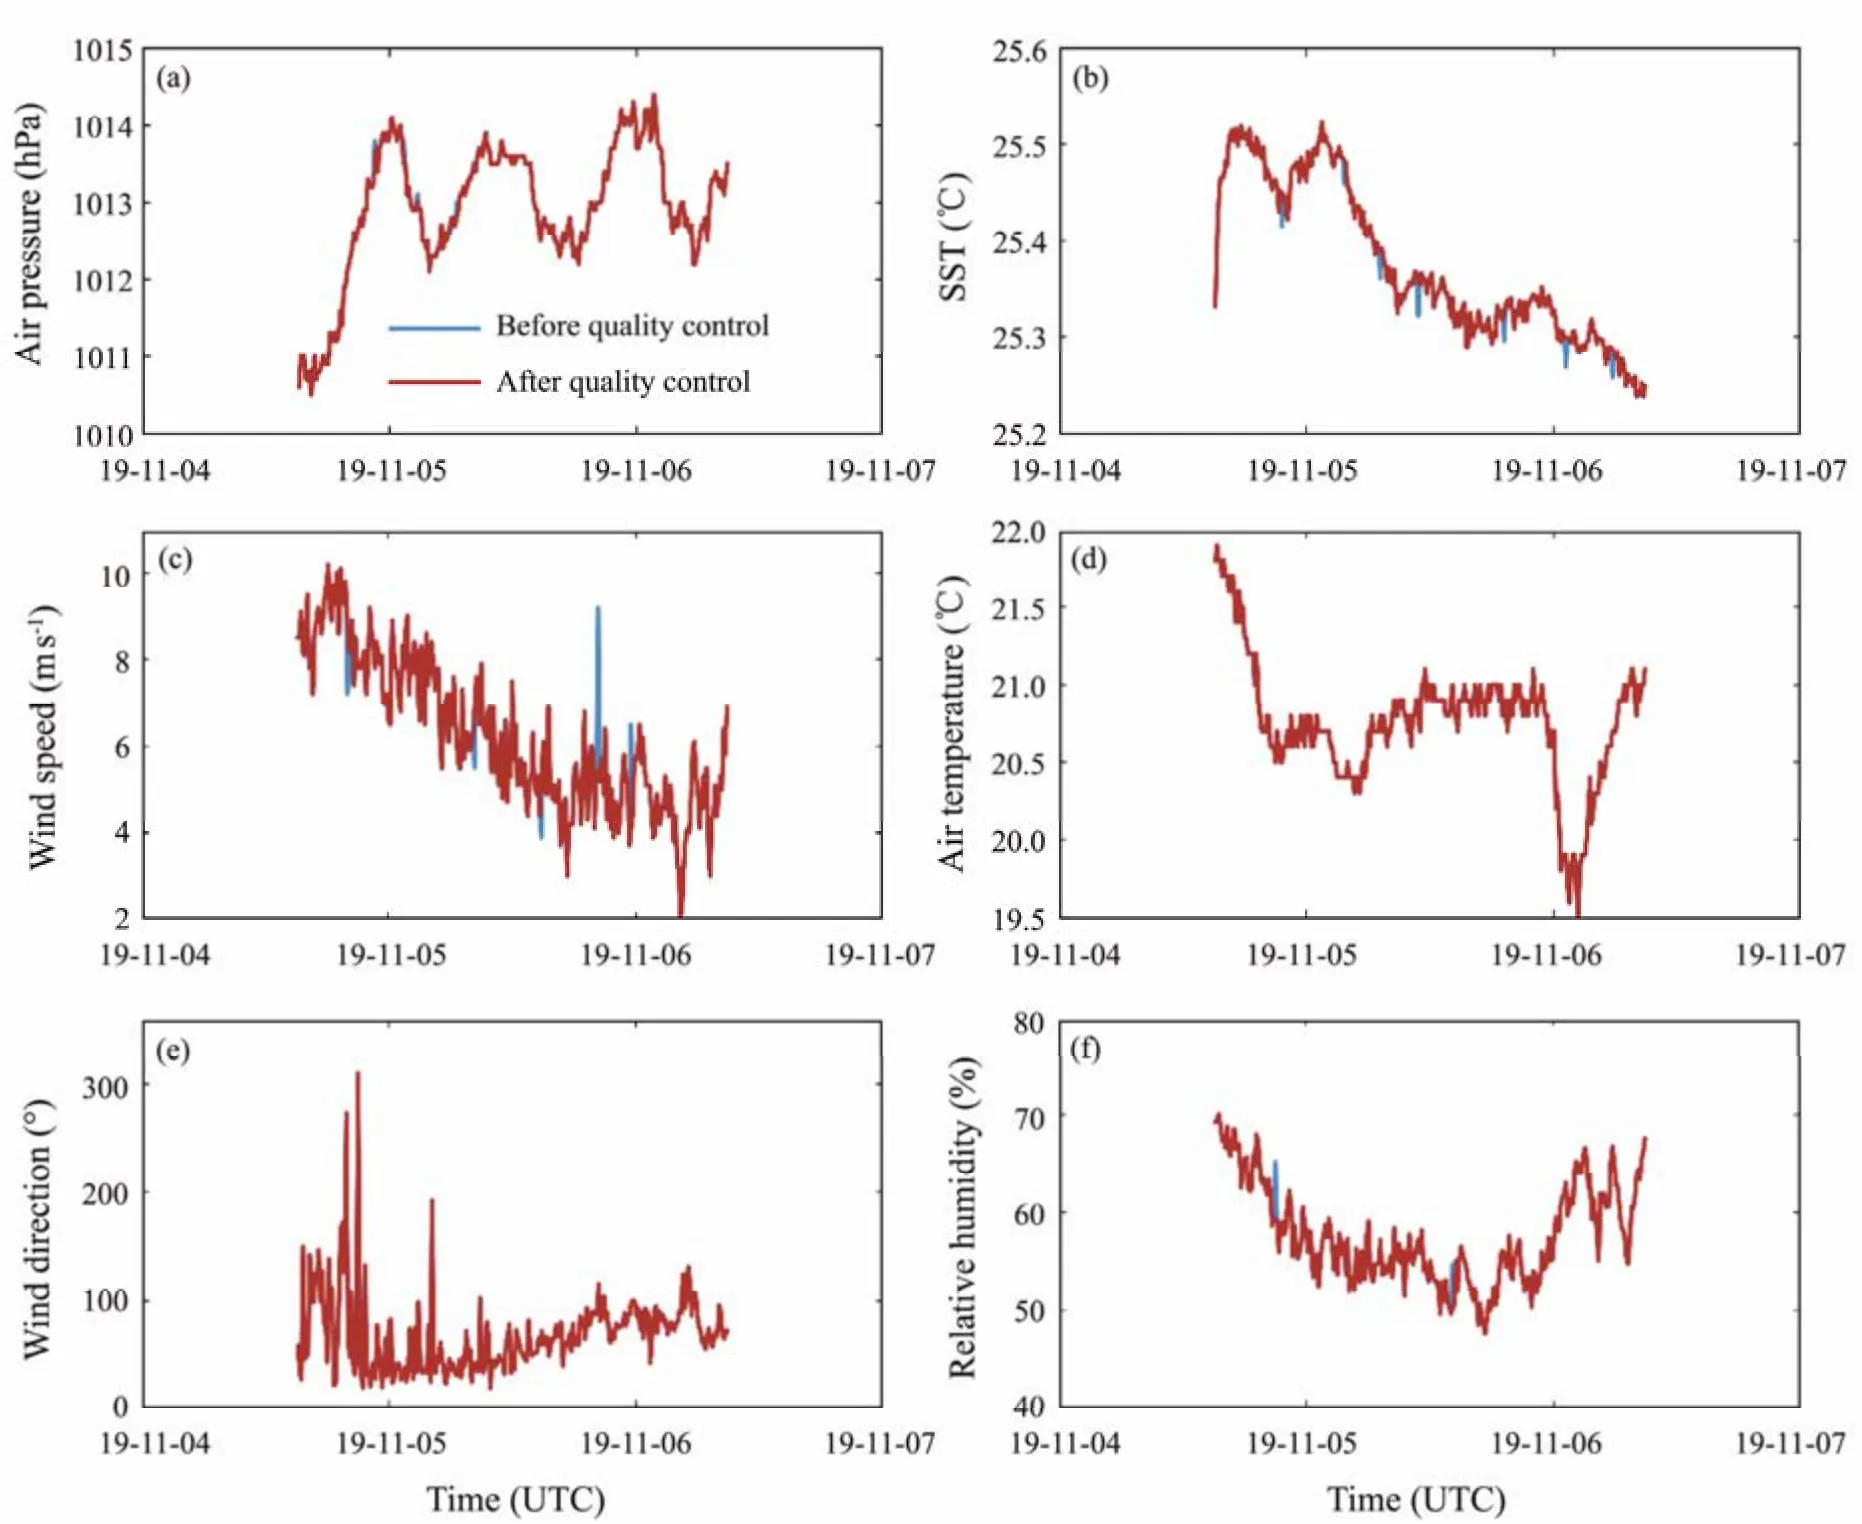
Fig.8 QC results of DrIB 8990 observations.
3.3 Validation of QC Effect
To better assess the effect of QC, we compared and evaluated the observations of DrIB 8990 before and after QC using the internationally recognized KEO buoy observations as the evaluation standard. The observation of DrIB 8990 covered the area of Kuroshio Extension and was adjacent to the KEO buoy (Fig. 9(a)). The KEO buoy was deployed in the southern area of the Kuroshio Extension, and the nominal location was 32.3˚N, 144.6˚E. Its observations were widely used in the research related to the Kuroshio Extension.
Given the drifting characteristics of DrIB, spatiotemporal matching of the evaluated data was necessary. Fig.9(b)shows the distance variation between the DrIB 8990 and the KEO buoy with time. The paired data were the observations obtained at the same time within 10 km of the two buoys, that is, 164 records from 18:50 on November 4,2019, to 22:00 on November 5, 2019. A 10 km distance was considered because the KEO buoy observes in a circular scope with a diameter of more than 10 km, and the air-sea environment within its 10 km can be considered relatively consistent (Zhanget al., 2016; Andersonet al.,2020). As the KEO buoy did not provide 10 min observations of SST for the selected periods, the comparison of variables only included air pressure, wind speed, and relative humidity. In addition, DrIB and KEO buoys observe meteorological variables at different heights. The former observes relative humidity at approximately 2.8 m and air pressure and wind at approximately 3 m, and the latter pro-vides wind at a nominal height of 4 m and air pressure and relative humidity at a nominal height of 2.5 m. Therefore,the data must be unified to the same height first. By applying the COARE 3.0 formula and inputting variables, including SST, air pressure, air temperature, relative humidity, wind speed, and the corresponding observation heights,the meteorological field at the height of 10 m above the sea surface can be outputted, thus unifying the heights of the two sets of meteorological variables (Fairallet al.,2003). Given the lack of 10 min SST of the KEO buoy, the quality-controlled SST of DrIB 8990 was used to perform the height transformation of the KEO buoy observations instead.
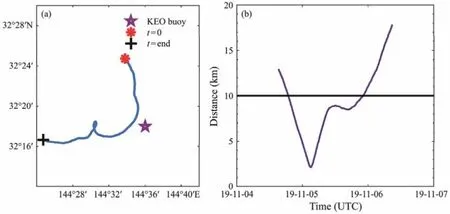
Fig.9 Position (a) and distance (b) of DrIB 8990 relative to the KEO buoy.
Evaluation of the effect of QC mainly relied on two indicators, namely, data correlation and data difference, and the statistics used included correlation coefficientr, mean absolute error (AE), maximum absolute error (MAE), and root mean square error (RMSE), which are defined as follows.
wherenis the number of paired data,biis the DrIB observation,kiis the KEO buoy observation,represents the arithmetic mean of the DrIB observations, anddenotes the arithmetic mean of the KEO buoy observations.The comparison results are shown in Fig.10 and Table 4.The solid curves in Fig.10 correspond to the left ordinate,and dashed and dotted curves refer to the right ordinate.

Table 4 Comparison between the observations of DrIB 8990 and KEO buoy

Fig.10 QC effect of DrIB 8990 observations.
The results showed that the paired air pressure was the most consistent among the three variables. The correlation coefficient can intuitively reflect the degree of linear correlation between the two air pressures. The correlation coefficient between the original air pressure of DrIB 8990 and the KEO buoy was over 0.98, which was highly correlated at the 95% confidence level, and the changes in the two curves were almost the same. All three difference statistics were less than 0.5 hPa, which shows that the quality of DrIB observations reached the advanced international level. The quality of air pressure can only be slightly improved due to the high correlation and presence of a few anomalies. Ther, AE, andRMSEafter QC were optimized by about 10−3orders of magnitude, andMAEwas reduced by about 0.1 hPa. Contrary to the air pressure, the correlation coefficient between the relative humidity of DrIB 8990 and the KEO buoy was the smallest (approximately 0.4), and the difference statistics also showed weak data conformity. The relative humidity observed by the DrIB 8990 was approximately 3% higher than that of the KEO buoy on average, and the maximum exceeded 9%. Fig. 10(c)shows a few anomalies of relative humidity data detected by the QC procedure, and the data quality improved overall.The correlation coefficient increased, the deviation decreased, and the optimizations were mostly between 10−3– 10−2orders of magnitude. The time series of wind speed fluctuated strongly, but the developing trends of the two were generally consistent. Before QC, ther, AE, andRMSEwere approximately 0.77, 1 m s−1, and 1.2 m s−1, respectively. After QC, the extreme outliers out of the time series were eliminated. As a result, the correlation coefficient increased to greater than 0.8, andMAEwas reduced from approximately 5.6 m s−1to 2.8 m s−1. QC of the wind speed was the most effective, and the reliability of wind speed observations significantly improved.
4 Conclusions
Focusing on the air-sea interface, this study integrated various QC methods and established a scientific and practical QC procedure for the new drifting buoy observations in the order of an initial basic inspection and then targeted QC. The main conclusions and innovations are as follows.
1) The QC procedure considers the swaying attitude of the buoy in the water, design observation indexes, and the error of the instrument itself, and it is more reasonable and more efficient than most QC methods that only rely on data.
2) For different observational variables, respective methods were adopted to reduce the probability of misjudgment and significantly improve the effect of QC.
3) The coefficient weight of the SST continuity check algorithm was optimized based on the differences in the sea area where the data came from. Thus, the algorithm was consistent with the characteristics of the actual air-sea environment, which expanded the application of the algorithm and effectively improved the accuracy of the QC.
4) The innovative method combining moving Hampel filter and local anomaly detection ensured the reliability of QC results of meteorological variables in terms of mathematical statistics and actual physical processes.
Although the evaluation of local and short-term observations was less reliable in demonstrating the effect of QC,overall, the outliers in the time series were effectively handled. After QC, the linear correlation between the observations from DrIB 8990 and KEO buoy as the control subjects increased, and the deviation decreased. The wind speed exhibited the best QC performance, the correlation coefficient before and after QC improved from around 0.77 to 0.82,andMAEwas reduced by approximately 2.8 m s−1. In addition, the quality of air pressure and relative humidity was optimized by 10−3– 10−2orders of magnitude.The results showed that the QC procedure for DrIB observations established in this study is scientific, effective,and practical, and it can provide references for the processing of observations from mobile platforms, promote the operational application of the new air-sea interface observation technologies, and offer data basis for marine environmental protection, ocean forecasting, air-sea interaction, and climate research. Marine observations are affected by many factors, such as the instruments themselves and changes in the ocean environment, and the data collected by DrIB are numerous and heterogeneous. Anomalous data also exhibit complex morphological characteristics. Therefore, finding a general QC method that can accurately identify and deal with all the anomalies is difficult. The QC procedure established in this study considers the circumstances that may lead to abnormalities in DrIB observations and has been experimentally verified to be feasible and practical. The QC procedure effectively detects independent and individual outliers in the time series.However, for continuous anomalous values, the QC performance needs further improvement, which will be the focus of our subsequent research.
Acknowledgements
This study is supported by the Natural Resources Development Special Fund Project of Jiangsu Province (No.JSZRHYKJ202009), the Taishan Scholar Funds (No. tsqn 201812022), the Fundamental Research Funds for the Central Universities (No. 202072001), the Guangxi Key Laboratory of Marine Disaster in the Beibu Gulf, Beibu Gulf University (No. 2021KF03), and the National Natural Science Foundation of China (No. 42176020). The authors are grateful for the financial support.
杂志排行

Journal of Ocean University of China的其它文章
- Using Natural Radionuclides to Trace Sources of Suspended Particles in the Lower Reaches of the Yellow River
- Eutrophication of Jiangsu Coastal Water and Its Role in the Formation of Green Tide
- Evaluation of the Shallow Gas Hydrate Production Based on the Radial Drilling-Heat Injection-Back Fill Method
- Microstructure Characterization of Bubbles in Gassy Soil Based on the Fractal Theory
- Morphological and Sulfur-Isotopic Characteristics of Pyrites in the Deep Sediments from Xisha Trough, South China Sea
- Deformation Characteristics of Hydrate-Bearing Sediments