Distribution,health and ecological risk assessments of trace elements in Nigerian oil sands
2024-03-06OdunayoOreFestusAdebiyi
Odunayo T.Ore • Festus M.Adebiyi
Abstract The Nigerian oil sands represent the largest oil sand deposit in Africa,yet there is little published information on the distribution and potential health and ecological risks of trace elements in the oil resource.In the present study,we investigated the distribution pattern of 18 trace elements (including biophile and chalcophile elements) as well as the estimated risks associated with exposure to these elements.The results of the study indicated that Fe was the most abundant element,with a mean concentration of 22,131 mg/kg while Br had the lowest mean concentration of 48 mg/kg.The high occurrence of Fe and Ti suggested a possible occurrence of ilmenite(FeTiO3) in the oil sands.Source apportionment using positive matrix factorization showed that the possible sources of detected elements in the oil sands were geogenic,metal production,and crustal.The contamination factor,geo-accumulation index,modified degree of contamination,pollution load index,and Nemerow pollution index indicated that the oil sands are heavily polluted by the elements.Health risk assessment showed that children were relatively more susceptible to the potentially toxic elements in the oil sands principally via ingestion exposure route (HQ >1E-04).Cancer risks from inhalation are unlikely due to CR <1E-06 but ingestion and dermal contact pose severe risks (CR >1E-04).The high concentrations of the elements pose serious threats due to the potential for atmospheric transport,bioaccessibility,and bioavailability.
Keywords Biophile ∙Chalcophile ∙Oil sand ∙Risk assessment ∙Trace element
1 Introduction
Oil sands are unconventional fossil fuels composed of bitumen,sands,clay,and water (the latter three combinedly referred to as tailings)(Adebiyi and Ore 2021;Ore and Adebiyi 2023b).Nigeria has the largest oil sand deposit potential in Africa (Adebiyi et al.2017).Alternative energy sources are being sought due to increased industrial production and economic development (Li et al.2019).Increasing attention is shifting towards oil sands and other unconventional fossil fuels owing to the necessity to satisfy energy needs all over the world (Ore &Adebiyi 2021,2023a;Ore and Adeola 2021).In Nigeria,oil sands remain unexplored on a large scale due to the technological problems associated with their development (Adebiyi and Ore 2021).The water in contact with oil sands,often referred to as process water,usually contains metals,organic and inorganic compounds,and suspended solids(Qin et al.2019).Of the aforementioned contaminants,metals particularly exhibit a high degree of nonbiodegradability and their release into the environment can threaten both aquatic and human lives(Swigert et al.2015;Song et al.2021;Torimiro et al.2021).As a result of their toxicity,the United States Environmental Protection Agency has classified 13 elements(comprising Zn,Tl,Ag,Se,Ni,Hg,Pb,Cu,Cr,Cd,Be,As,and Sb) as priority pollutants (Al Mamun et al.2021).
The exploration and development of oil sands has its attendant effects on both humans and the environment at large.Most of these nonhuman effects are widely documented in the literature including the contamination of air,water,and land (Schwalb et al.2015;Adeola et al.2022).In addition,the regions in which these oil sands are found equally have associated socioeconomic impacts ranging from adjustments in the labour market,urbanized settlements,and increased populations.In some instances,the communities undergo changes in their way of life.Owing to environmental change,senses of knowledge,language,and place are also impacted(Schreyer 2008).However,the health effects of oil sand exploration are equally pronounced.For instance,oil sand mining in communities like Fort Chipewyan and Fort McKay (Canada) has been implicated to contribute to increased rates of respiratory illnesses and cancers (Druks 2013;Westman and Joly 2019).
Government officials have made a practice of debunking claims of an existing link between oil sand development and health issues(Westman and Joly 2019).While many of these concerns have been raised in the media,not many research studies have sufficiently addressed them.The present study is one of the few attempts to establish the links between public health concerns and oil sand development in Nigeria.The study is designed to examine the distribution pattern of potentially toxic elements in Nigerian oil sands as well as evaluate their potential health and ecological risks.
2 Methodology
2.1 Sample collection and preparation
Samples of oil sands were collected from five different locations,namely: Orisunbare (B1),Agbabu (B2),Mile 2(B3),Ilubirin(B4),and Olowo-Irele(B5),in the study area.The area of study which is the oil sand deposit area in Ondo State,Nigeria lies within Latitude 6° 35.448′N and 6° 39.169′N and longitudes 4° 48.768′E and 4° 53.409′E.The map of the study area is shown in Fig.1.The samples were collected by scooping the viscous oil sands into hermetically sealed containers,labeled according to the names of the communities from which the samples were collected and transported to the laboratory for various analyses.From each sampling location,several oil sand samples were collected and homogenized to form a composite sample that is representative of the specific sampling location.

Fig.1 Map of the study area showing Orisunbare,Agbabu,Mile 2,Ilubirin,and Olowo-Irele sampling points.The green points indicate the sampling locations
2.2 Elemental analysis
In this study,standards for quality assurance and control spanning sample preparation,storage,preservation,transport,and analysis were adopted (Paetz and Cro¨βmann 1994).By analyzing the International Atomic Energy Agency (IAEA) standard reference soil 7 material,which was prepared and analyzed for trace elements using the same protocols as the oil sand samples,the precision and accuracy of the technique were confirmed.Furthermore,the instrumental results were comparatively measured with the certified values (Thornton 1993).Triplicate measurements were also carried out.Accurately measured 2 g each of the oil sand was analyzed using Energy Dispersive X-ray Fluorescence (EDXRF) for its elemental composition comprising K,Ca,Ti,V,Cr,Mn,Fe,Ni,Cu,Zn,As,Se,Br,Rb,Sr,Y,Zr,and Nb.The EDXRF spectrometer consists of a self-contained miniature X-ray tube system ECLIPSE-III,which includes the X-ray tube with a silver (Ag) transmission target,a beryllium window,and a portable controller incorporating the power supply and control electronics.The controller generates the voltages needed to operate the X-ray tube and provides both voltage(kV) and current (μA) display and control.The X-Ray detector is Model XR-100CR,a high-performance thermoelectrically cooled Si-PIN photodiode,with a pre-amplifier.It is powered by a PX2 CR power supply,which includes a spectroscopy-grade shaping amplifier.The detector has a resolution of 220 eV FWHM,for the 5.9 keV peak of 55Fe.It is coupled to an MCA8000A multichannel analyzer for signal processing and data acquisition.Each sample pellet was irradiated for 1000 s at fixed conditions of 25 kV and 50 μA.Spectral data analysis was completed using the AXIL fitting program contained in the QXAS software package supplied by the International Atomic Energy Agency (IAEA),Vienna.
2.3 Health and ecological risk assessments
The health risk assessment of the trace elements determined in the oil sand samples was estimated based on the exposure pathways of ingestion,inhalation,and dermal exposure.The equations describing both non-carcinogenic and carcinogenic health risks are illustrated in our previous studies(Adebiyi et al.2021,2022).However,the equations used to estimate the contamination factor,geoaccumulation index,nemerow pollution index,modified degree of contamination,pollution load index,and potential ecological risk assessment are briefly described below.
2.3.1 Contamination factor (CF)
Contamination factor is an estimate of the levels of anthropogenic inputs in environmental samples (Keshavarzi &Kumar 2019).The level of contamination of the samples by the elements is expressed in terms of a contamination factor (CF) calculated as:
where the contamination factor CF <1 refers to low contamination;1 ≤CF <3 means moderate contamination;3 ≤CF ≤6 indicates considerable contamination and CF >6 indicates very high contamination (Hakanson 1980).
2.3.2 Geoaccumulation index (Igeo)
An index of geo-accumulation(Igeo)is used to quantify the extent of metal contamination associated with the samples.It was calculated using the equilibrium equation below.
where Cnis the measured concentration of the element ‘n’in the sample and Bnis the geochemical background value of the element n and 1.5 is the background matrix correction factor due to lithogenic effects.The geo-accumulation index (Igeo) was distinguished into seven classes as:Igeo ≤0,class 0,unpolluted;0 <Igeo ≤1,class 1,from unpolluted to moderately polluted;1 <Igeo ≤2,class 2,moderately polluted;2 <Igeo≤3,class 3,from moderately to strongly polluted;3 <Igeo≤4,class 4,strongly polluted;4 <Igeo≤5,class 5,from strongly to extremely polluted;and Igeo>5,class 6,extremely polluted(Adebiyi et al.2020).
2.3.3 Modified degree of contamination (mCd)
The degree of contamination in the oil sands by metals was calculated as shown below:
where N is the number of elements analyzed and CF is the contamination factor.The modified degree of contamination is distinguished into seven classes: mCd <1.5 indicating nil to very low degree of contamination,1.5 ≤mCd <2 indicating low degree of contamination,2 ≤mCd <4 indicating moderate degree of contamination,4 ≤mCd <8 indicating high degree of contamination,8 ≤mCd <16 indicating very high degree of contamination,16 ≤mCd <32 indicating extremely high degree of contamination and mCd ≥32 indicating ultrahigh degree of contamination (Adebiyi et al.2022).
2.3.4 Pollution load index (PLI)
The pollution load index was calculated using:
where N is the number of metals studied and CF is the contamination factor.The PLI is able to give an estimate of the metal contamination status and the necessary action that should be taken.A PLI <1 denotesperfection;PLI=1 present that only baseline levels of pollutants are present and PLI >1 would indicate deterioration of site quality(Tomlinson et al.1980).
2.3.5 Nemerow pollution index
The Nemerow pollution index is used to estimate the overall pollution associated with an environmental sample by potentially toxic elements.It is calculated using the formula:
where NPI=nemerow pollution index,PIaveand PImaxare the mean and maximum values of single pollution indices for individual elements (Saljnikov et al.2019).
2.3.6 Potential ecological risk assessment
The potential ecological risk index (RI) determines the sensitivity of biological communities in large contaminated areas (Hakanson 1980).This method comprehensively considers the synergy,toxic level,concentration of the heavy metals and ecological sensitivity of heavy metals(Adebiyi et al.2023).It takes into account the CF of metals,their potential ecological risk factor (Er) and the toxicological response factor (Tr).It is determined as:
2.4 Data analysis
The data obtained was processed using positive matrix factorization to identify the possible sources of trace elements in the oil sand samples using the EPA-PMF software(version 5).Better estimates of pollution sources are provided by positive matrix factorization in contrast to other source identification methods such as principal component analysis (Kuerban et al.2020).The positive matrix factorization model is a multivariate receptor model that uses uncertainty-weighted data and requires no source profiles (Paatero&Tapper 1994).It is one of the recipient models proposed by the United States Environmental Protection Agency (USEPA) for source apportionment studies (Zhang et al.2018).
3 Results and discussion
3.1 Validation of analytical procedures
Table 1 displays the findings of the analysis.By applying the chosen technique,there were very few differences between the reference material’s certified elemental values and its elemental levels.The acquired results were consistent with the certified values,which lends adequate support to the validity,repeatability,and dependability of the study’s findings.
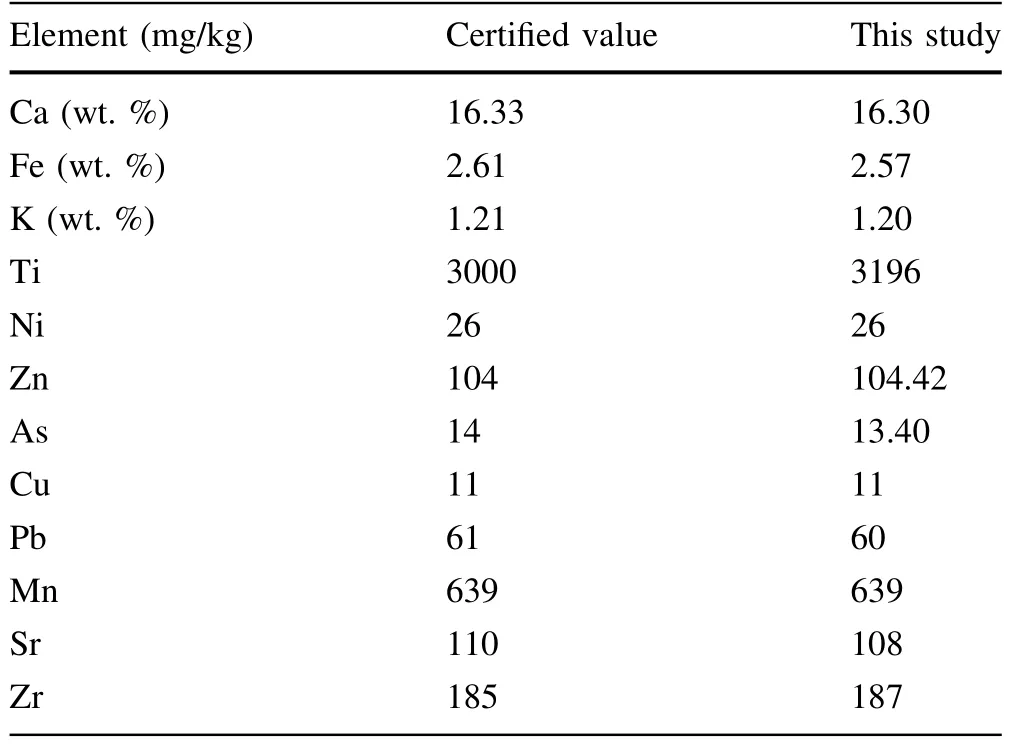
Table 1 IAEA reference material Soil-7 analysis results (mg/kg)
3.2 Elemental levels
The elemental levels of the studied oil sands are presented in Tables 2 and 3.Eighteen elements comprising potassium,calcium,titanium,vanadium,chromium,manganese,iron,nickel,copper,zinc,arsenic,selenium,bromine,rubidium,strontium,yttrium,zirconium,and niobium were detected and their concentrations determined by the spectrometer.The results indicated that Fe had the highest mean concentration of 22,131.92 ± 707.766 mg/kg ranging from 1605.452 to 66,150 mg/kg while Br had the least mean concentration of 48.821 ± 5.487 mg/kg rangingfrom 22.071 to 66.019 mg/kg.The coefficient of variation was used to estimate the degree of variation of the elements(Zhao et al.2020).Other than Br,the coefficient of variation was generally less than 10%,indicating minimal variability in the data set (Fu et al.2014).In agreement with earlier findings (Oluwole et al.1987;Ogunsuyi et al.2012;Adebiyi and Ore 2021),the observed relative upsurge in Fe levels of the oil sands agrees with the assertion that Nigerian soil is rich in Fe (Asubiojo and Adebiyi 2011).Generally,the mean elemental levels of the oil sands followed the trend: Fe >K >Ti >Ca >Mn >Zr >Ni >Sr >Zn >V >Se >Cr >Nb >Rb >Cu >Y >As >Br.A possible occurrence of ilmenite (FeTiO3)is suspected in the oil sands due to the relatively high abundance of Fe in conjunction with Ti (Ogunsuyi et al.2012;Adebiyi and Ore 2021).Crustal elements (such as Fe,K,Ca,and Ti)may have been picked up from plant and animal precursors that resulted in the production of crude oils from which bitumen is made through biodegradation and/or via leaching during the mobility of bitumen from source rock to its current reservoir (Adebiyi et al.2013).The occurrence of transition metals such as Fe,Ti,Mn,Ni,Zn,V,Cr,and Cu in the oil sands is probably due to their existence in petroleum with a significant input of porphyrin-precursor chlorophylls to the organic matter (Madu et al.2011;Adebiyi and Ore 2021).
The mean elemental concentrations of the studied oil sands were compared with the elemental concentrations of oil sands and sand fractions reported in previous studies and are shown in Fig.2.Other than K,Ca,Ti,Cr,Fe,Cu,Br,Y,and Nb,the elemental levels of sand fractionsreported in another study (Adebiyi and Ore 2021) were higher than those of the present study.The present study reports increased elemental concentrations than those reported in the studied oil sands by other authors (Ogunsuyi et al.2012).This variation is attributed to differences in the properties of the studied oil sands.In addition,the observed upsurge in the present study might be due to the increased pick-up of metals overtime during the formation of the oil sands.

Fig.2 Comparison of mean elemental concentrations with other studies.The study by Adebiyi and Ore (2021) had relatively high values of PTEs while the study by Ogunsuyi et al.(2012) had relatively low concentrations of PTEs
3.3 Source apportionment
The possible sources of the elements in the studied oil sands were estimated using the positive matrix factorization (PMF).In the study,the convergent run with the best optimal solution was selected.The PMF model contained three factors as shown in Fig.3 and Table 4.Factor 1 accounted for 31.71% of the data variance and it was mainly dominated by individual contributions of yttrium(63.5%),niobium (61.1%),and calcium (50.4%).The individual contributions of potassium (37.2%),arsenic(40.2),nickel(44.8%),and copper(46.6%)were relatively lower but slightly dominant.Studies have shown that elevated levels of Cu are associated with Ni levels if they originate from the same parent material (Korte 1999;Adebiyi et al.2020).Mineral weathering represents an important source of rare earth elements such as yttrium and niobium,and essential elements such as calcium and potassium,in the environment (Price 1995;Ramos et al.2016).Factor 1 seems to be largely affected by this natural phenomenon;therefore,it can be ascribed to geogenic sources.

Table 4 Source profiles of elements in the oil sands using positive matrix factorization (PMF)
Factor 2 accounted for 29.59%of the total data variance.Its principal contributions were mainly from Ti(77.2%),Cr(78%),and Fe (78%).Other significant contributions emanated from V(38.5%),Mn(48.5%),Br(40%),and Nb(39.9%).In addition to the natural levels of these elements in the oil sands,studies have shown that Cr,Fe,and Mn are present in the gas and ash released during the combustion of fuel(Suryawanshi et al.2016;Bozkurt et al.2018).It is therefore likely that factor 2 might be attributed to metal production and manufacturing.
Factor 3 mainly accounted for the contribution of Zn(65.8%),Se(80.9%),Br(60%),Rb(68.6%),Sr(77.5%),Zr(60.6%),V (40.4%),Ni (45.2%),and As (45.2%) with its overall contribution to data variance being the highest(38.68%).These elements are markers of hydrocarbon formation and/or oil production processes (Landis et al.2012;Guo et al.2020).Therefore,factor 3 can be attributed predominantly to crustal element sources.
3.4 Pollution indices and potential ecological risk assessment
Various indices of pollution comprising of contamination factor,geo-accumulation index,modified degree of contamination,pollution load index,and nemerow pollution index were used in estimating the pollution levels of the oil sands by the elements.The results of the pollution indices are presented in Table 5.

Table 5 Pollution indices of elements in oil sands
There are variations in the contamination factors of the oil sands.Agbabu oil sand exhibited very high contamination by K,Ca,V,Mn,Fe,Ni,Cu,Zn,As,Rb,Sr,and Zr,considerable contamination by Ti,and moderate contamination by Cr respectively.On the other hand,Ilubirin oil sand exhibited very high contamination by Zr,Sr,Rb,As,Zn,Cu,Ni,Fe,Mn,V,Ti,and K and moderate contamination by Ca and Cr respectively.Furthermore,Mile 2 oil sand exhibited very high contamination by K,V,Mn,Ni,Cu,Zn,As,Rb,Sr,and Zr,considerable contamination by Ca,Ti,and Fe,and moderate contamination by Cr respectively.Olowo-Irele oil sand exhibited very high contamination by Zr,Sr,Rb,As,Zn,Cu,Ni,V,and K,moderate contamination by Ca,Ti,and Fe,and low contamination by Cr and Mn.Orisunbare oil sand exhibited very high contamination by Zr,As,Zn,Cu,Ni,Fe,Mn,Cr,V,Ti,and K,considerable contamination by Rb,and moderate contamination by Ca and Sr respectively.
The geo-accumulation index,a quantitative measure of the contamination/pollution levels of environmental media,also showed some variations.Agbabu oil sand was unpolluted to moderately polluted by Cr,moderately polluted by Ti,moderately to strongly polluted by Ca and Fe,strongly to extremely polluted by K and Mn,and extremely polluted by V,Ni,Cu,Zn,As,Rb,Sr,and Zr.Ilubirin oil sand was unpolluted to moderately polluted by Ca and Cr,moderately to strongly polluted by Mn and Sr,strongly polluted by K,Ti,Fe,and Rb,strongly to extremely polluted by Zn,As,and Zr,and extremely polluted by V,Ni,and Cu.Mile 2 oil sand was unpolluted by Cr,moderately polluted by Ca,Ti,and Fe,strongly to extremely polluted by K and Mn,and extremely polluted by V,Ni,Cu,Zn,As,Rb,Sr,and Zr.Olowo-Irele oil sand was unpolluted by Cr,Mn,and Fe,unpolluted to moderately polluted by Ca and Ti,moderately to strongly polluted by K and Sr,strongly polluted by V,Zn,and Rb,strongly to extremely polluted by Zr,and extremely polluted by Ni,Cu,and As.Orisunbare oil sand was unpolluted by Sr,unpolluted to moderately polluted by Ca,moderately polluted by Rb,moderately to strongly polluted by Cr,strongly polluted by Ti,strongly to extremely polluted by K,Mn,Fe,Zn,and As,and extremely polluted by V,Ni,Cu,and Zr.
All of the investigated oil sands showed an ultra-high degree of elemental contamination,according to the modified degree of contamination.Because of the elevated quantities of the elements above background levels,the pollution load index revealed that the quality of the oil sands regions has deteriorated.In consonance,the multifactor nemerow pollution index indicated that the oil sands are heavily polluted by the elements.This is probably a reflection of the accumulation of elements in the oil sands.
The potential ecological risk index measures the individual contribution of elements to the pollution of the study area.The results of the potential ecological risk assessment are presented in Fig.4.The results showed that a low risk of contamination by Mn,Cr,and Ti,and a very high risk of contamination by As,Zn,Cu,Ni,and V are exhibited by Agbabu and Mile 2 oil sands.Low risk of contamination by Ti,Cr,Zn,and Mn,high risk of contamination by V as well as very high risk of contamination by As,Cu,and Ni,were exhibited by Ilubirin oil sand.Olowo-Irele oil sand showed a low risk of contamination by Zn,Mn,Cr,V,and Ti,as well as a very high risk of contamination by As,Cu,and Ni.Orisunbare oil sand exhibited a low risk of contamination by Ti,Cr,Mn,and Zn,a high risk of contamination by As,and a very high risk of contamination by V and Cu.Generally,the potential ecological risk index followed the order:Agbabu >Mile 2 >Olowo-Irele >Orisunbare >Ilubirin,and it showed that the studied oil sands exhibited very high ecological risk.
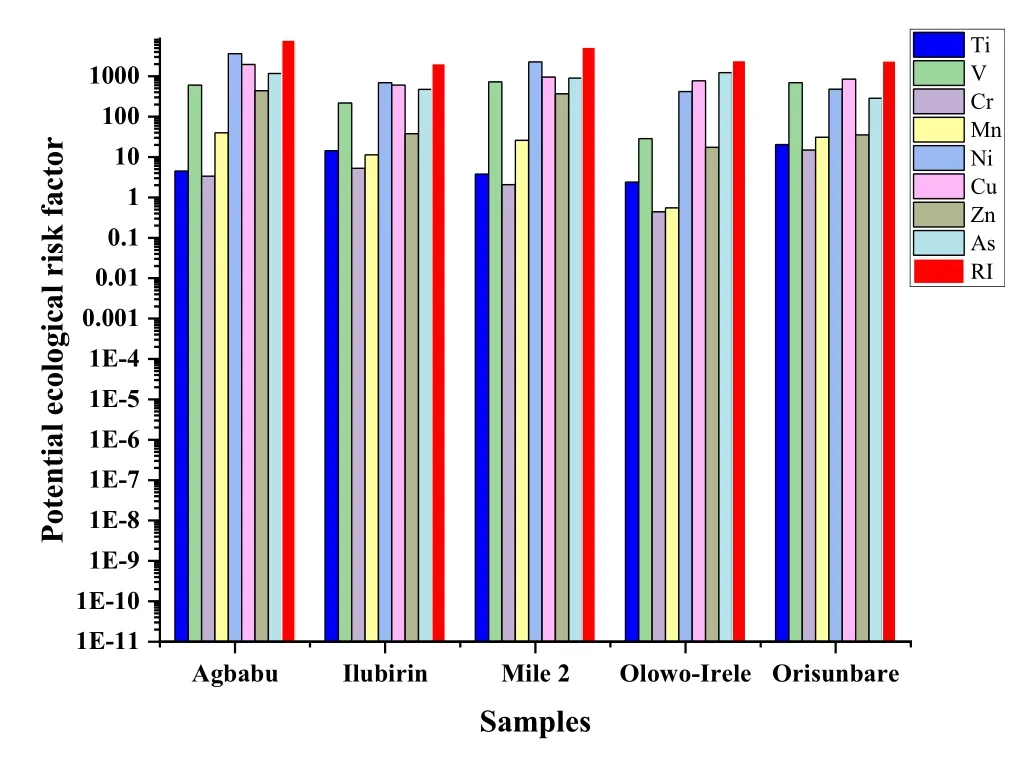
Fig.4 Potential ecological risk assessment of potentially toxic elements in the oil sands.RI=Potential ecological risk index
The ecological risk assessment of oil sands regions such as Agbabu,Ilubirin,Mile 2,Olowo-Irele,and Orisunbare revealed considerable variations in environmental contamination and related ecological risks.Because of extremely high contamination levels of various elements,including As,Zn,Cu,Ni,and V,Agbabu and Mile 2 pose the greatest ecological threats.This endangers the local ecology,notably aquatic life and soil quality.Ilubirin and Olowo-Irele both pose major environmental concerns,with Ilubirin posing high risks for V,Cu,and Ni and Olowo-Irele posing moderate to severe pollution for multiple elements.Orisunbare has high ecological hazards for V,Cu,and As,indicating a significant ecological threat that needs attention and remediation.
3.5 Health risk assessment
The non-carcinogenic and carcinogenic health risk assessment of potentially toxic elements in the oil sands was estimated concerning the exposure pathways comprising of ingestion,dermal contact,and inhalation.For both childrenand adult exposure,the non-carcinogenic health risk assessment comprising of chronic daily intake,hazard quotient,hazard index,and relative risk is presented in Tables S1-S10 (supplementary material) while a comparison of the hazard index for adults and children is shown in Fig.5.The oral reference doses used in the study are as recommended by the United States Environmental Protection Agency (USEPA).
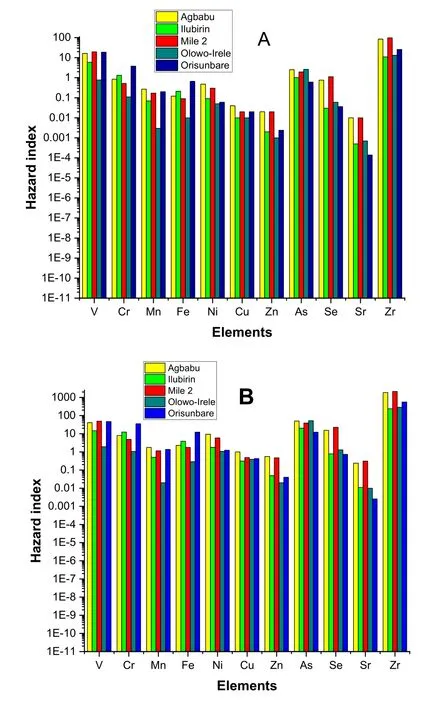
Fig.5 Hazard indices of analyzed elements in the oil sands.(A) Hazard index for adults (B) Hazard index for children
The non-carcinogenic risks associated with exposure to Cr,Mn,Fe,Ni,Cu,Zn,As,Se,Sr,and Zr in the Agbabu oil sand followed the order: ingestion >dermal >inhalation in children.The same order was maintained in adults for the elements except for V,Cr,and Mn which followed the order: dermal >ingestion >inhalation.Similar patterns were observed for Ilubirin,Mile 2,Olowo-Irele,and Orisunbare oil sands.Generally,the ingestion route proved to be the foremost exposure pathway to health risks.The hazard quotients of the elements were generally higher in children relative to adults.This indicated that children were more prone to non-cancer diseases,upon exposure to the oil sands.As posited by USEPA,a hazard quotient (HQ)less than the threshold value of 1 indicates that there is no significant risk associated with non-carcinogenic effect,whereas HQ higher than >1 indicates significant noncarcinogenic risk (Gujre et al.2021).The high HQ values observed in the study are indicative of adverse non-carcinogenic risks upon exposure to the elements.The relative risk showed that Zr made the most individual contribution to non-carcinogenic health risks.Although Zr finds extensive applications in the biomedical field (Lee et al.2010),its short-term exposure has been reported to cause eye irritation (Kulkarni and Naphade 2017).
The carcinogenic health risks associated with exposure to Cr,Ni,and As were calculated and presented in Table 6.The carcinogenic risk(CR)values were generally higher in children than in adults.The relative upsurge in CR values for the ingestion pathway showed that carcinogenic risks are more likely to occur through this route.Ingestion of metals could result in gastrointestinal mucosal tissue damage and liver abnormalities (Pobi et al.2020).On the other hand,dermal exposure to metals could result in serious allergic responses and irritant dermatitis (Gujre et al.2021).CR values greater than 1E-04 are indicative of adverse cancer risks.Cancer risks emanating from inhalation of the oil sands are unlikely due to their relatively lower CR values (CR <1E-06).However,the cumulative CR values showed that there are potential carcinogenic risks emanating from exposure to Cr,Ni,and As in the oil sands.
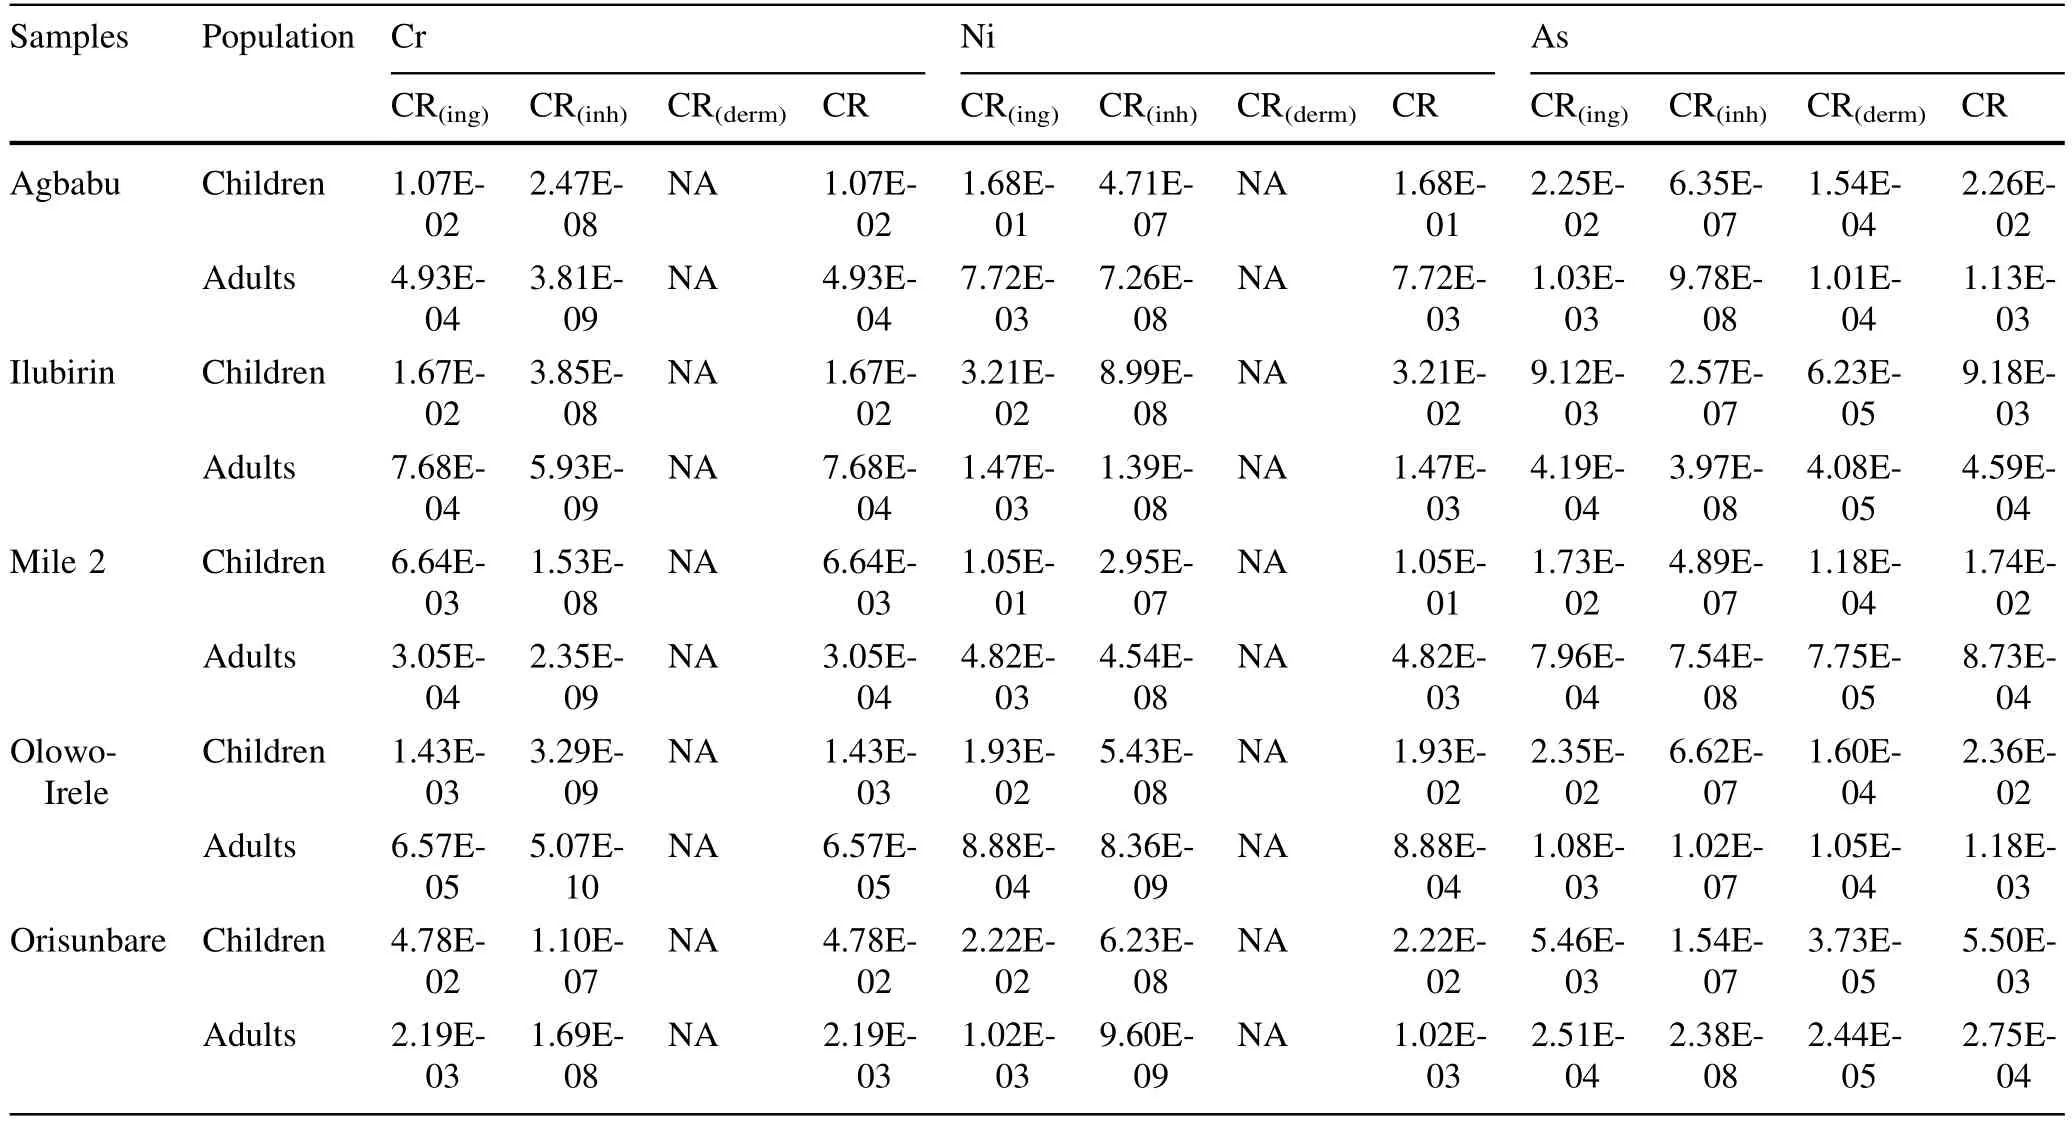
Table 6 Carcinogenic health risk assessment of Cr,Ni,and As in oil sand by children and adults
4 Conclusion
A comprehensive health and ecological risk assessment of Nigerian oil sands was carried out using trace elements as variables.The elemental characterization of the studied oil sands showed a possible occurrence of ilmenite due to the relative abundance of Fe and Ti.The observed Fe levels were consistent with the assertion that Nigerian soil is rich in Fe.Source apportionment using positive matrix factorization showed that geogenic sources,metal production,and crustal element sources were the possible sources of detected elements in the oil sands.Varying indices of contamination/pollution by the elements were identified in the oil sands.The health risk assessment showed that children were relatively more susceptible to the potentially toxic elements in the oil sands principally via the ingestion exposure route.Continuous monitoring of trace elements in oil sand deposit areas should be encouraged.Further studies should equally be carried out on the bioaccessibility of trace elements in particulates released into water,soil,and air.
Supplementary InformationThe online version contains supplementary material available at https://doi.org/10.1007/s11631-023-00641-7.
AcknowledgementsThe authors sincerely acknowledge the management of Obafemi Awolowo University,Ile-Ife,Nigeria for providing an enabling environment for the research.
Author contributionsOdunayo T.Ore: Software,Formal analysis,Writing-original draft,review and editing.FMA: Conceptualization,Methodology,Supervision,Writing—review and editing.
FundingNot applicable.
Availability of data and materialsThe data analyzed and/or generated during the study will be made available upon reasonable request from the corresponding author.
Declarations
Conflict of interestThe authors declare that there is no conflict of interest.
Ethics approvalNot applicable.
Consent to participateNot applicable.
Consent for publicationAll authors have approved the final version of the manuscript for publication.
杂志排行

Acta Geochimica的其它文章
- Geochemical modeling to aid experimental design for multiple isotope tracer studies of coupled dissolution and precipitation reaction kinetics
- The photosynthetic oxygen evolution does not exclude the important role and contribution of bicarbonate photolysis
- Mafic and felsic magmatism in the Wadi Kalalat area,South Eastern Desert,Egypt:mineralogy,geochemistry and geodynamic evolution during the Neoproterozoic in the Nubian Shield
- The co-transport of Cd(II) and nZnO in saturated soil packed column: effects of ionic strength and pH
- Facies development and sedimentology of the Middle Miocene carbonates of the Raghama Formation,northeastern Saudi Arabia
- Petrogenesis and tectonic implications of the Silurian adakitic granitoids in the eastern segment of the Qilian Orogenic Belt,Northwest China