Geochemical modeling to aid experimental design for multiple isotope tracer studies of coupled dissolution and precipitation reaction kinetics
2024-03-06MingkunChenPengLuYongchenSongChenZhu
Mingkun Chen • Peng Lu • Yongchen Song • Chen Zhu
Abstract It is a challenge to make thorough but efficient experimental designs for the coupled mineral dissolution and precipitation studies in a multi-mineral system,because it is difficult to speculate the best experimental duration,optimal sampling schedule,effects of different experimental conditions,and how to maximize the experimental outputs prior to the actual experiments.Geochemical modeling is an efficient and effective tool to assist the experimental design by virtually running all scenarios of interest for the studied system and predicting the experimental outcomes.Here we demonstrated an example of geochemical modeling assisted experimental design of coupled labradorite dissolution and calcite and clayey mineral precipitation using multiple isotope tracers.In this study,labradorite (plagioclase) was chosen as the reactant because it is both a major component and one of the most reactive minerals in basalt.Following our isotope doping studies of single minerals in the last ten years,initial solutions in the simulations were doped with multiple isotopes (e.g.,Ca and Si).Geochemical modeling results show that the use of isotope tracers gives us orders of magnitude more sensitivity than the conventional method based on concentrations and allows us to decouple dissolution and precipitation reactions at near-equilibrium condition.The simulations suggest that the precise unidirectional dissolution rates can inform us which rate laws plagioclase dissolution has followed.Calcite precipitation occurred at near-equilibrium and the multiple isotope tracer experiments would provide near-equilibrium precipitation rates,which was a challenge for the conventional concentration-based experiments.In addition,whether the precipitation of clayey phases is the rate-limiting step in some multi-mineral systems will be revealed.Overall,the modeling results of multimineral reaction kinetics will improve the understanding of the coupled dissolution–precipitation in the multi-mineral systems and the quality of geochemical modeling prediction of CO2 removal and storage efficacy in the basalt systems.
Keywords Kinetics ∙Feldspar ∙Isotope doping ∙Nearequilibrium ∙CO2 sequestration ∙Basalt
1 Introduction
CO2storage in mafic/ultramafic rock reservoirs such as basalt and olivine is an efficient strategy for mitigating anthropogenic carbon emissions through in-situ geochemical reactions(Xiong and Giammar 2014;Raza et al.2022;Chen et al.2023).Our current knowledge of geochemical kinetics is largely based on single mineral dissolution rates far from equilibrium such as the kinetics parameter databases by U.S.Geological Survey (Palandri and Kharaka 2004),Marini(Marini 2007),CO2CRC(Black et al.2015),French Geological Survey (Marty et al.2015) and French National Centre for Scientific Research (CNRS) (Herˇ-manska´ et al.2022,2023).Only a limited amount of nearequilibrium reaction rate and precipitation rate data are available(Taylor et al.2000;Schott et al.2009).However,the systems that store CO2,e.g.,soils and aquifers,are multi-mineral systems,and the aqueous solutions are predominantly near-equilibrium with respect to the participating minerals (Drever 1997).In short,there is a lack of experimental data on the near-equilibrium,multi-mineral kinetics of such systems (Schott et al.2009;Zhu et al.2020,2021).
Because of the lack of relevant data,most current geochemical models use far-from-equilibrium dissolution rate constants and assume their validity under near-equilibrium conditions for dissolution through ad hoc assumptions of rate laws (Zhu et al.2020).Moreover,these studies also assume that the same extrapolations can be extended to precipitation reactions.The uncertainties in these models are propagated when the geochemical model part is coupled with transport processes (diffusion,dispersion,and advection) in coupled reactive transport models (RTM)(Steefel and MacQuarrie 1996;Steefel et al.2015;Li et al.2017),which are applied to CO2storage in aquifers and soils (Dai et al.2020).Although such studies provide useful insights(Liu et al.2011;Zhang et al.2016;Lu et al.2022),it is still prudent and valuable,for the sake of contributing to the implementation of climate change mitigation strategies,to investigate the geochemical kinetics at near-equilibrium.
Experimental,field,and modeling evidence shows that,in a multi-mineral system,the overall reaction rate in the system is determined by the coupling of dissolution and precipitation reactions (Alekseyev et al.1997;Zhu 2005;Maher et al.2009).The coupling processes can be complex.Zhu et al.hypothesized that the coupling of reactions brings the reacting solutions close to equilibrium with respect to feldspars,which reduces the feldspar dissolution rates via the chemical affinity term in the rate laws and contributes to the apparent discrepancy between lab and field rates(Zhu et al.2004).Daval et al.(2010)showed the reduction of diopside dissolution rates at conditions of near-equilibrium increases the time needed to reach a complete carbonation reaction by a six-fold factor compared to the TST(Transition State Theory)-based rates.For the basalt-CO2-water system,it has been speculated that the slow precipitation of (Ca,Fe,Mg) clay and carbonate minerals could reduce the dissolution rates of the basalt glass and (Ca,Mg,Fe) primary silicates over time (Gysi and Stefa´nsson 2012).The overall reactivity in plagioclaserich compositions can be reduced with the coating of precipitates (clay minerals and iron oxide) on the reactants(Gadikota et al.2020).
Before we can tackle complex multi-mineral systems such as basalt-CO2-water,it is practical to start with a simpler system with a single mineral reactant such as labradorite.Our experience with previous experiments,as well as our review of the literature data,show that even in such single reactant systems,the coupling can be complex and the experimental data can be difficult to interpret if we have major ion data only (i.e.,K,Na,Ca,Mg,Fe,Al,and Si) (Lagache 1976;Alekseyev et al.1997;Fu et al.2009;Lu et al.2015).To fill this knowledge gap,the selected coupled reaction experiments using multiple isotope tracers will be conducted.The multiple isotope tracer experiments will be based on our successful use of isotope tracers in the single mineral reactant systems(Liu et al.2016;Zhu et al.2016,2021).Before actual experiments,we conduct reaction path simulation to investigate the coupled reaction system in the experiments and assist the design of the experiments.The coupled reaction experiments with isotope doped,are a better way to study near-equilibrium and mineral growth rates than conventional experimental designs.
2 Background and hypotheses
Here we just briefly introduce the necessary background of reaction kinetics.Following the convention,near-equilibrium is defined as the region of ΔrG/RT >-5(Burch et al.1993;Rimstidt 2014),although this definition has the flaw that ΔrG values are related to how the chemical formula for the mineral of interest is written.
For the labradorite dissolution,we can write the reaction as
The rates of labradorite dissolution by convention are based on Si flux,
where r+and r-denote the forward and reverse reaction rates (mol labradorite m-2s-1) defined in Table 1,respectively.The net reaction rate rnet(mol m-2s-1) is also often called the overall rate.υ stands for the stoichiometric coefficient of Si in the silicate mineral of interest,e.g.,2.4 for labradorite.SA(m2/L) stands for the reactive surface area (Helgeson et al.1984) or the concentration of the reactive surface sites (Stumm 1992).However,in practice,these properties are currently inaccessible,and SAis approximated by either the Braunauer-Emmett-Teller (BET) (Brunauer et al.1938) or geometric surface area (Lasaga 1998).
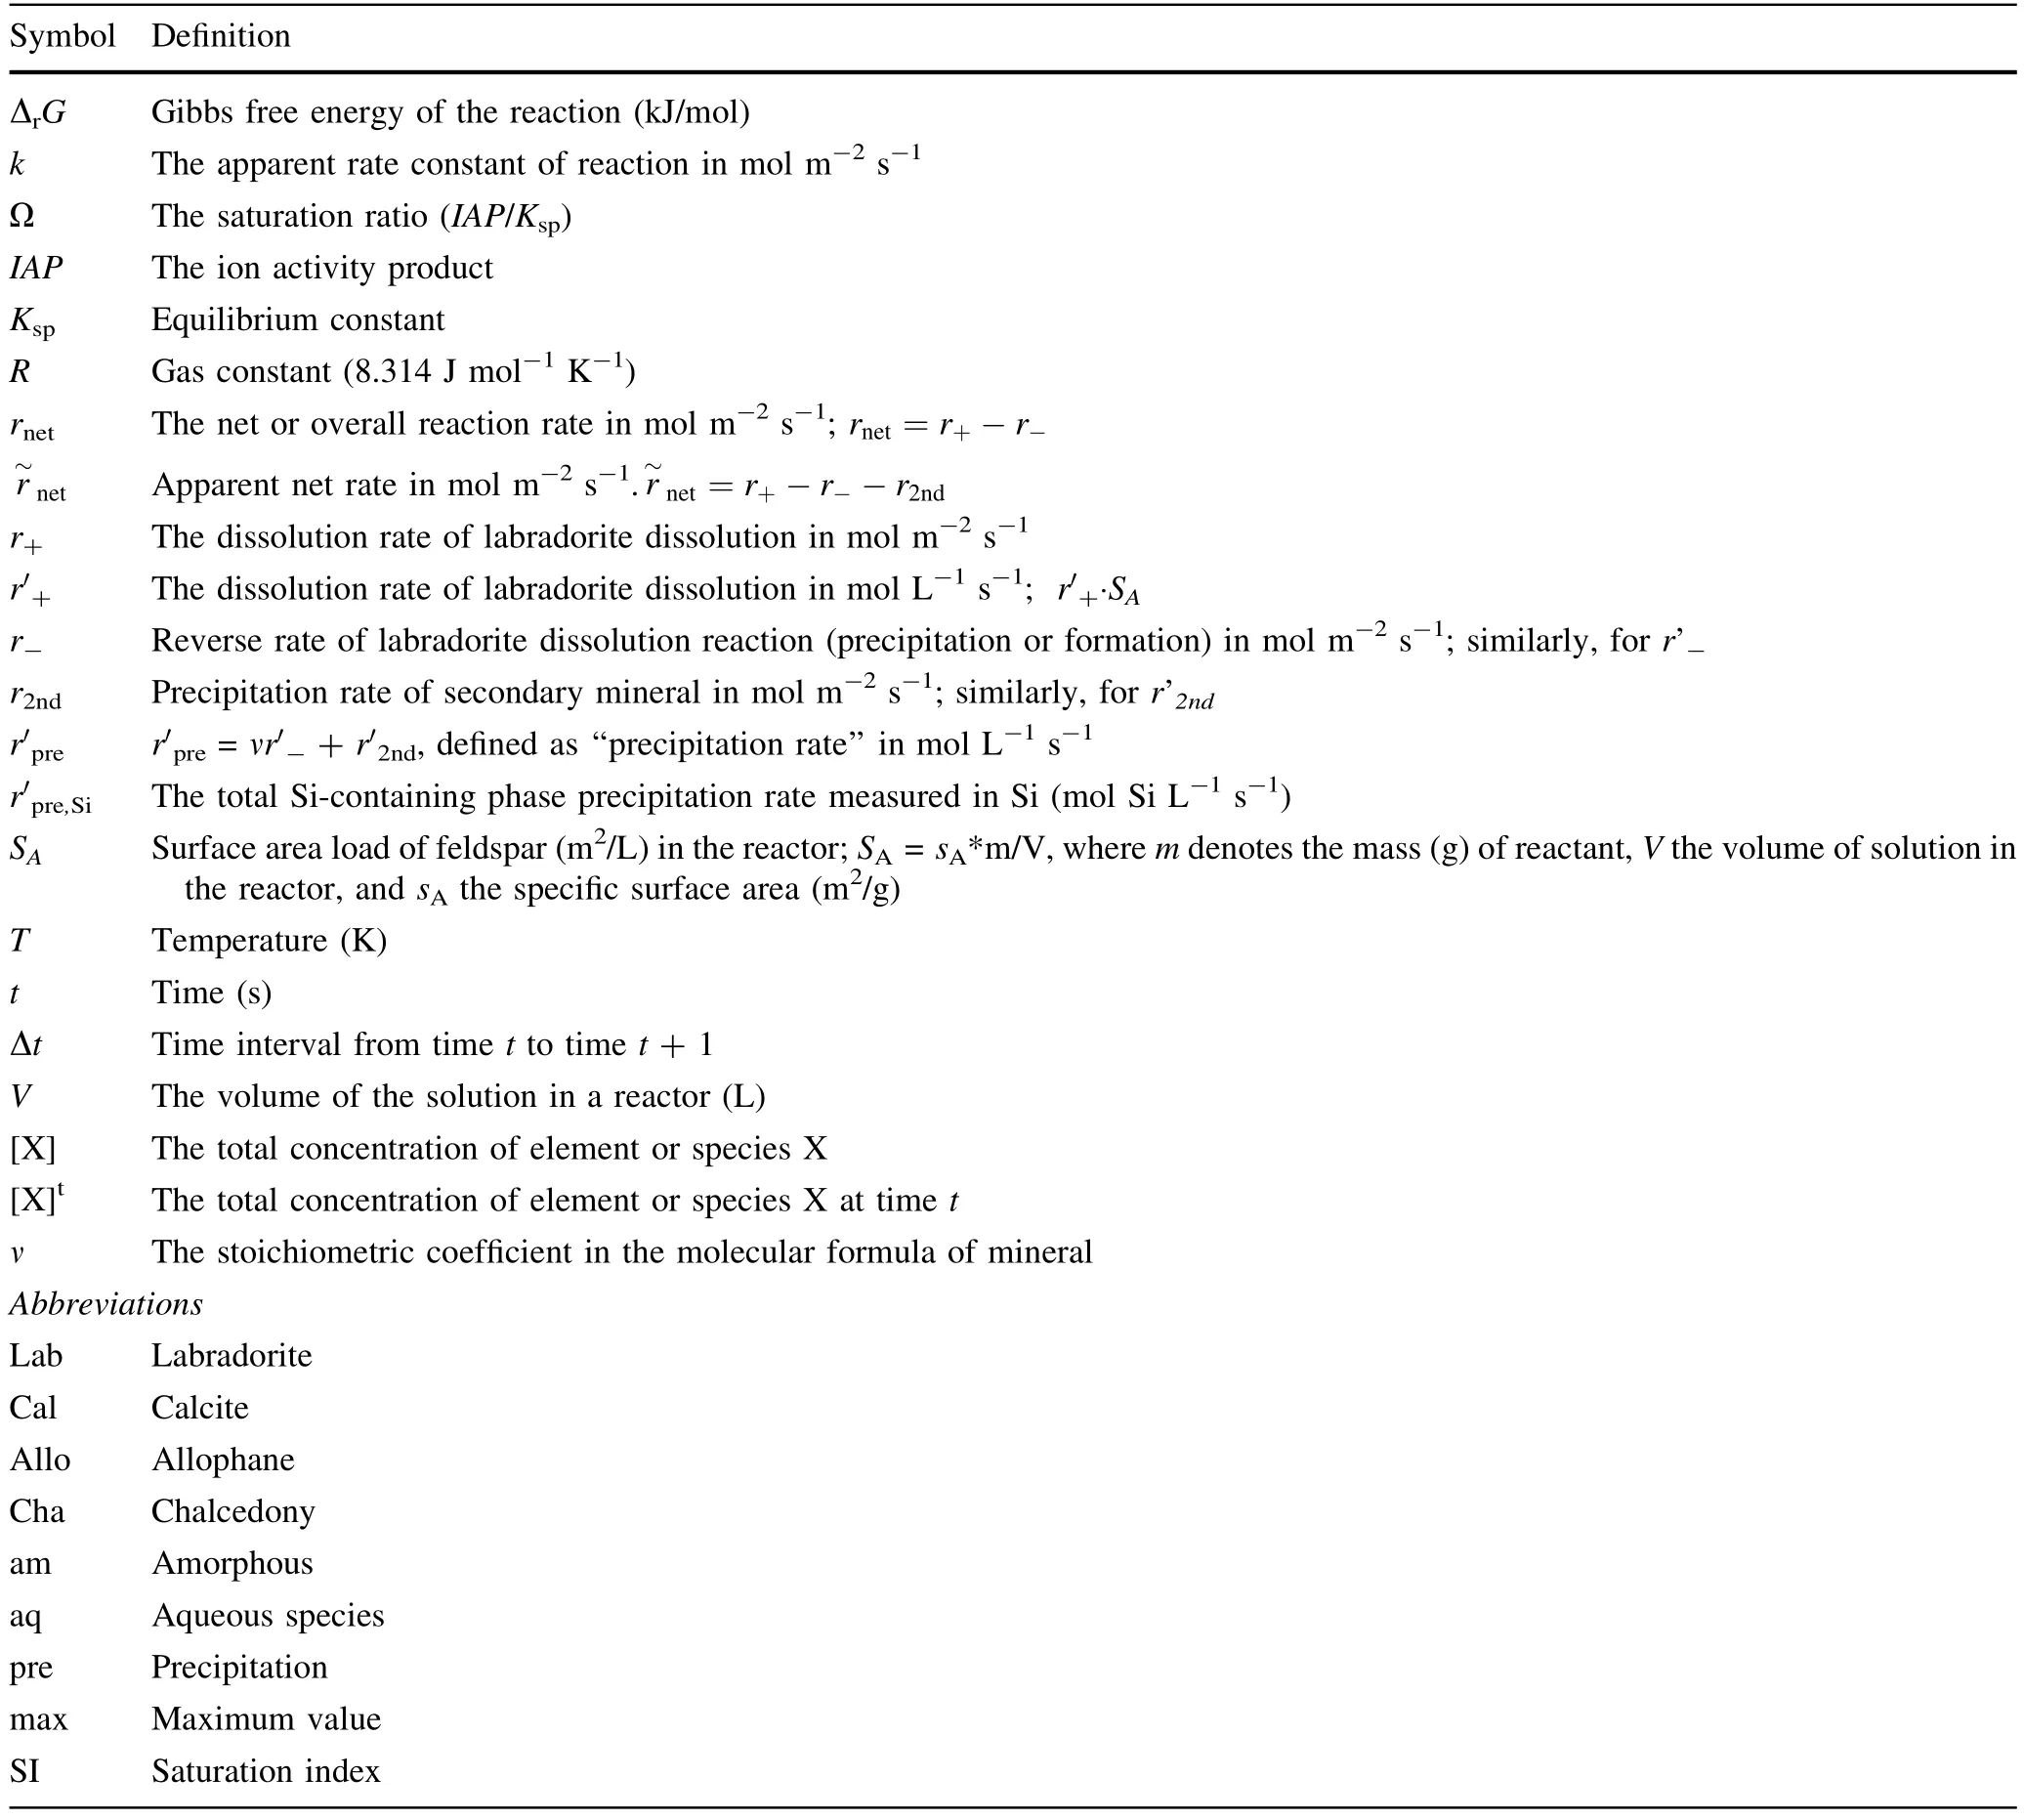
Table 1 List of symbols and definitions
Theoretically,when a system approaches equilibrium,the thermodynamic drive diminishes,and the net reaction rate decreases.rnetis a function of ΔrG for an elementary reaction in accordance with the Principle of Detailed Balance if the forward and reverse reactions have the same mechanisms (Ohlin et al.2009;Liu et al.2016),
If Eq.(3) holds,r+should be independent of ΔrG;rrises exponentially in the near-equilibrium region;rnethas a ‘‘plateau’’ at the far-from-equilibrium region but decreases exponentially when the experimental solutions approach equilibrium with respect to labradorite (Fig.1).At equilibrium,rnet=0.In the far-from-equilibrium region,the reverse reaction is negligible,rnet=r+.However,in the near-equilibrium region,the reverse reaction is no longer negligible.The conventional experimental method based on [Si] measures rnet.The effects of the diminishing thermodynamic drive are expressed as reduced net dissolution rates as the system approaches equilibrium.
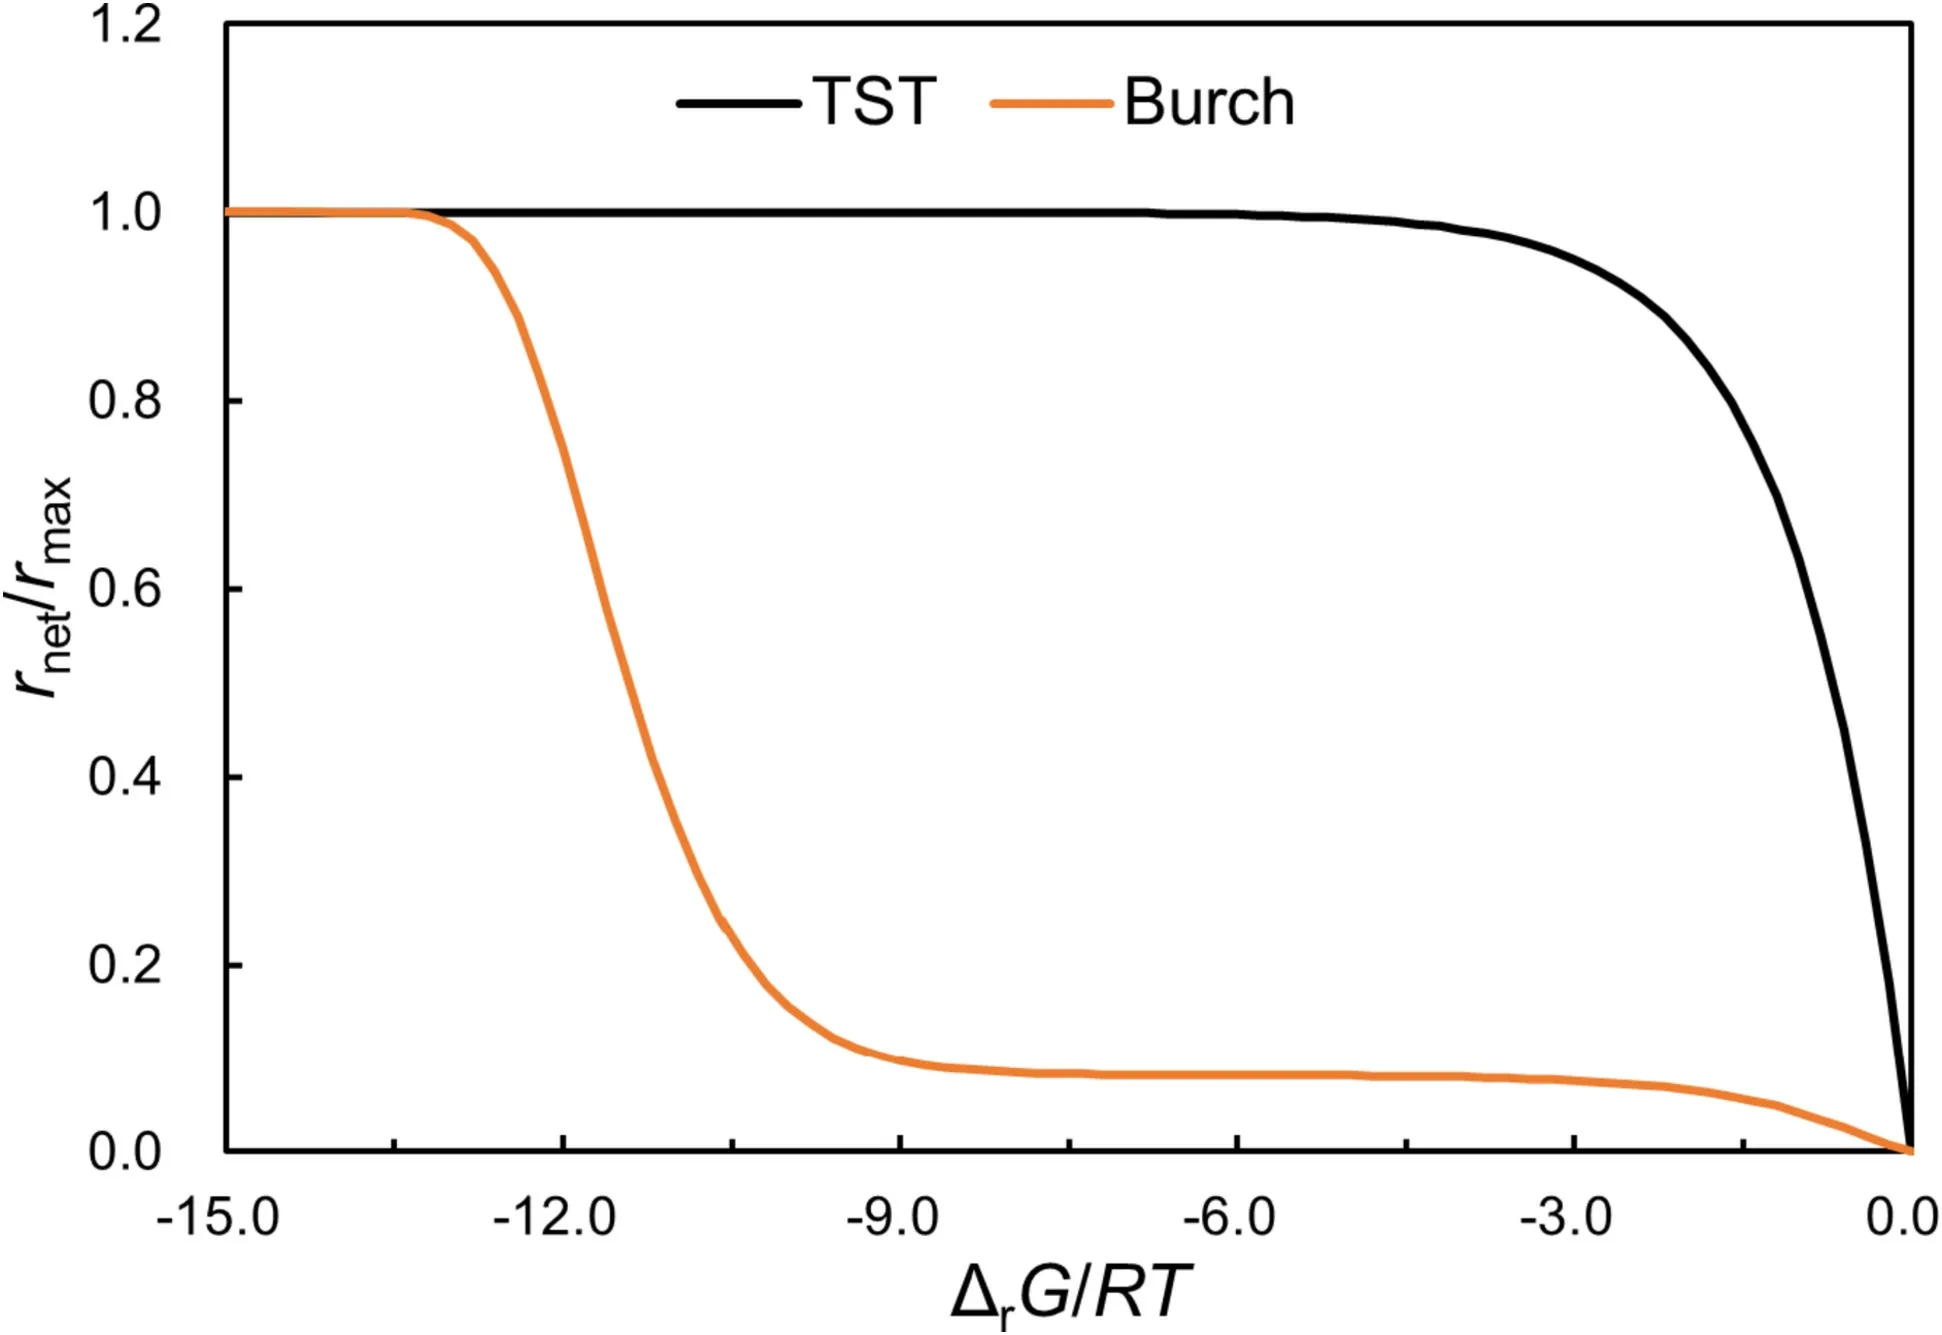
Fig.1 A schematic graph to illustrate the differences among normalized net rates (rnet/rmax) as described by Eqs.(3) and (4).TST stands for‘‘transition state theory’’rate law and Burch stands for the the sum of the rates of two parallel reactions experimentally derived from Burch et al.(1993)
For albite dissolution from far-from-equilibrium to nearequilibrium,Burch et al.investigated the steady-state dissolution rates of albite in aqueous solutions at 80 °C and pH 8.8 as a function of solution saturation state expressing by the sum of the rates of two parallel reactions (Burch et al.1993),
where k1and k2denote the rate constants in units of mol m-2s-1,and n,m1,and m2are empirical parameters fitted from the experimental data(Zhu 2009).Taylor et al.(2000)used the empirical rate law from Burch et al.(1993) to interpret their experiments of labradorite dissolution at 25 °C and pH 3.2.Equation (4) suggests two parallel mechanisms that operate separately under far-from-equilibrium and near-equilibrium conditions,respectively(Burch et al.1993;Hellmann and Tisserand 2006).Under far-from-equilibrium condition,dissolution is driven by the nucleation at dislocation outcrops of etch pits that are the source of steps across the surface.Closer to equilibrium and below a critical Gibbs free energy value ΔGcrit,etch pits stop nucleating,and dissolution occurs only at preexisting edges and corners at a much lower rate and becomes more uniform across the crystal surface (Taylor et al.2000).
The dissolution of labradorite could lead to the precipitation of secondary phases(e.g.,calcite and clay minerals)(Carroll and Knauss 2005).To simplify the system,we choose allophane (amorphous silica) to represent all clay precipitation containing Si and Al.
When the Si-bearing secondary phase precipitates,the conventional experimental method based on the concentration analysis measures the apparent net raterather than the ‘‘true’’ net rate (rnet):
where r2ndis the rate sum of Si-containing secondary phases such as allophane and chalcedony.Almost all the rate data available in the literature at near-equilibrium are the apparent net rate,unless it could be verified that no Si-containing secondary phases were precipitated.However,it is a broad challenge to verify possible secondary phase precipitation.The same challenge exists for the mass balance analysis from Ca perspective when calcite precipitates.
Generally,the TST-derived rate equation has been used for modeling mineral precipitation with parameters obtained from far-from-equilibrium dissolution rate experiments (Palandri and Kharaka 2004;Marty et al.2015).For modeling secondary carbonate mineral growth,the BCF (Burton,Cabrera,and Frank) equation is recommended for net precipitation due to better representation with the non-linear part of the BCF model (Burton et al.1951;Pham et al.2011),
where kBCFis the rate constant that could be calculated using the same way as the TST model in order to explain the effect of different affinity terms,and Ω is the saturation ratio (IAP/Ksp).According to the BCF crystal growth theory (Burton et al.1951),n=2 stands for spiral growth of screw dislocation.
The labradorite dissolution and secondary mineral precipitation reactions can be coupled.The overall reaction can be written as
However,how these reactions are coupled is still unknown.We intend to conduct reaction path modeling to illustrate the possible coupled scenarios and to design experiments to test the following hypotheses about reaction coupling.
Hypothesis 1 The isotope-doped experiments will generate unidirectional rates of labradorite dissolution from far-from-equilibrium to near-equilibrium with higher precision and accuracy.Whether labradorite dissolution follows TST or Burch-type rate law will be discernable.
Our previous study showed Si isotope tracer experiments provide unidirectional rates of feldspar dissolution(r+) (Zhu et al.2020).r+is constant across solution saturation states if the reaction mechanism or reactive surface area does not change.In contrast,if r+decreases dramatically from far-from-equilibrium to near-equilibrium,it indicates the reaction mechanism switch occurs.In this study,we designed the multi-isotope doped experiments aided by reaction path modeling to measure r~netdirectly.This constitutes a more direct test of the dissolution mechanism hypothesis.
Hypothesis 2 The coupled dissolution and precipitation experiments will generate calcite precipitation rates at near-equilibrium,which is still measurable with isotope ratios.
There are few calcite growth experiments near calcite equilibrium (Xu et al.2010).During our coupled reaction modeling,the chemical compositions of the initial solution are saturated with respect to calcite,thus labradorite dissolution and calcite precipitation occur simultaneously.Calcite precipitation rates at near-equilibrium can be calculated directly based on the Ca mass balance equation,which is aided by the unidirectional labradorite (Ca contributor) dissolution rate based on the29Si/28Si ratios.Hypothesis 3 Calcite precipitation is so fast that simulation results show no difference whether to assume local equilibrium or kinetics or different rate laws in the models.
Because only a few experimental precipitation rates are available,the precipitation kinetic model is often extended from the dissolution model with the assumption of the Principle of Detailed Balance (Liu et al.2016).At nearequilibrium condition,calcite maybe in local equilibrium with the aqueous solution,indicating that calcite precipitation is fast enough.For this coupled experiments and modeling based on a single mineral reactant,we could explain the effect of different affinity term-based rate laws on calcite precipitation.
3 Experimental and modeling designs
3.1 Multiple isotope tracer experimental design
We designed the multi-isotope doped experiments with a single reactant labradorite,one of the major crystalline mineral phases of basalt(Gudbrandsson et al.2011;Wolff-Boenisch et al.2011).In order to model the batch reaction experiments in the laboratory,the parameters of the initial solution of Experiment C were simplified from the conditions of the CarbFix project (Snæbjo¨rnsdo´ttir et al.2017)where CO2was injected into the basalt reservoir.The injected fluid of Phase I of the CarbFix project has a pH of 3.85 and dissolved inorganic carbon (DIC) of 0.823 mol/kgw.The calculated log PCO2ranges from -4 to -2 and the temperature range is 20–50 °C.Our models are designed to mimic these conditions.The temperature of 60 °C was selected to expedite the reaction progress.The stabilized pH is around 8.5 in the reservoir away from the injection well for the CarbFix project (Galeczka et al.2022).Reaction path modeling of in-situ mineralization of CO2at the CarbFix site indicates that zeolites and smectites will start to form at high pH (Snæbjo¨rnsdo´ttir et al.2018).
The preparation of the isotope-doped initial solutions follows our earlier works (Zhu et al.2016,2020,2021).The initial solution is prepared by dissolving a certain amount of KHCO3and CaCl2.29Si and43Ca stock solutions are added into the initial solution to form the isotope difference between the labradorite solid and the aqueous solution.The dissolution rates of labradorite (Si and Ca release rate)are therefore defined.The amounts of KHCO3,CaCl2,29SiO2stock solution,43CaCl2stock solution,and DI water are recorded.In order to ensure that pH is 8.5 at 60 °C,the solution pH is rapidly adjusted to 7.0 at 22 °C to avoid CO2loss by adding a small amount of HCl or KOH.According to the results of equilibrium modeling,the initial solution is adjusted to the equilibrium with calcite using CaCl2.0.4500 (± 0.001) g of labradorite and 45 g(i.e.,~45 mL) initial solution are mixed in a 50-mL polypropylene bottle to initiate mineral dissolution.0.0045 g calcite powders(53–105 μm)are added to each bottle asseeds to facilitate the calcite growth.The bottles are sealed with plastic wrap and heated to 60 ± 0.5 °C using a water bath for the duration of the experiment.In addition,we designed Experiment D to explain the effect of activity ratio [Ca2+]/[CO32-] and low HCO3-on the coupled system.The initial solution parameters for the two experiments are summarized in Table 2.
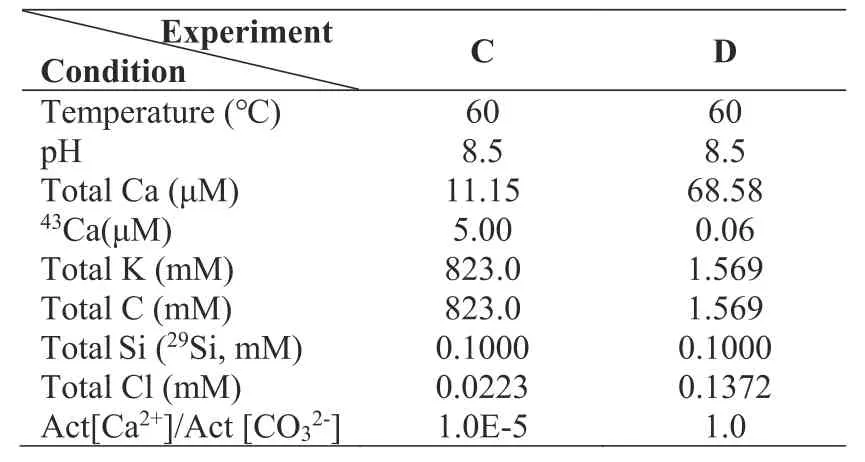
Table 2 Chemical composition of the initial solutions
3.2 Interpretation of experimental data
After the experiments,the solutions are filtered with 0.22 mm nitrocellulose membrane filter paper.The concentrations of K,Ca,Si,Al,and Na are analyzed by ICP-OES.The alkalinity is measured using an auto-titrator by HCl titration.The Si and Ca isotope ratios are measured using high-resolution multiple-collector inductively coupled plasma mass spectrometry (MC-ICP-MS).It is noted that all solution samples for measuring Si isotopes will be purified by cation exchange chromatography to reduce the disturbance from other cations (Georg et al.2006).BET surface areas of labradorite and calcite seeds are measured via low pressure N2adsorption measurement before the experiments (Thommes et al.2015).
As we described in the background,r~netcan be calculated based on the evolution of Si and Ca concentrations.Our previous work shows that the dissolution rate r+can bemeasured while Si precipitation occurs (Zhu et al.2016).The unidirectional dissolution rate for labradorite can be derived from Si and Ca mass balance with the aid of Si and Ca isotope ratios.Details about the calculation procedure are described in our previous studies (Zhu et al.2016,2021).It is noted that Si and Ca isotope fractionation due to dissolution and precipitation are negligible (Zhu et al.2016;Harrison et al.2023).The unidirectional dissolution rates (r+) are best fitted by solving the mass balance equations for Si concentrations and Si isotopes for any time interval from t to t+1 assuming the rates of labradorite dissolution and secondary mineral precipitation are constant,
where the only unknowns are the dissolution rate r′+and precipitation rate of the Si-containing phase r′pre,Si,r′+and r′pre,Siare defined in Table 1.Here,we choose28Si and29Si mass equations to dissolve it.
For Ca concentrations and Ca isotopes,the calculation procedure is conducted using the same way:
where the only unknowns are the dissolution rate r′+and the calcite precipitation rate r′Cal.It is possible to determine the Ca and Si derived unidirectional dissolution rates of labradorite.In addition,the calcite precipitation rate r′Calcan be calculated based on the Si-derived unidirectional dissolution rate,even if the variation of Ca isotope could not be detected.
3.3 Reaction path modeling
To investigate the coupled reaction process and test the validity of experimental designs,reaction path simulations were calculated with the software PHREEQC 3.6.4 (Parkhurst and Appelo 2013) and the database EWR_Mafic.dat developed by our team.The general rate equation based on the transition state theory (TST) was given (Lasaga 1981),
where kris the rate constant,Akis the Arrhenius pre-exponential factor (mol m-2s-1),Eais the activation energy(J mol-1),T is the temperature(K),R is the gas constant,aiis the aqueous species activity,the exponent’s nirepresents the reaction order with respect to species ai,Ω is the saturation ratio (IAP/Ksp),and p and q are the empirical parameters describing the saturation dependence.
The simulations were divided into two series of batch simulations based on the experimental design (Experiment C and D) including Model C and Model D,respectively(Table 3).The concentrations of solutes reported from the experimental design (Table 2) were used for the initial solution of the input file.The amount of dissolved and precipitated phases and the chemical compositions of the aqueous solution were calculated.Kinetic model parameters describing the dissolution and precipitation rates are summarized in Table 4.The base cases Model C0 and D0 use the TST rate laws for all the primary and secondary minerals.The local equilibrium models for calcite (Model C2 and D2) and chalcedony and allophane (Model C4 and D4) were built to explore the effect of local equilibrium.Meanwhile,the corresponding mineral seeds (0.001 mol)were introduced for local equilibrium to maintain the saturation state.
Different kinetic dissolution models were used for labradorite in Model C1 and D1 to evaluate the effect of dissolution mechanism switch from far-from-equilibrium to near-equilibrium.The kinetic formula from Taylor et al.(2000) showed the non-convergence and unstable properties,resulting in the interruption of model running.Therefore,we choose the rate law formula from Burch et al.(1993) for labradorite to account for these two parallel mechanisms,due to the similar pH of the experiments in Burch et al.(1993)and this study.The affinity term from the albite research was used (Eq.(8),k1/k2=11.2,n=8.40 × 10-17,m1=15,m2=1.45),however,the rate constant k1was calculated using the same calculated values with that of Model C0 and D0.In addition,we also conducted Model C3 and D3 to explain the effects of different affinity terms with calcite on the coupled reaction.These different kinetic models or local equilibrium can be easily implemented with minor modifications in the data block of input files.
In order to illustrate the evolution of isotope during the coupled reaction process,we calculated the isotope concentration and ratio based on the incremental dissolution and precipitation amount in the modeling results.The mass balance equations for isotope Si and Ca are extended from Eqs.(11) and (12):
where i=28,29 and 30,j=40,42,43 and 44,and the natural abundance of Si and Ca refers to the previous study(Berglund and Wieser 2011).
4 Modeling results
4.1 Effects of different rate laws for labradorite
Figure 2 showed distinct differences between the modeling results from Model C0 using TST dissolution kinetics for labradorite and Model C1 based on the Bruch model.For Model C0,Si and Na concentrations increased due to labradorite dissolution,while Ca concentration kept constant due to the coupled labradorite dissolution-calcite precipitation.After about 5 days,the Al concentration slightly decreased,indicating the precipitation of the secondary phase sinks more Al than the release amount from labradorite dissolution.The saturation index of labradorite increased from -5.5 to -1.0 during the first 5 days and approached 0 for the remaining reaction periods,indicating the labradorite dissolution varied from far-from-equilibrium to near-equilibrium.The aqueous solution was supersaturated with respect to allophane and near-equilibrium for chalcedony.However,no chalcedony precipitation occurred.The amount of calcite precipitation increased continuously while the saturation index of calcite was always about 0.002,which indicates that calcite precipitation occurred at near equilibrium.Due to the slower labradorite dissolution kinetics of the Burch model(Model C1) than that of TST-based Model C0,the amounts of labradorite dissolution and calcite and allophane precipitation were dramatically smaller in Model C1 than those in Model C0 (Fig.1c).
The concentration variations of ions were not large enough to distinguish considering the measurement error and uncertainty.However,Fig.2d showed the evolution of Si isotope ratios for Model C0 and C1 were significantly different and the differences are measurable.Due to the faster dissolution of labradorite using the TST rate law,more Si and Ca were released from the labradorite for Model C0 than those for Model C1.Therefore,Si and Ca isotope ratios (29Si/28Si) and Ca (43Ca/42Ca) decreased faster for Model C0,especially Ca isotope ratios decreased sharply and then remained constant after 10 days.The unidirectional dissolution rate of labradorite can be derived from the Si isotope ratios and Si concentration based on mass balance Eq.(11).The effect of Si isotope fractionation can be ignored,because the errors in rate determination resulting from Si isotope fractionation are ≤ ± 0.04%(Zhu et al.2016).Therefore,the modeling results suggested the isotope-doped experimental design allows the acquisition of unidirectional rates of labradorite dissolution from far-from-equilibrium to near-equilibrium with high precision and accuracy,which can in turn inform which rate laws that plagioclase dissolution has followed.
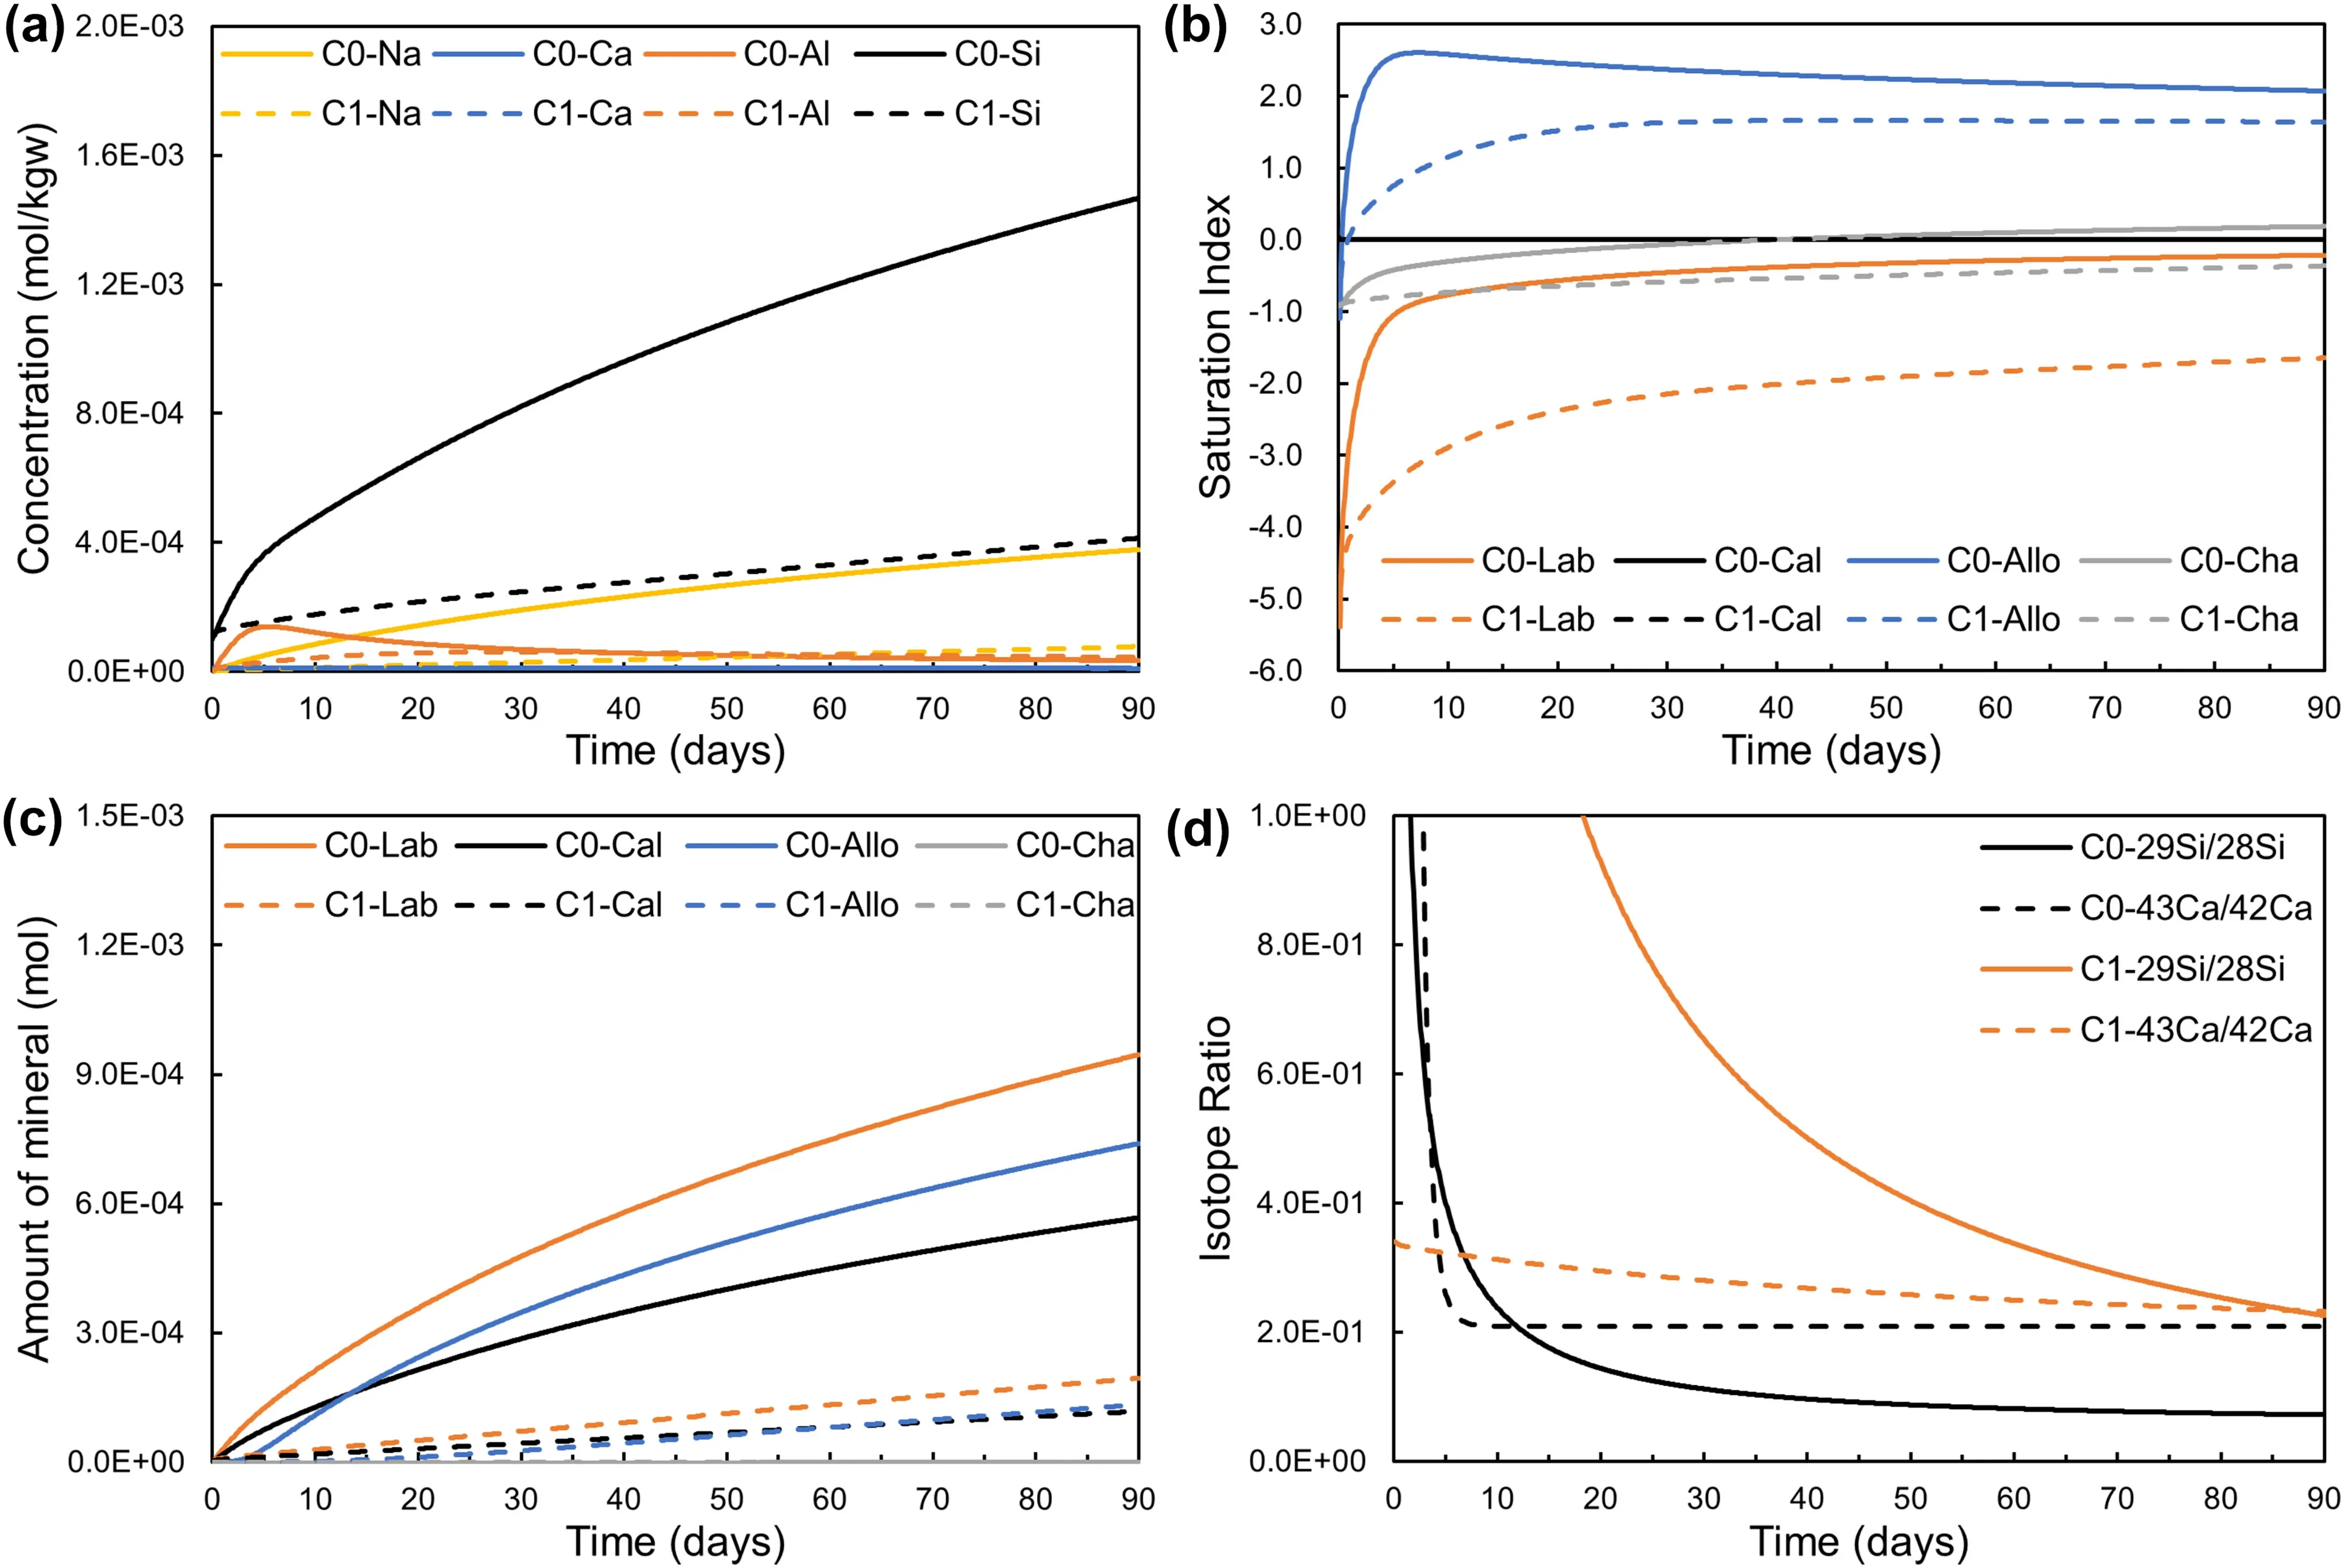
Fig.2 Temporal evolution of solution chemistry and isotopes from different labradorite dissolution kinetic models[TST(C0)and Burch(C1)]for Model C.a Concentrations of aqueous species.b Saturation indexes of minerals.c Amount of labradorite dissolution and secondary precipitation.d Isotope ratios of Si (29Si/28Si) and Ca (43Ca/42Ca).The abbreviation of minerals refers to Table 1

Fig.3 Temporal evolution of solution chemistry and isotopes from different labradorite dissolution kinetic models[TST(D0)and Burch(D1)]for Model D.a Concentrations of aqueous species.b Saturation indexes of minerals.c Amount of labradorite dissolution and secondary precipitation.d Isotope ratios of Si (29Si/28Si) and Ca (43Ca/42Ca).The abbreviation of minerals refers to Table 1
The calcite precipitation equation shows that the calcite precipitation rate constant depends on the bicarbonate concentration (Eq.5) and Table 4).With a lower concentration of HCO3-and the activity ratio [Ca2+]/[CO32-]approaching 1.0,Model D0 and D1 show lower reaction rates and mass transfer amounts compared with Model C0 and C1 in Figs.3.Figure 3b demonstrated the aqueous solutions in the coupled system stayed very close to equilibrium with respect to labradorite after 0.2 days and 10 days for Model D0 and D1,respectively.Labradorite continued to dissolve,and the secondary phases (calcite and allophane) continued to precipitate until all labradorites were exhausted.In short,if the labradorite dissolution followed the Burch rate law,the mass transfer rate of the coupled reaction system would decrease at least one order of magnitude regardless of the initial conditions from Model C and D.This indicates the coupled system is labradorite dissolution controlled.
4.2 Calcite precipitation rates at near-equilibrium
Labradorite dissolution and calcite precipitation reactions are coupled via the common element Ca in the system.Figures 2b and 3b showed calcite precipitation occurred at near-equilibrium with respect to calcite,whose saturation index was almost zero for Model C0 and D0.The weight percentages and concentrations of labradorite and secondary precipitations were calculated shown in Table 5.After 90 days,approximately 0.01g and 0.003g labradorite was dissolved for Model C0 and D0.Meanwhile,>1.0 wt% calcite and allophane precipitated except for allophane at Model D0,which is enough for the quantitative analysis of minerals based on XRD spectra.In addition,the precipitation could be detected only when the weight percentage >0.1%.The simulation results showed that Ca concentrations decreased little or nearly constant for Model C0 and D0 in Fig.4.The conventional experimental method (i.e.,only measuring time-series Ca concentrations) would fail to determine calcite precipitation rates in such situations.However,Fig.4 showed Si and Ca isotope ratios are much more sensitive than Si and Ca concentrations,respectively.Therefore,we can deduce the calcite precipitation rates at near-equilibrium condition based on the differences between the Ca isotope ratio-based Ca release rate from labradorite dissolution and observed Ca concentrations in the solution.
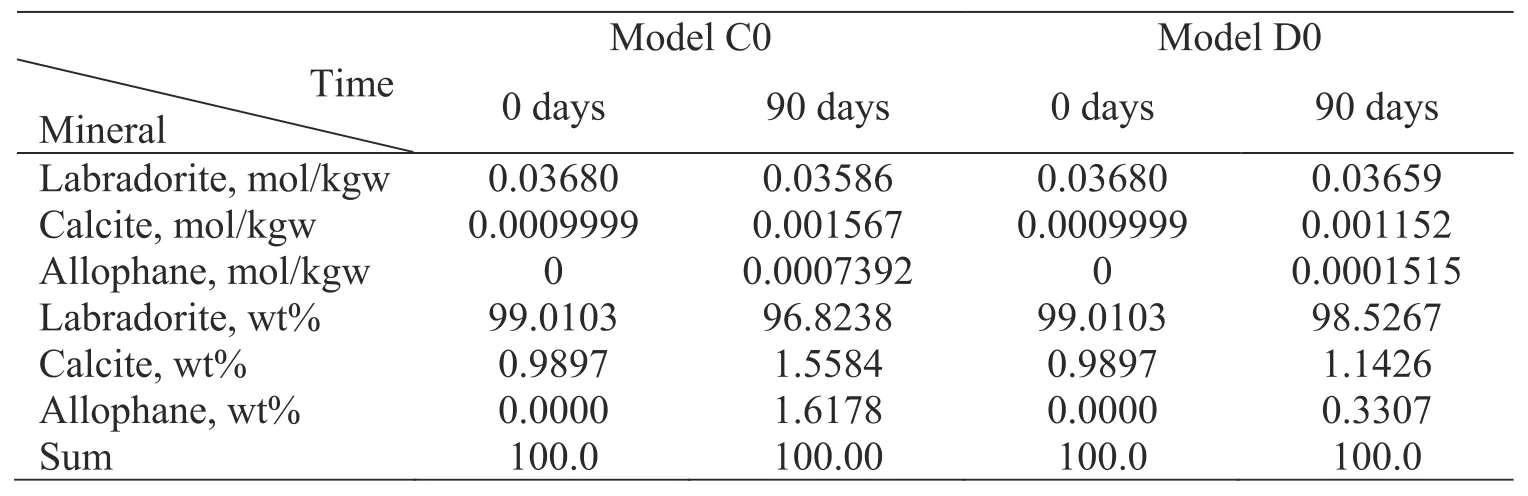
Table 5 Weight percentages and concentrations of labradorite and secondary precipitations before and after reaction

Fig.4 Temporal evolution of Si and Ca concentrations and isotope ratios of Model C0(a)and Model D0(b).Calcite precipitation rates at nearequilibrium can be calculated based on Ca mass balance equation,which is aided by the Ca release rate from labradorite dissolution based on the 29Si/28Si ratios.The abbreviation of mineral names refers to Table 1
When the variations of Ca isotope ratios are not detectably large,the unidirectional labradorite dissolution rate with time can be calculated based on the temporal evolution of Si isotope ratios if Si and Ca have the proportional release rates from labradorite dissolution.The assumption is that the dissolution of labradorite is stoichiometric after a steady state of dissolution is achieved,meaning that there are 2.4 mol Si and 0.6 mol Ca released for 1 mol labradorite dissolution.Therefore,calcite precipitation rates at near-equilibrium can be calculated based on the Ca mass balance equation,which is aided by the labradorite dissolution based on the29Si/28Si ratio.We will test this assumption with experimental data.Previous experimental results showed Δ44/42Ca=-0.02% for Ca isotope fractionation during calcite with an aqueous solution(Harrison et al.2023),suggesting the effect of Ca isotope fractionation on the rate determination can be neglected.
In addition,Fig.4 showed fast calcite precipitation rates in Model C0 due to high HCO3-concentration.As a consequence,the Ca isotope ratio quickly approached a constant value during the first 5 days and remained constant at 0.208655,which is the same as the natural Ca isotope ratio.The results indicated that the labradorite dissolution and calcite precipitation are locked,and the rate ratio between labradorite and calcite is constant at 1.67.However,the temporal evolution of the Ca isotope ratio was measurable for Model D,because the variations of Ca isotope ratios were less due to the low calcite precipitation rates.Alternatively,the calcite precipitation rates and unidirectional labradorite dissolution rates could also be derived directly based on Ca isotope ratios instead of Si isotope ratios,which complements the measurement of unidirectional labradorite dissolution.
4.3 Local equilibrium vs.kinetics for calcite precipitation
The kinetics of calcite precipitation are significant for accurately illustrating the coupled dissolution and precipitation reaction system and predicting the mass of precipitation (Wolthers et al.2012).Although different kinetic laws (TST and BCF) and local equilibrium were adopted for calcite,the amount of calcite precipitation and rates versus time at near-equilibrium didn’t change,and the calcite saturation index remained constant for Model C and D series in Fig.5a and b.This indicates that calcite precipitation was faster compared to labradorite dissolution and was not the rate-limited reaction in the reaction network.However,Fig.5c showed the difference in the evolution of the isotope ratio was manifest enough for Model C with high HCO3-,resulting from the minor difference of calcite precipitation rates between TST and BCF kinetic model and local equilibrium.There were two different modes of the evolution of Si and Ca isotope ratios,respectively.With redundant29Si and43Ca tracers and proper strength of spiking,distinguishing the differences in Model C0,C2 and C3 from an experimental perspective is feasible based on the measured Si and Ca isotope ratios.
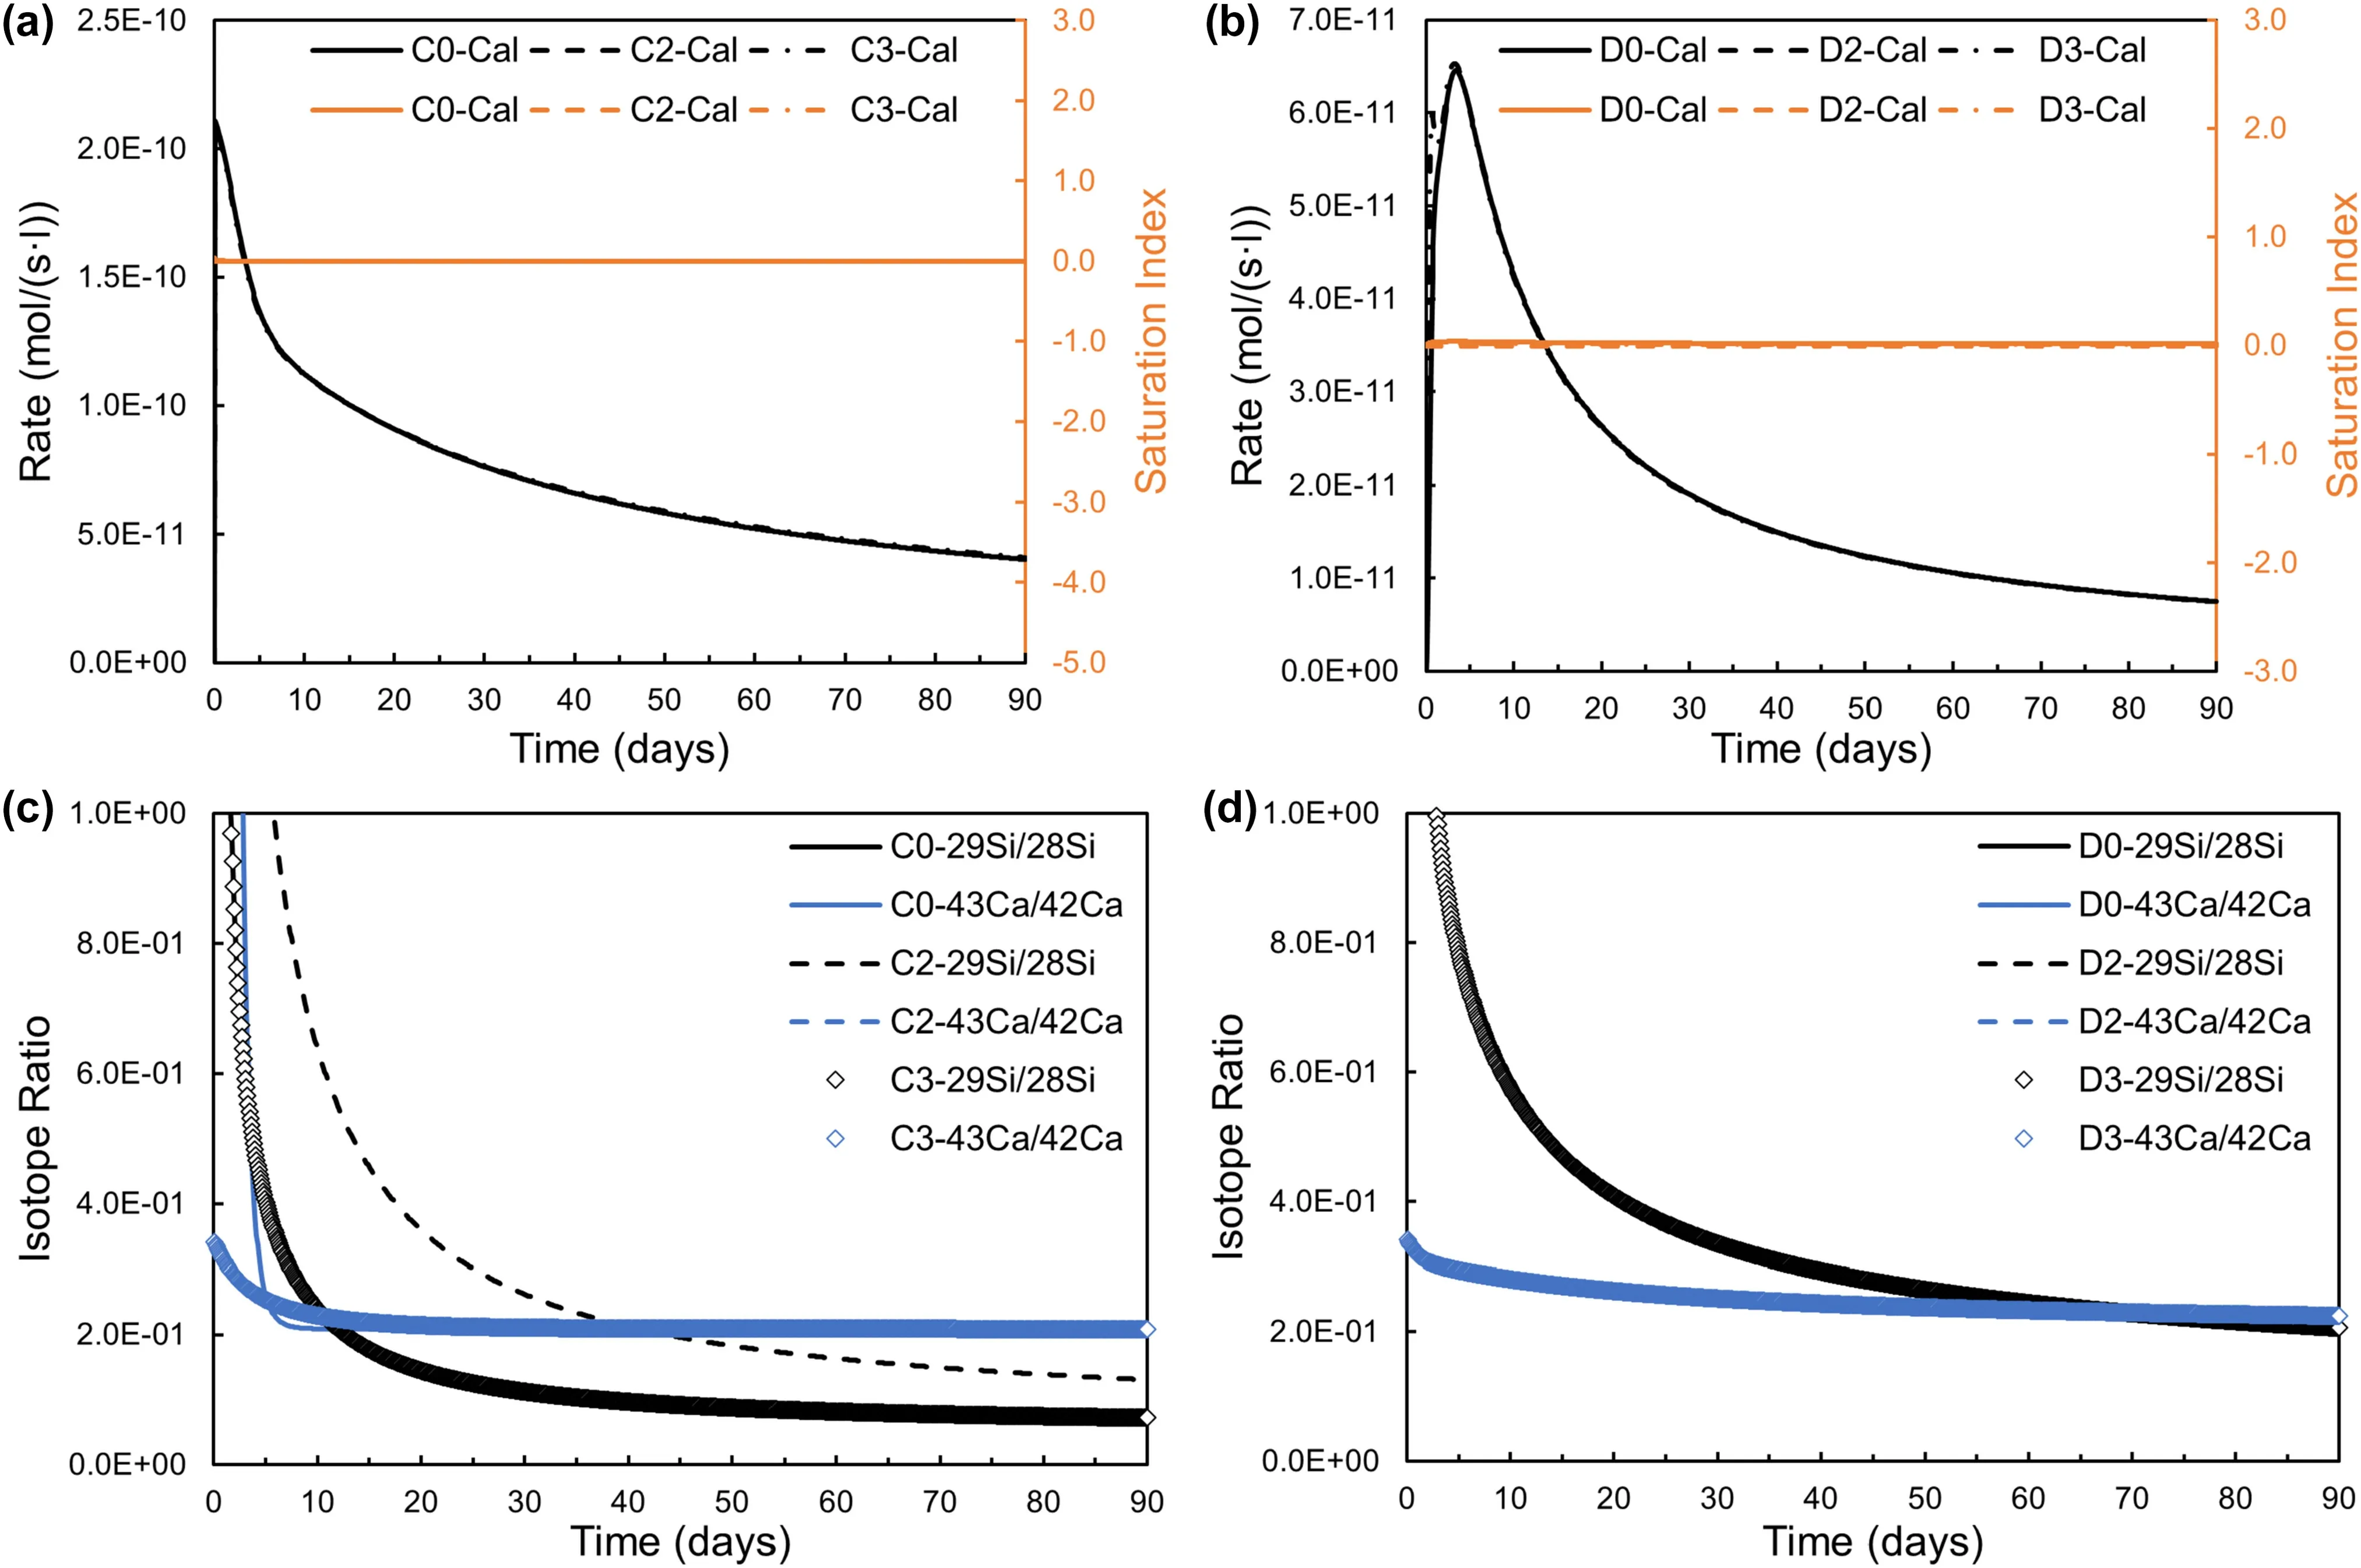
Fig.5 Temporal evolution of calcite precipitation rates and isotope ratios using TST and BCF calcite precipitation kinetic models and the local equilibrium assumption in Model C and D series.Model C series(C0,C2 and C3):a precipitation rates and saturation index for calcite;c Isotope ratios of Si(29Si/28Si)and Ca(43Ca/42Ca).There are two different patterns for the evolution of Si and Ca isotope ratios,respectively.Model D series (D0,D2 and D3): b precipitation rates and saturation index for calcite;d Isotope ratios of Si (29Si/28Si) and Ca (43Ca/42Ca).The abbreviation of mineral names refers to Table 1
Model D4 did not converge due to the low Ca concentration.Thus we just focused on Model C4 to explain the effect of the local equilibrium assumption for allophane and chalcedony.Assuming that the local equilibrium between the solution and allophane and chalcedony,Fig.6a showed Si concentration increased sharply from 0.1 mM to 0.95 mM at the beginning.This was because the chalcedony seeds (1.0 mmol) dissolved to supply Si and maintained the equilibrium with respect to chalcedony.Therefore,the amount of chalcedony increased from 0.15 mmol,while the amount of allophane increased from 1.0 mmol,i.e.,with 1.0 mmol allophane seeds.During the coupled reaction process,Si concentration kept constant,while Al concentration was almost zero during the period of the modeling,which illustrated that all Si and Al released from labradorite dissolution were immobilized through allophane and chalcedony precipitation.
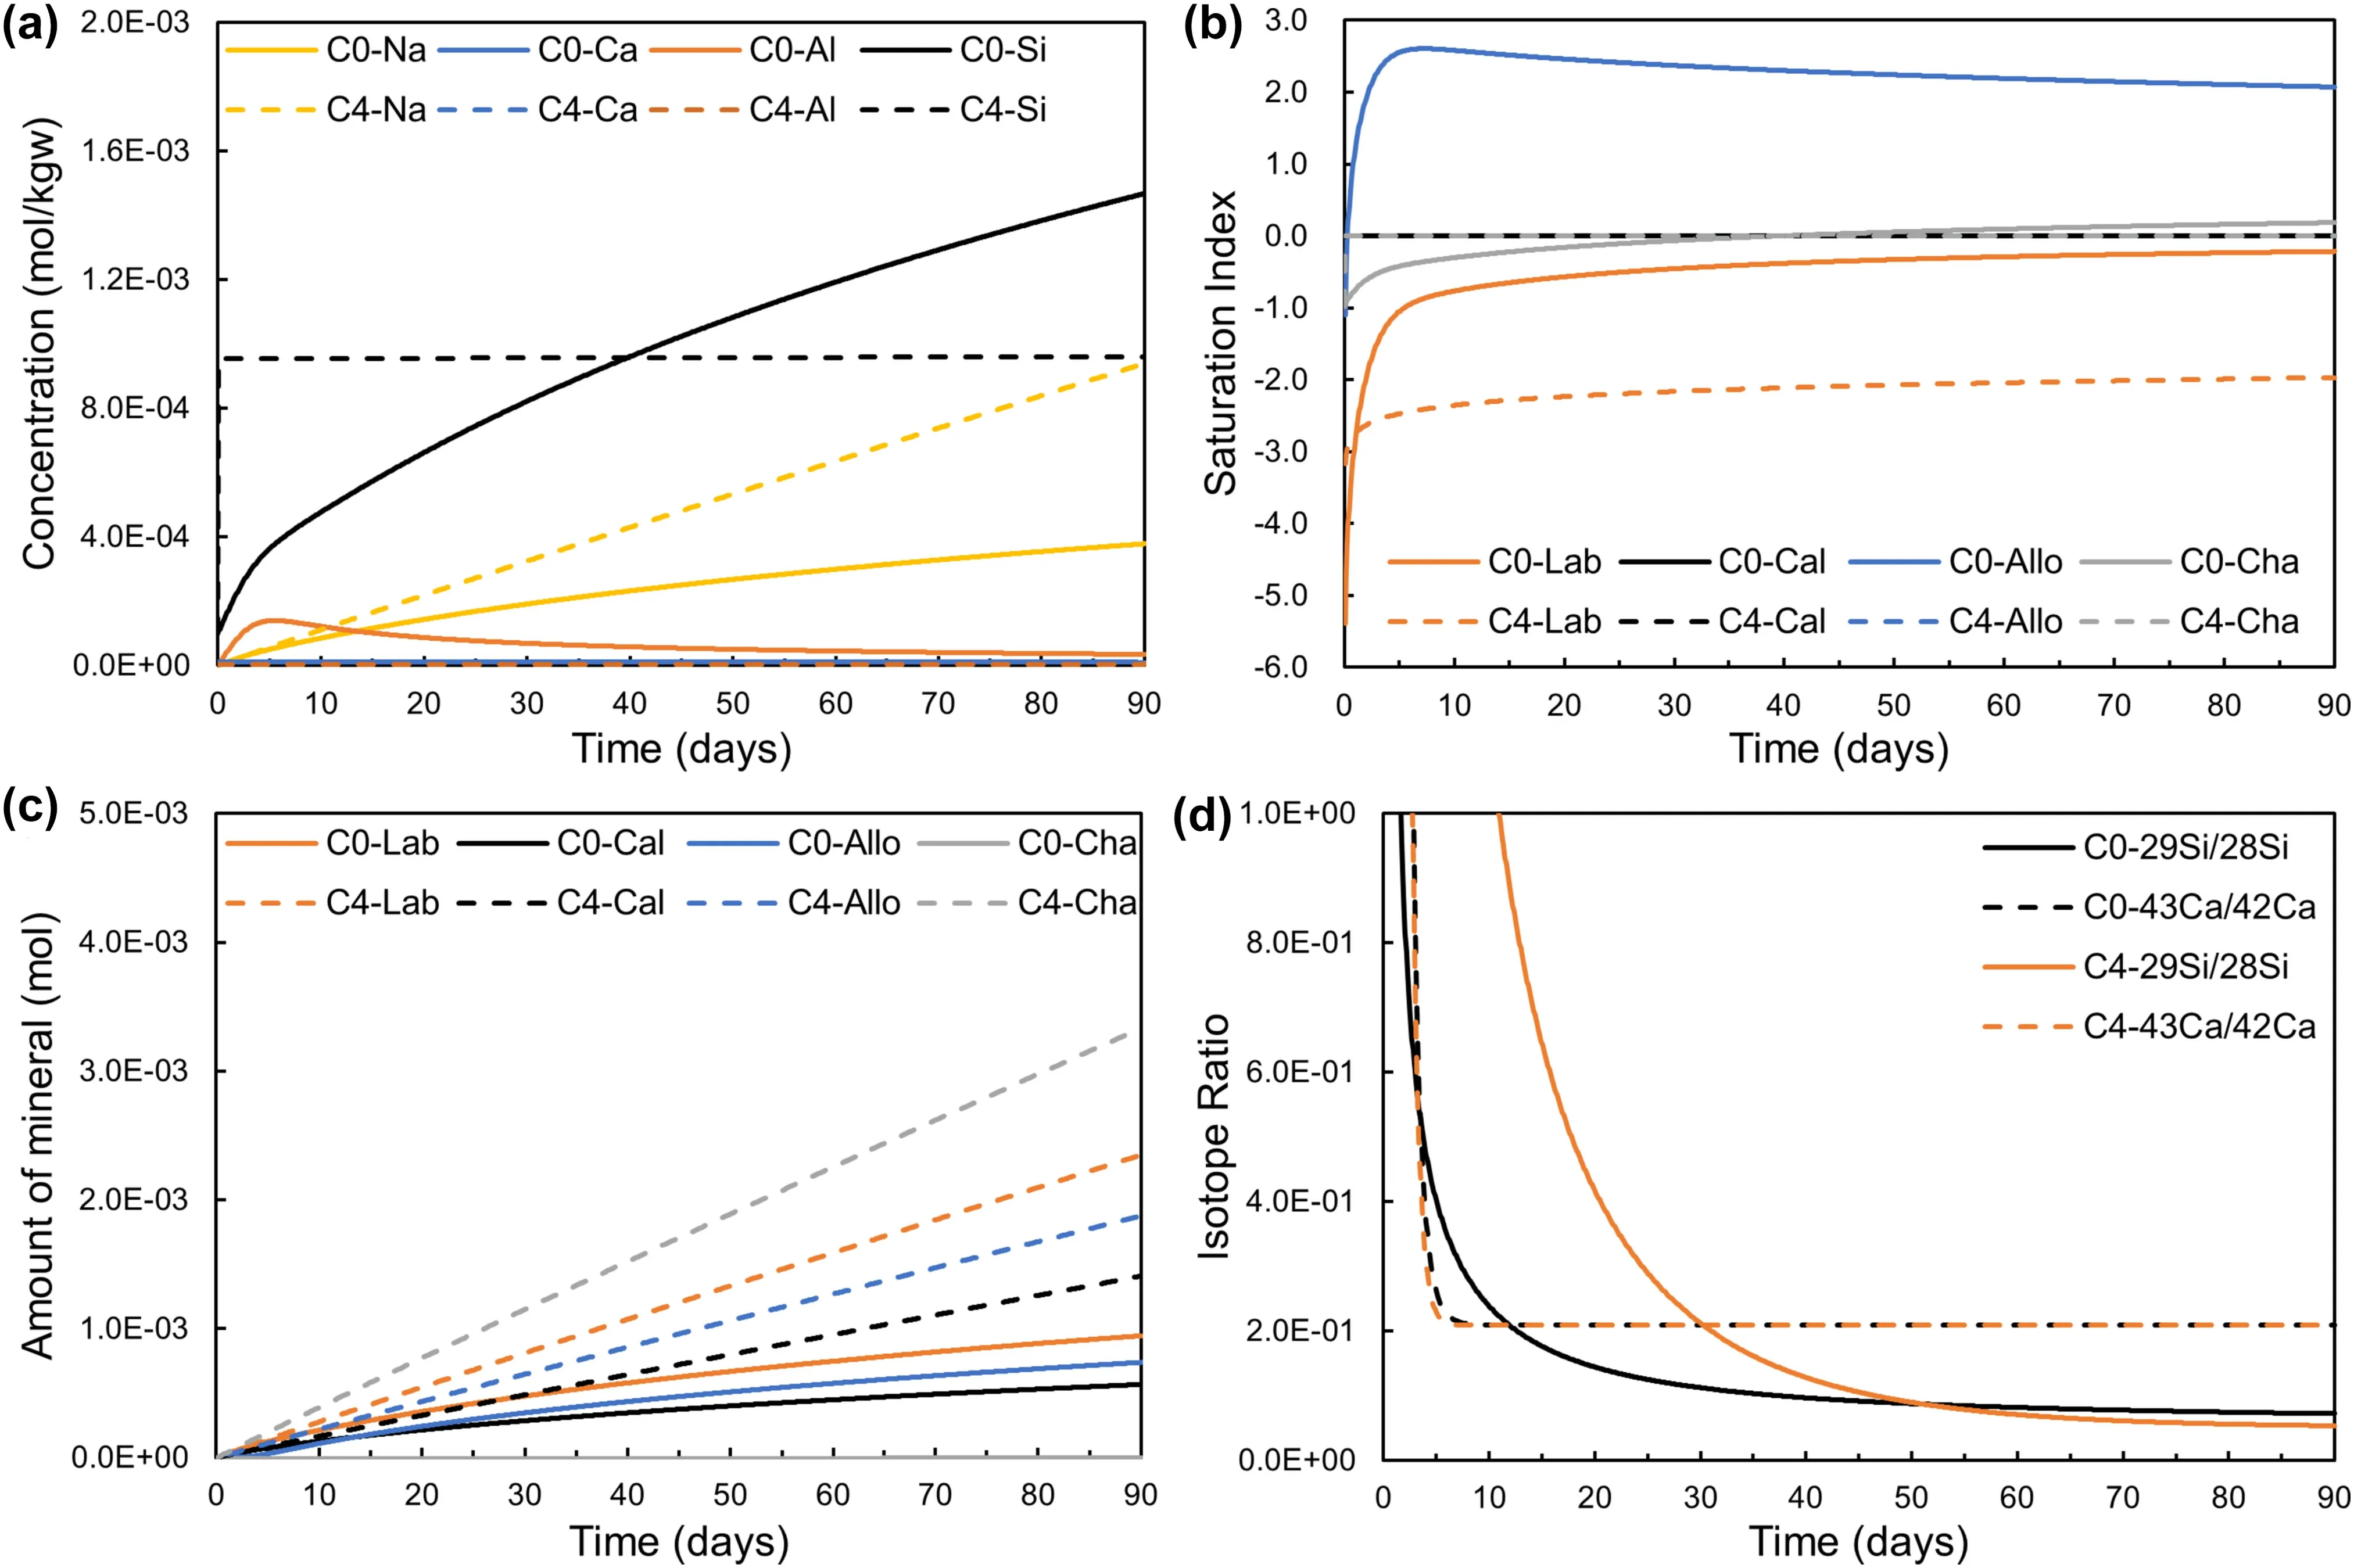
Fig.6 Temporal evolution of the modeled systems with (Model C4) and without (Model C0) the assumption of allophane and chalcedony equilibrium.a Concentrations of aqueous species.b Saturation indexes of minerals.c Amount of mineral dissolution and precipitation.d Isotope ratios of Si (29Si/28Si) and Ca (43Ca/42Ca).The abbreviation of mineral names refers to Table 1
For Model C4,the SI of labradorite was always <-2 during 0–90 days,labradorite dissolved faster and more secondary minerals precipitated in Model C4 compared with Model C0,especially chalcedony (Fig.6b and c).Calcite was always at near-equilibrium,and the labradorite dissolution and calcite precipitation were still locked,even if the local equilibrium between the solution and allophane and chalcedony was assumed.The evolution of Ca isotope ratio supported the above results (Fig.6d).The results indicated that the mass transfer and reaction progress of the coupled system are affected by the local equilibrium of allophane and chalcedony,and the assumption can be tested following the experimental design through multiisotope doped experiments.
5 Discussion
Our reaction path modeling shows that at 60 °C and after 5 days of reaction,the solution chemistry reached the nearequilibrium regime (Figs.2 and 3) with respect to labradorite.An order-of-magnitude reduction in dissolution rates from far-from-equilibrium to near-equilibrium at a pH of~8.5 was observed between Model C0 and C1.The sharp decrease of dissolution rate may account for the one to two orders of magnitude discrepancy between previous laboratory determinations of feldspar dissolution rates (in highly undersaturated solutions) and field-based estimates(in solutions closer to equilibrium) (Zhu and Lu 2013).
Daval et al.(2010)carried out reaction path modeling to evaluate the effects of rate laws(Burch model vs TST rate laws) on diopside and labradorite dissolution and calcite precipitation (Daval et al.2010).Using TST rate law in geochemical models would predict a dramatic overestimation of the carbonation rate than that using the r-ΔGrrelationship recommended by Taylor et al.(2000) and Daval et al.(2010) for labradorite and diopside,respectively.However,Carroll and Knauss (2005) did not observe such a mechanism switch in the labradorite dissolution experiments at 90 °C and pH~3.2.The simulated temporal evolution of isotope ratios versus time(Figs.2d and 3d) suggests that isotope doping is an effective strategy to test whether labradorite dissolution follows TST or Burch-type rate law i.e.,whether there is a dissolution mechanism switch.In our previous work,the unidirectional dissolution rates of albite based on the Si isotope doping suggest the mechanism switch from farfrom-equilibrium to near-equilibrium did not occur under circum-neutral pH in low-temperature systems (Zhu et al.2021).
In terms of calcite precipitation,the modeling results suggest we can derive calcite precipitation rates with multiisotope doping at near-equilibrium.There is little difference between the results of TST and BCF kinetic model and the calcite local equilibrium model except for the isotope ratios (Fig.5).An atomic force microscopic study under near-equilibrium conditions proposes that the calcite precipitation reaction occurs preferentially at the acute–acute kink sites and results in the inconsistencies in etch pit morphology,step anisotropy,and step activation energies with those of studies far-from-equilibrium(Xu et al.2010).Other than instantaneous calcite growth on the calcite seeds,calcite also readily precipitates on the labradorite surfaces without inhibiting its dissolution(Stockmann et al.2014),supporting ultramafic and basalt carbonation as a long-term carbon storage strategy.
6 Conclusions
In this study,we used geochemical modeling to aid the design of a series of isotope tracer-based labradorite dissolution experiments,which intend to decipher how labradorite dissolution and calcite and clayey minerals precipitation reactions are coupled.Geochemical modeling shows that the coupled system evolved from far-fromequilibrium to near-equilibrium conditions after a few days and maintained near-equilibrium until all labradorite was exhausted.The modeling results show that unidirectional labradorite dissolution rates can be obtained at various solution saturation states,which supports the determination of whether the dissolution mechanism of labradorite will change as the system moves from far from equilibrium to near equilibrium.Labradorite dissolution is coupled with calcite precipitation based on the Ca mass balance in the system.With multiple tracers(e.g.,43Ca,29Si),we will also be able to acquire calcite precipitation rates at near-equilibrium.It is inferred from our studies that the coupled system is labradorite dissolution controlled instead of calcite precipitation.In addition,labradorite dissolution rates are dependent on clay minerals (Si and Al) precipitation rates,which affects the coupled dissolution and precipitation process.These modeling results show the promise of implementing these multi-isotope doped experiments to understand the reaction kinetics of multiple mineral systems.
AcknowledgementsCZ’s research is partially supported by U.S.National Science Foundation grants EAR-2221907.Although the work was partly sponsored by agencies of the United States Government,the views and opinions of the authors expressed herein do not necessarily state or reflect those of the United States Government or any agency thereof.Financial support from Dalian University of Technology for MKC as a visiting Ph.D.student is also gratefully acknowledged.
Declarations
Conflict of interestThe authors declare that there is no conflict of interest.
杂志排行

Acta Geochimica的其它文章
- The photosynthetic oxygen evolution does not exclude the important role and contribution of bicarbonate photolysis
- Mafic and felsic magmatism in the Wadi Kalalat area,South Eastern Desert,Egypt:mineralogy,geochemistry and geodynamic evolution during the Neoproterozoic in the Nubian Shield
- The co-transport of Cd(II) and nZnO in saturated soil packed column: effects of ionic strength and pH
- Facies development and sedimentology of the Middle Miocene carbonates of the Raghama Formation,northeastern Saudi Arabia
- Petrogenesis and tectonic implications of the Silurian adakitic granitoids in the eastern segment of the Qilian Orogenic Belt,Northwest China
- Distribution,health and ecological risk assessments of trace elements in Nigerian oil sands