Liquefaction susceptibility and deformation characteristics of saturated coral sandy soils subjected to cyclic loadings - a critical review
2024-02-23ChenGuoxingQinYouMaWeijiaLiangKeWuQiandHseinJuang
Chen Guoxing, Qin You, Ma Weijia, Liang Ke, Wu Qi and C.Hsein Juang
1.Institute of Geotechnical Engineering, Nanjing Tech University, Nanjing 210009, China
2.Civil Engineering and Earthquake Disaster Prevention Center of Jiangsu Province, Nanjing 210009, China
3.School of Mechanical Engineering, Nanjing University of Science and Technology, Nanjing 210094, China
4.College of Civil Aviation, Nanjing University of Aeronautics and Astronautics, Nanjing 210016, China
5.Glenn Department of Civil Engineering, Clemson University, Clemson, SC 29634, USA
Abstract: Coral sandy soils widely exist in coral island reefs and seashores in tropical and subtropical regions.Due to the unique marine depositional environment of coral sandy soils, the engineering characteristics and responses of these soils subjected to monotonic and cyclic loadings have been a subject of intense interest among the geotechnical and earthquake engineering communities.This paper critically reviews the progress of experimental investigations on the undrained behavior of coral sandy soils under monotonic and cyclic loadings over the last three decades.The focus of coverage includes the contractive-dilative behavior, the pattern of excess pore-water pressure (EPWP) generation and the liquefaction mechanism and liquefaction resistance, the small-strain shear modulus and strain-dependent shear modulus and damping, the cyclic softening feature, and the anisotropic characteristics of undrained responses of saturated coral sandy soils.In particular, the advances made in the past decades are reviewed from the following aspects: (1) the characterization of factors that impact the mechanism and patterns of EPWP build-up; (2) the identification of liquefaction triggering in terms of the apparent viscosity and the average flow coefficient; (3) the establishment of the invariable form of strain-based, stress-based, or energy-based EPWP ratio formulas and the unique relationship between the new proxy of liquefaction resistance and the number of cycles required to reach liquefaction; (4) the establishment of the invariable form of the predictive formulas of small strain modulus and strain-dependent shear modulus; and (5) the investigation on the effects of stress-induced anisotropy on liquefaction susceptibility and dynamic deformation characteristics.Insights gained through the critical review of these advances in the past decades offer a perspective for future research to further resolve the fundamental issues concerning the liquefaction mechanism and responses of coral sandy sites subjected to cyclic loadings associated with seismic events in marine environments.
Keywords: liquefaction susceptibility; dynamic deformation characteristics; coral sandy soil; cyclic loading; review and prospect
1 Introduction
Carbonate sediments may be subdivided into three soil types: calcareous sand with less than 50% CaCO3(calcium carbonate) content, siliceous-carbonate sand with CaCO3content between 50% and 90%, and carbonate sand with more than 90% CaCO3content (Flores Lopezet al., 2018).Carbonate sand is often called coral sand,which exists widely in coral island reefs and seashores in the tropical and subtropical regions from 30°S to 30°N (Burkeet al., 2011), which includes the South China Sea area, among others (Chenet al., 2021a).Figure 1 shows schematically the global distributions of coral island reefs (Burkeet al., 2011), the locations and photos of observed coral sand liquefaction (Vahdaniet al., 1994; Chocket al., 2006; Olsonet al., 2011),the sites of the coral sandy soil liquefaction studies reported in the literature (e.g., Chenet al., 2021a), and the corresponding seismic hazard levels (Shedlocket al., 2000).Coral sands predominantly consist of skeletal remains of coral, shells, and other marine organisms;their mineral compositions are mainly aragonite, high magnesium calcite, and calcite.Coral sands have various particle types, which can differ in nature, shape,and form.The unique features that distinguish them from siliceous sands include rough surfaces, numerous intraparticle pores, irregular particle shapes, higher void ratio (e), poor gradation, and a relatively higher specific gravity (Gs) (Fookes, 1988; Hyodoet al., 1998; Sharma and Ismail, 2006; Olgunet al., 2009; Brandes, 2011;Salemet al., 2013; Ruiet al., 2020; Chenet al., 2021a,2022; Lianget al., 2023).
Significant differences in the maximum and minimum void ratios (emaxandemin) and the void ratio range (emax-emin) exist between siliceous sandy soils and coral sandy soils (Lianget al., 2023).The results of post-earthquake reconnaissance at the liquefaction sites with coral sand soils during the Hawaii, Guam,and Haiti earthquakes (Fig.1) indicated that the peak ground acceleration (PGA)of ~ 0.10 g is the minimum ground motion level for liquefaction triggering.The surficial liquefaction manifestations are similar to those of siliceous sandy and gravelly soils (Yuanet al., 2019).However, little is known about the performance of coral sandy soils during strong earthquakes.
In the 1970s, the petroleum industry first studied the undrained cyclic response nature of coral sandy soils for offshore platforms.In the early 1990s, investigators mainly focused on the static properties of coral sandy soils (e.g., Coop, 1990; Airey and Fahey, 1991).Later,Wanget al.(1997) published a monograph entitled“Coral Reef Engineering Geology of Nansha Islands”.The publication of this monograph marks the opening of the studies of coral reef engineering geology and the mechanical properties of coral sandy soils in China.
In recent years, coral sandy soils have been widely adopted as foundation and backfill material for offshore wind turbines, offshore platforms, airports on island reefs, ports, seabed pipelines, and other infrastructures in many regions (such as Australia, the Arabian Peninsula,and the South China Sea), shown in Fig.1.It has been a major challenge for maintaining the safety of offshore projects in the neritic regions with high seismic intensity(e.g., Dattaet al., 1982; Fookes, 1988; Nicholson, 2006;Porcino and Tomasello, 2019).In geotechnical practice,the undrained behaviors of coral sandy soils subjected to cyclic loadings associated with earthquakes and sea waves are a critical concern.
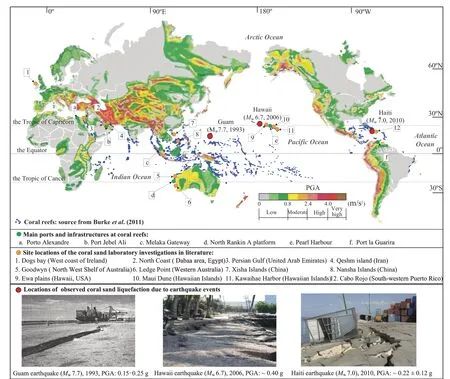
Fig.1 Map showing global distributions of coral island reefs, the locations and photos of coral sand liquefaction sites, the locations of the coral sandy soils for undrained monotonic loading and liquefaction tests in the literature, and the corresponding seismic hazard levels.
Figure 2 illustrates the differences of undrained cyclic responses for siliceous sandy soils and coral sandy soils,including the generation of excess pore water pressure(EPWP)ueplotted against the number of cyclesN, the peak EPWP ratiorup(defined as the ratio of the peakueto the initial effective confining stressp0′ acting on the specimen in cyclic laboratory tests) plotted against cycle ratioN/Nf, and cyclic stress ratio (CSR) plotted againstNf, whereNfis theNrequired to causerup=100% (Chenet al., 2020a, 2021a; Maet al., 2022b, 2023d).Usually,the liquefaction resistance or cyclic resistance ratio(CRR) is defined as the CSR in cyclesNf.As shown in Fig.2, the generation rate ofuein the coral sand sampled from the South China Sea (SCS) is significantly lower,which may be attributed to the interlocking fabric due to the irregular shapes and rough surfaces of coral sand particles.A significant difference in the variation ofrupversusN/Nfalso exists between siliceous sandy soils and the SCS coral sandy soils.Under similar conditions,the coral sands are less susceptible to liquefaction.Note that the EPWP ratioruin the Seedet al.(1975) model is denoted asrup, whereas theruin the models by Martinet al.(1975), Dobryet al.(1985), and Chenet al.(2019a)is denoted asrur(i.e., the residual EPWP ratio).Figure 3 illustrates the meanings of residualue, peakue, and fluctuation amplitude ofue.The laboratory data points of coral sandy soils fall to the right of the field-based liquefaction triggering curve (CRR versusVs1) derived from clean siliceous sands (Porcino and Tomasello,2019).These findings suggest that previous theories and methods derived from siliceous sandy soils may not be applicable to coral sandy soils.
The liquefaction of coral sandy soils associated with earthquakes and sea waves can lead to large surface subsidence and lateral spreading and significantly damage structures and facilities at coral sandy shores,island reefs, and hydraulically filled coral sandy sites.Thus, the liquefaction susceptibility and deformation characteristics of saturated coral sandy soils under cyclic loadings have emerged as a significant challenge to geotechnical earthquake engineering communities.This review summarizes the progress toward meeting this challenge in the past three decades.It aims to provide a basis for a better understanding of the undrained cyclic behaviors and a reference for future research on coral sandy soils subjected to cyclic loadings.Besides,the insights gained through this critical review and a perspective on future research in this field are also provided.
2 Undrained monotonic shear responses
The results of undrained monotonic shear (UMS)tests can help understand the anisotropy characteristics of saturated coral sandy soils and provide benchmarks for evaluating liquefaction susceptibility and deformation under various cyclic loadings.Given the deposition of coral sandy soils in extremely complex marine environments, significant differences exist in the UMS features of coral sandy soils worldwide.
2.1 Contractive and dilative behavior
The concept of phase transformation (PT) was first presented by Ishiharaet al.(1975).It defines the critical point during undrained shearing at which the behavior of soil changes from contraction to dilation.As shown in Fig.4, in the deviatoric stressq-effective mean principal stressp′ plan, theqat the PT point accompanied by the maximumueor the minimump′ is defined as the shear resistanceSPT, and the effective friction angle at the PT point is marked asφP′T(Ishiharaet al., 1975).
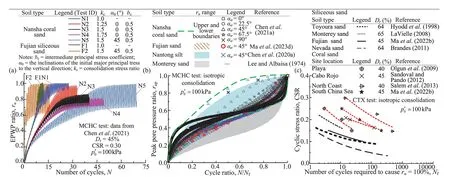
Fig.2 Comparisonofundrainedcyclic responses between saturatedcoralsands and siliceoussands:(a)generationsofEPWP (ru);an d (b)theranges ofpeakpore pressure ratiorup plottedagainstcycle ratio N/Nf;and (c)CSRplotted againstNf

Fig.3 Schematic diagram for the meanings of residual EPWP,peak EPWP, and fluctuation amplitude of EPWP

Fig.4 Idealized effective stress path under undrained monotonic shearing
Few data are available on coral sand’s contractive and dilative behavior under monotonic shearing.Table 1 summarizes the basic index properties of coral sandy soils tested for undrained monotonic loading and liquefaction tests in the literature.Figure 5 shows the particle size distributions (PSDs) of coral sandy soils used in the tests as reported in the literature.Figure 6 exemplifies the typical results of undrained monotonic triaxial (UMT)tests on the saturated Dogs Bay coral sand (Hyodoet al.,1998).This sand shows very stiffup to the PT point in compression, and after PT, universal hardening behavior with increasingqis observed until strains are over 20%.However, it shows softening with lower strength tested in extension at lowp0′, but it exhibits dilation without showing initial contraction observed at higherp0′; as the 0p′ increases, both loose and dense coral sands reveal an initial contraction followed by a dilative tendency.Mao and Fahey (2003) compared the results of UMS tests on three saturated coral sandy soils: muddy silt, silt, and sand sampled from the seabed at the Gorgon site on the North West Shelf of Australia.The muddy silt exhibits contractive behavior, whereas the silt and sand exhibit apparent dilative behavior.Through UMT tests on a silty coral sand sampled from the seabed near the Goodwyn platform and a coral sand located in the coastal Ledge Point on the North West Shelf of Australia, representing two extreme depositional environments, the results show that a clear PT point is observed in the effective stress paths of the two saturated soil specimens.The stress ratiosq/p′ of two coral sandy soils at the PT point are higher than those of siliceous sands.After the PT,the dilatancy continued until the peak strength in theq-εa(axial strain) plane is mobilized at a larger strain(Sharma and Ismail, 2006).Through UMT tests on saturated coral sand sampled from the North Coast in Egypt, Agaiby (2011) found that the loose (relative densityDr= 40%) and dense (Dr= 80%) specimens continuously exhibited similar initial contractive behavior until the PT point.The contractive behavior is more evident as0p′increases and when the specimen is loose.In addition,it is worth noting that the dense specimen exhibits dilative behavior with almost no initial contraction.The drained direct simple shear tests on dry coral sandy soils sampled from the coastal zone surrounding the Hawaiian Islands (East Island, Maui Dune, and Kawaihae Harbor)indicated that compared to siliceous clean Nevada and Ottawa sands, theφP′Tof coral sands are generally higher(φP′T≈35°; Brandes, 2011).Salemet al.(2013) performed UMT tests on Dabaa coral sandslocated on the North Coast, Egypt; the results indicated that the loose (Dr= 20%)and dense (Dr= 75%) specimens exhibited similar initial contractive behavior at shearing.This contractive behavior of loose specimens is more apparent as0p′increases.However, experimental study on the effects ofDr,0p′, PSD, and particle form (shape and size) on the contractive and dilative behaviors of coral sandy soils is still insufficient.

Fig.5 Particle size distributions of coral sand soils in the literature for undrained monotonic loading and liquefaction tests
Recently, based on the results from UMS tests on saturated SCS coral sand (taken from the Nansha Islands)using a hollow-cylinder apparatus (HCA) (Chenet al.,2021a; Maet al., 2022a), as shown in Fig.7, it is found that the coral sand always exhibits shear contraction until the PT point, and after the PT, thep′ continuously increases asqincreases, accompanied by dilation.This inherent feature is independent of consolidation conditions, including the inclination of consolidation pathα0and the consolidation ratiokc(the ratio of initial effective major (σ1c′ ) and minor (σ3c′ ) principal stresses),along with the inclination of monotonic shearing to the vertical axisαm.
2.2 Anisotropic characteristics
Natural coral sandy soil deposits are generally anisotropic, exhibiting stress-path-dependent mechanical properties.Even though the anisotropy feature of siliceous sandy soils has been investigated extensively,little is known about the undrained anisotropy of coral sandy soils, including intrinsic anisotropy and stressinduced anisotropy.
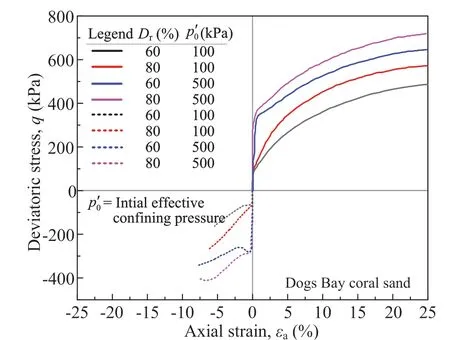
Fig.6 Deviatoric stress-axial strain curves obtained from undrained monotonic triaxial tests on saturated Dogs Bay coral sand (data from Hyodo et al., 1998)
The way of deposition is a crucial factor for affecting intrinsic anisotropy (particle shape and size, fabric form)of coral sandy soils.The effects of inherent anisotropy on the UMS behavior of coral sands are rarely reported.Recently, through undrained monotonic simple shear tests on two types of SCS coral sands taken from the lagoon seabed (quite irregular particle shape) and from the coastal area (relatively regular particle shape), Ruiet al.(2020) found that the initial normal stress has little influence on theφP′T.TheφP′Tof lagoon coral sand is about 23°, whereas theφP′Tof coastal coral sand is about 20°.The results showed that theφP′Tis moderately affected by the particle shapes.Via UMT tests on the SCS coral sand, Zeng and Liu (2023) studied the intrinsic anisotropic behavior of saturated specimens withDr= 44%.They found that the specimens with different deposition inclinations exhibit evident anisotropy.At the same time, theuebuild-up decreases as the inclination of the depositional plane to the horizontal direction increases, indicating that specimens with a small depositional inclination angle are more compressible.And the anisotropic behavior is more significant at low 0p′.
Recently, several studies have focused on the stress-induced anisotropy in coral sands using UMT tests.Salehzadehet al.(2008) performed UMT tests on saturated coral sand obtained from the coast of North Cornwall at Rock beach opposite Padstowe-England.The results show that the anisotropy due to particle shape is more significant in loose specimens (Dr≈ 45%)than dense (Dr≈ 90%) and decreases with increasing0p′.Using HCA, Zhouet al.(2019) investigated the UMS responses of saturated SCS coral sand under variouskcand atα0= 0.Note that the PT line of the loose specimen(Dr≈ 35%) is independent ofkcand0p′, and theSPTbecomes higher with the increase ofkc.The PT line andφP′Tof the SCS coral sand are higher than those of Ottawa sand.Figure 7 shows that the influences ofα0andαmon theSPTandPTφ′ of the SCS coral sandy soil tested are significant (Chenet al., 2021a; Maet al.,2022a).Under isotropic consolidations, the variation ofSPTwith increasingαmfrom 0 to 90° is an upwardbending parabola, and theSPTatαm= 45° is the lowest,whereasφP′Texhibits a linear decreasing tendency asαmincreases.Under anisotropic consolidations, the variation ofSPTandPTφ′ withαmis quite complex.Note that theSPTis the largest whenαm=α0.Heet al.(2023)recently conducted UMT tests on saturated SCS coral sand withDr= 80%.They observed that the0p′ andkcsignificantly affected the stress-strain relationship anduebuild-up; higherqin the specimen can be observed at a lowerp0′ due to the negativeuebuild-up induced by dilatancy.Meanwhile, the negativeueaccumulated more significantly askcincreased.Yet, the maximum and minimumuedecreased, and the specimens subjected to higherkcand0p′ reached the PT state more quickly.
3 Liquefaction susceptibility
The undrained cyclic behavior of coral sandy soil depends on many factors, such as its physical states and index properties and the consolidation and cyclic loading conditions.The investigations of the undrained cyclic response characteristics of coral sandy soil are limited.Traditionally, the undrained cyclic responses were evaluated using cyclic triaxial (CTX) tests, cyclic torsional shear (CTS) tests, cyclic axial-torsional coupled hollow cylindrical (CATC) tests, cyclic directsimple shear (CDSS) tests, or tri-directional cyclic simple shear (TCSS) tests (uncontrolled intermediate principal stress coefficientb: 0↔1).In contrast, Chenet al.(2021a) performed more advanced multidirectional cyclic hollow cylinder (MCHC) tests (b= 0.5) on the SCS coral sand under both the 90° jump and the continuous rotation of principal stresses.As shown in Table 1 and Fig.5, the undrained cyclic laboratory tests reported in the literature cover a broad range of PSDs for coral sandy soils, which vary in soil origin, particle gradation,and extreme void ratio.For comparison, the PSD range of coral sandy soils that liquefied during the 2010 HaitiMw7.0 earthquake (Yuanet al., 2019) and the PSD range of most liquefiable siliceous sandy soils are also plotted in Fig.5.
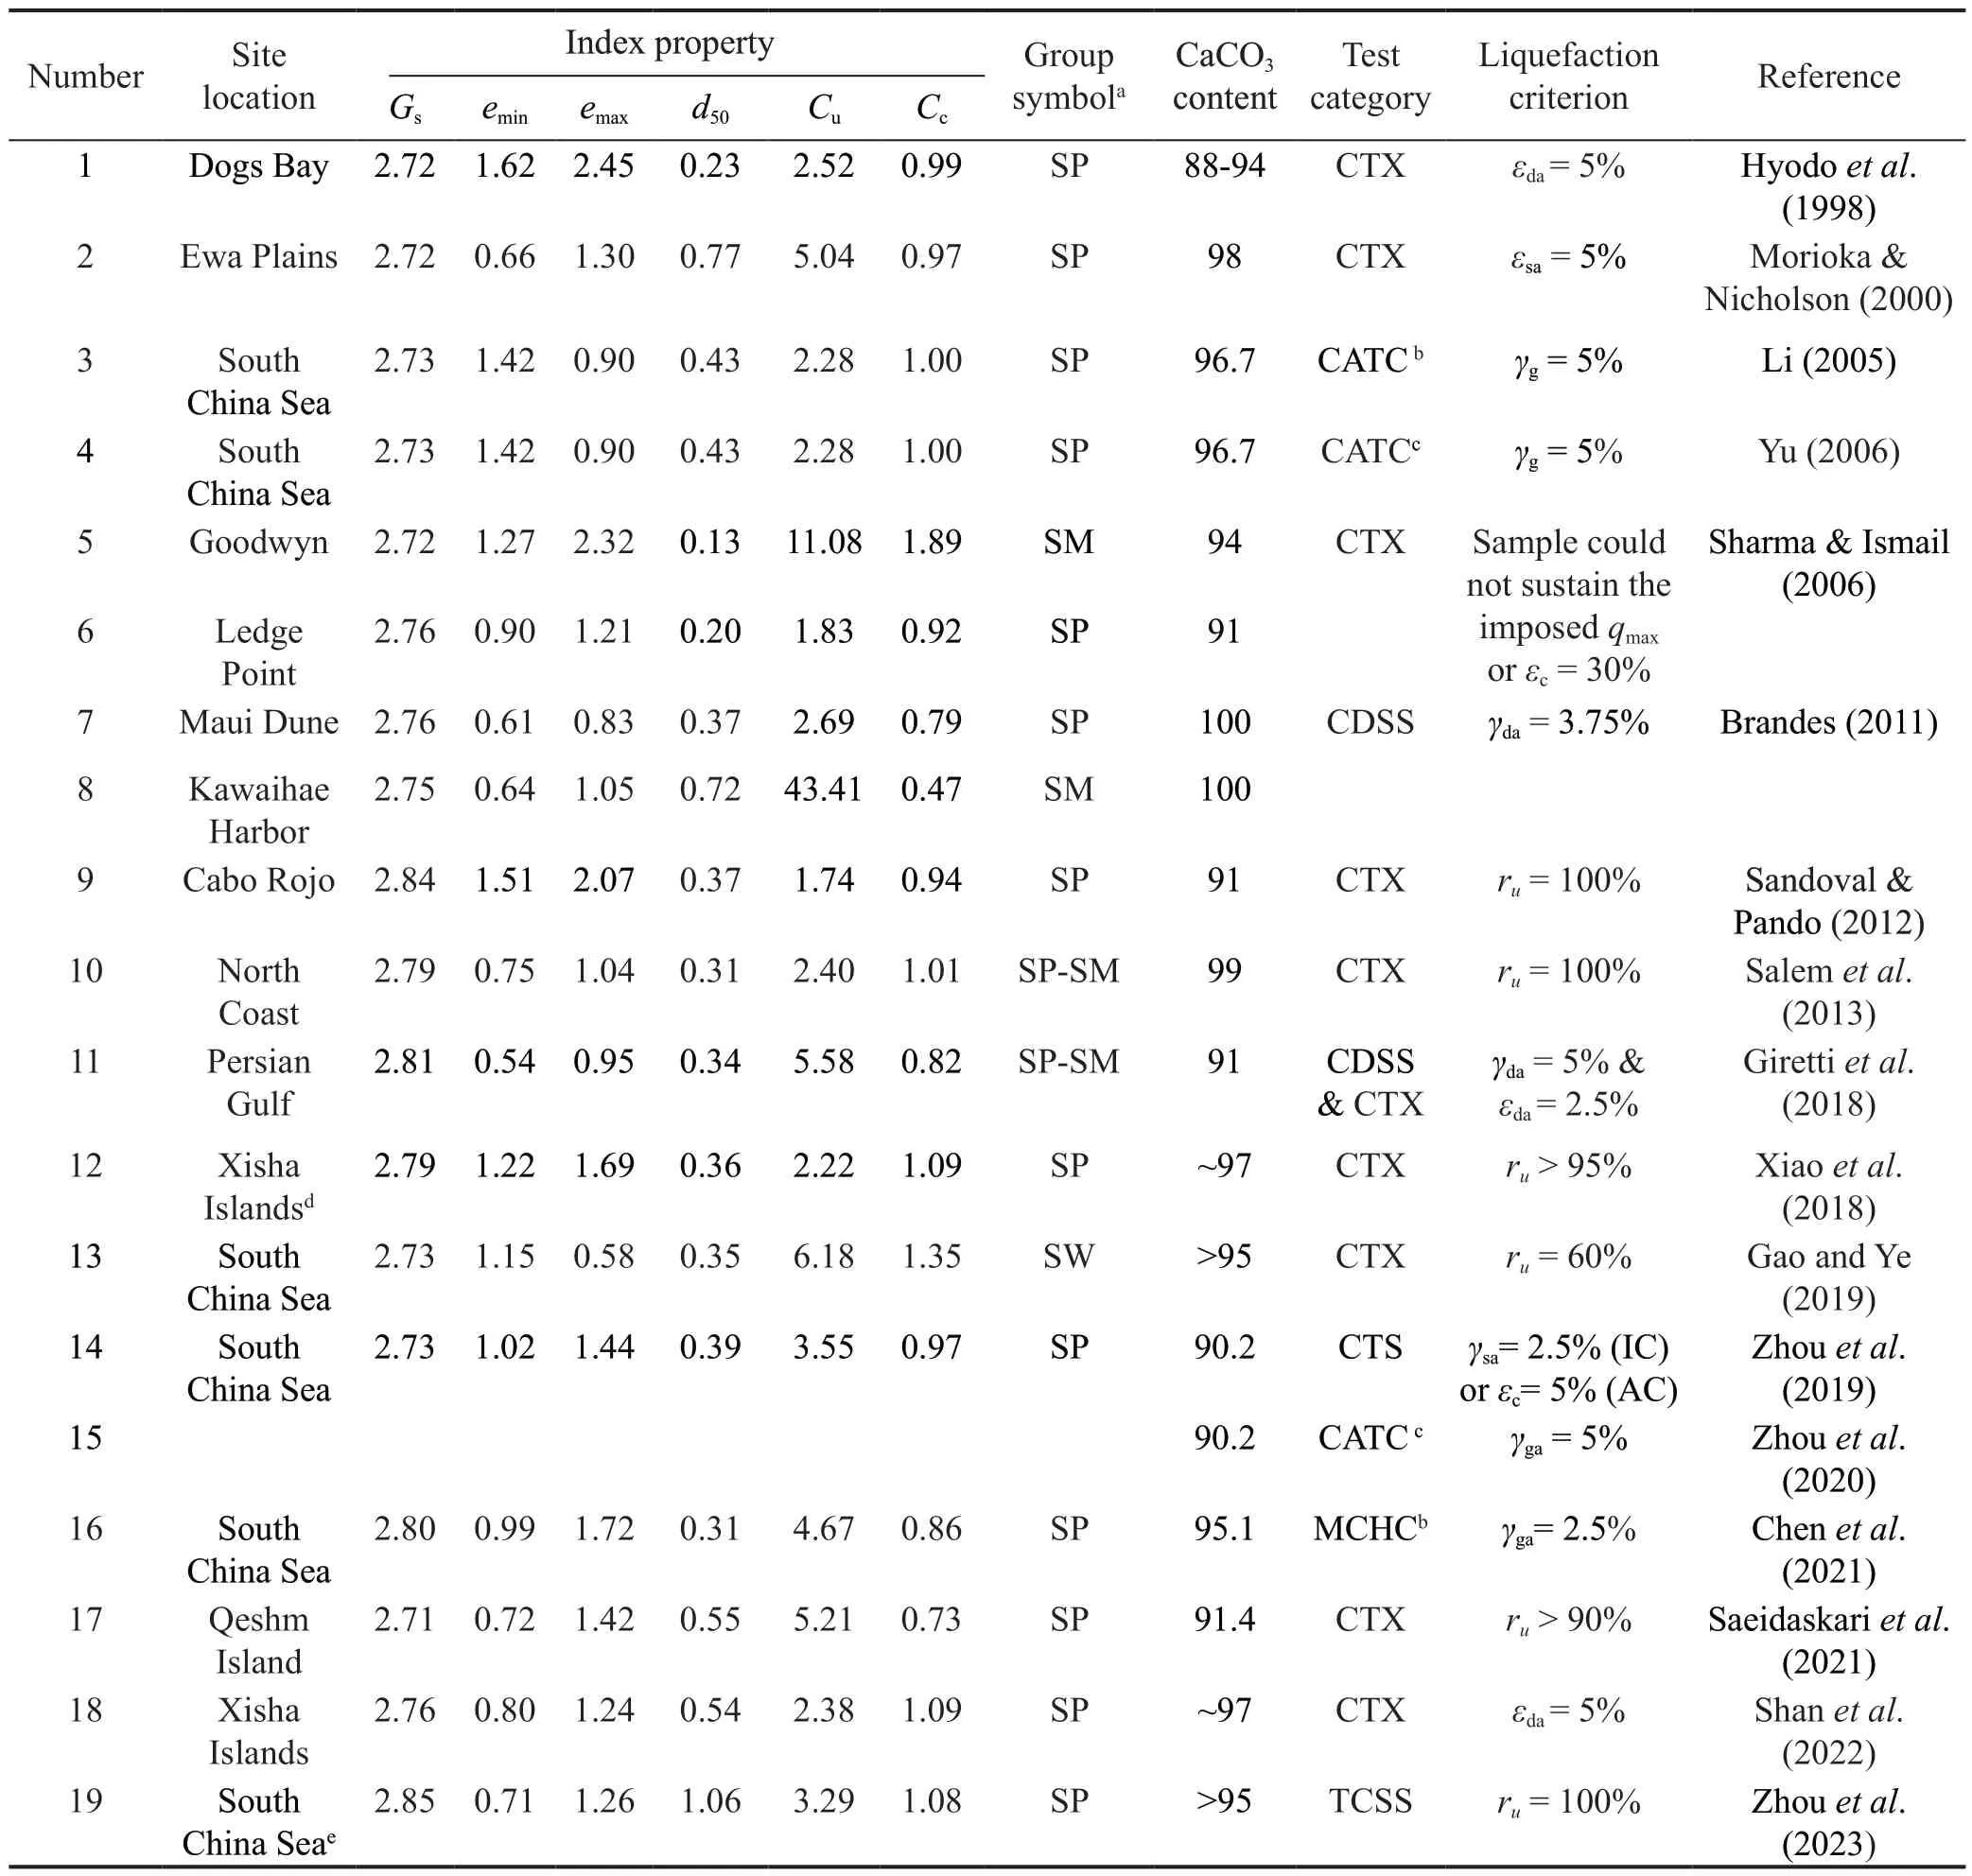
Table 1 Experimental studies on monotonic shear behavior and liquefaction susceptibility of coral sandy soils in the literature
Different criteria have been proposed for liquefaction triggering, as shown in Table 1.Two well-known triggering criteria for undrained cyclic responses of saturated coral sandy soils are reviewed here.One is based on the EPWP ratio (reaching unity as the criterion).For isotropically consolidated specimens,rupis more suitable thanrurdue to the larger fluctuation amplitude ofru(see Figs.2 and 8).The other is based on the strain level afterNfcycles.Thus, the liquefaction resistance or CRR, denoted as the CSR required to reach a specific liquefaction criterion, is conventionally presented as the CSR versusNfcurve.For isotropically consolidated specimens, the initial liquefaction is observed when the generalized shear strain amplitudeγgareaches 2.5% (based on the experimental data of the saturated SCS coral sand reported by Chenet al.(2021a)).For anisotropically consolidated specimens, therupis less than 100% whenγgareaches 2.5%, and the progressive failure with excessive accumulative strains developed over cycles.Therefore, Chenet al.(2021a) suggested thatγga= 2.5% can mark the critical point after which theγgaincreases dramatically.
3.1 EPWP generation and liquefaction mechanism
3.1.1 EPWP generation feature and liquefaction mechanism
The mechanism of undrained responses of saturated coral sandy soils leading to liquefaction may be understood by observing the generation and accumulation ofueand strain components developed in cyclic laboratory tests.Many studies focused on theuegeneration ofcoral sandy soils subjected to undrained cyclic loadings (e.g., Fahey, 1988; Airey and Fahey,1991; Li, 2005; Sandoval and Pando, 2012; Girettiet al.,2018; Chenet al., 2021a; Saeidaskariet al., 2021; Maet al., 2023c; Qinet al., 2023b, 2023d; Wuet al., 2023a).
The early studies of undrained cyclic behavior of coral sands mainly focused on the rate ofuegeneration and the number of cycles required to cause failure (Nf)(e.g., Fahey, 1988; Kaggwaet al., 1988).Airey and Fahey (1991) conducted undrained one-way and twoway CTX tests at a loading frequencyf= 0.1 Hz on the saturated coral sand retrieved from the North-West Shelf of Western Australia.They found that in two-way tests,after 200 cycles, theueincreases at a constant rate until about 460 cycles; then, the rate rises rapidly.Whereas in one-way tests, theueappears to stabilize towards the end of the first 1000 cycles and beyond which, it starts to increase at a higher CSR.Sandoval and Pando (2012)performed undrained CTX tests atf= 1 Hz on saturated coral sand from Cabo Rojo beach in southwestern Puerto Rico.Their results showed significant differences in theuebuild-up between coral sand and siliceous Ottawa sand.With the coral sand, theueshowed greater fluctuations between loading cycles.Recently, with undrained CTX tests and CDSS tests on saturated loose and mediumdense coral sand specimens (sampled from the Persian Gulf offshore of the United Arab Emirates), however,Girettiet al.(2018) reported no substantial evidence to suggest that coral sand is more resistant to theuebuildup.Wanget al.(2019) conducted undrained CTX tests on saturated loose and medium-dense SCS coral sands under cyclic loadings of various waveforms (sinusoidal,square, or triangular).The results showed that the effect offon the rate ofuegeneration is modest atf= 0.1, 0.5,1.0, and 1.5 Hz.Only atf=1.8 Hz does the rate ofuegeneration exhibit a noticeable decrease.Note that theuebuild-up for the triangular waveform is slightly lower than that for the sinusoidal waveform.
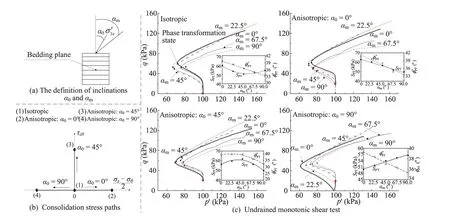
Fig.7 (a) Inclination α0 of consolidation paths and inclination αm for monotonic shear loadings; (b) consolidation stress paths; and(c) effects of α0, kc, and αm on the undrained monotonic shear responses of saturated coral sand specimens during monotonic shear tests (complied data from Chen et al., 2021a; Ma et al., 2022a)
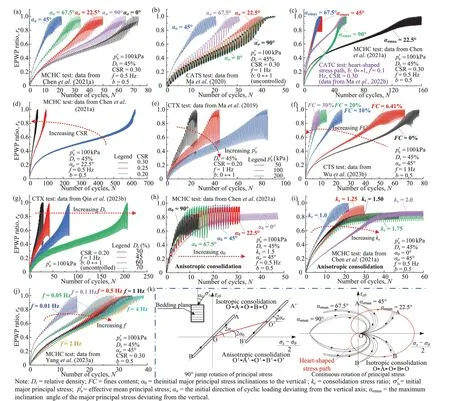
Fig.8 Variation of EPWP ratio with the numbers of cycles N for saturated coral sand (compiled data from Chen and his co-workers: Ma et al., 2019, 2020, 2022b; Chen et al., 2021a; Qin et al., 2023b; Wu et al., 2023b; Yang et al., 2023a)
More recently, through undrained CDSS tests on the saturated SCS coral sand soils, Ruiet al.(2020)found that the coral sand with irregular particles shows a slower rate ofuegeneration and needs more cycles for liquefaction triggering.Saeidaskariet al.(2021)presented the generation ofuemeasured by undrained,strain-controlled CTX tests atf= 0.5 Hz on the saturated coral sand withDr= 40 and 70% (sampled from the Qeshm island in the south of Iran).As0p′ increases,a largerueis generated under cyclic loadings, and this increment is more apparent at higher cyclic strain levels.Further, theDrconsiderably affects the pattern ofuegeneration.Additionally, by undrained CTX tests atf=0.1 Hz to investigate the effect of particle gradation on the undrained behavior of saturated gravelly coral sand soil, Guoet al.(2023) found that the rate ofuebuild-up decreases as the increase of mean particle size (d50) at the same uniformity coefficient (Cu).
Through undrained cyclic laboratory tests, Chen and his co-workers investigated the mechanism and patterns of EPWP build-up in the saturated SCS coral sandy soils(Maet al., 2019, 2020, 2022b; Chenet al., 2021a; Qinet al., 2023b; Wuet al., 2023b; Yanget al., 2023a).Their results, as shown in Fig.8, characterize the influences of various factors (including the index properties and physical states of the coral sandy soils, consolidation conditions, and cyclic loading conditions) on the mechanism of the pattern and generation rate of EPWP ratioru.For the coral sandy soil with fines content (FC)below the thresholdFCth= 30% (Thevanayagamet al.,2002; Chenet al., 2020b), as shown in Figs.8(a)-(g) and(j), the fluctuation amplitude ofruincreases at a low rate untilruapproaches 1.0 (for all isotropically consolidated specimens).Thus,therupof 100% may be adopted as the liquefaction criterion of coral sandy soils.In Fig.8(a),the rate ofrugeneration atασ= 45° is much faster than those atασ≠ 45°.Further, the rate ofrugeneration atασ=0 is the slowest, and significant differences in the rate ofrugeneration exist betweenασ= 22.5° and 67.5° or betweenασ= 0° and 90°.As seen in Fig.8(a) and Fig.8(b), for the sameασ, the rates ofrugeneration in MCHC tests (b=0.5) are significantly lower than those in CATS tests (b:0↔1), except for the rate ofrugeneration atασ= 45°.In contrast, the rate ofrugeneration atασ= 0° is similar to that atασ= 90° in CATS tests.This finding highlights the effect ofbvalue on the mechanism of EPWP build-up in saturated coral sandy soils.Thus, thebvalue should remain constant during the cyclic loadings to eliminate its influence.A comparison of Fig.8(a) with Fig.8(c)indicates a significant difference in the pattern and rate ofrubetween the 90° jump of principal stresses and the continuous rotation of principal stresses in MCHC tests.For tests with the continuous rotation of the principal stress, the rate ofrugeneration atασmax= 22.5° is much lower than those atασmax≠ 22.5°.In contrast, the rates ofrugeneration atασmax= 67.5° and 45° are almost the same and both greater than that atασmax= 90°.Additionally,after about 10 cycles, the rate ofrugeneration at the heartshaped stress path is lower than those at the continuous rotation of principal stresses withασmax= 67.5° and 45°.After about 45 cycles, the rate ofrugeneration at the heart-shaped stress path is similar to that atασmax= 90°.In Figs.8(d), 8(e), and 8(g), the rates ofrugeneration increase as CSR increases and as0p′ andDrdecreases.In addition,Nfmagnitudes (forrup≈ 1) at CSRs = 0.25 and 0.30 are much smaller than at CSRs = 0.20.Similarly, theNfat0p′ = 50 and 100 kPa are much smaller than that at0p′ =200 kPa, whereas theNfatDr= 70% are much larger than that atDr= 30%, 45%, and 60%.From Figs.8(c), 8(d),and 8(g), it may be concluded that the medium-dense saturated coral sandy soils subjected to the continuous rotation of principal stress withασmax= 22.5° at CSR =0.30, the 90° jump of principal stress withασ= 22.5° at CSR = 0.20, and subjected to cyclic axial loading with CSR = 0.20, is unlikely liquefied unless it is subjected to more than one hundred loading cycles.Such a scenario is unlikely to occur in earthquake events.In Fig.8(f), the rate ofrugeneration in coral sandy soils withFCbelow the criticalFCthincreases with increasingFC, and it is the lowest in clean coral sand (FC= 0).From Figs.8(f)and 8(g), it can be inferred that the rate ofrugeneration is significantly affected by extreme void ratios (emax,emin)and particle gradation.From Figs.8(h) and 8(i), the rate ofrugeneration decreases with the increase ofkcorα0for all anisotropically consolidated specimens.The effect offon the rate ofrugeneration in siliceous clean sand remains unclear.For example, Dash and Sitharam (2016)showed an increasing trend, but Nonget al.(2020) and Yueet al.(2023) showed a decreasing trend.Little is known about the effect offon the EPWP build-up of coral sandy soils.In Fig.8(j), the rate ofrugeneration in MCHC tests generally decreases asfincreases, while the effect offon the rate ofrugeneration is minimal in the range of 0.5-4 Hz.Furthermore, it is noteworthy that the rates ofrugeneration atf= 0.05 Hz and 0.1 Hz are quite similar to those atf= 0.5 Hz and 1 Hz.
In recent years, mitigation of soil liquefaction potential using a microbial-induced carbonate precipitation (MICP) process has garnered increasing attention and interest.Through a series of undrained CTX tests on isotropically consolidated, saturated coral sand samples from Yongxing Island in China, Xiaoet al.(2018, 2019) found that the rate ofrugeneration (see Fig.9(a)) decreases as cementation solution (CS) contents increases; and that the MICP-treatment can change the failure feature of initially loose specimens from flow liquefaction to cyclic mobility, suggesting that the effect of bio-cementation is analogous to an increase inDr.In addition, through undrained TCSS tests on saturated SCS coral sands with and without fiber-treatment, Zhouet al.(2023) found that increasing CSR significantly accelerates the rate ofrubuild-up.However, the rate ofrubuild-up decreases as fiber content increases (see Fig.9(b)).
Soil liquefaction can be considered a state transition,where the granular medium transforms into a fluid-like state during the cyclic loading.Chenet al.(2016, 2021c)introduced two essential parameters to describe such state transition.The first parameter, the apparent coefficientη(Chenet al., 2016), is employed to characterize the saturated sandy soil state change.The second parameter,the average flow coefficientka, describes the fluidity of saturated sandy soil (Chenet al., 2021c).Qinet al.(2023d, 2023j) conducted undrained MCHC tests on the loose to dense, saturated SCS coral sand specimens,subjected to various cyclic loadings (patterns, stress paths,f, and CSRs), in which the coral sand is the same in Chenet al.(2021a).It is observed that theη-Ncurve is closely related to cyclic loading conditions.At the same time, theηgradually decreases asruincreases and approaches nearly zero when therupcloses to 100%,as shown in Fig.10.The correlation betweenηandruhighlights the utility ofηas a physics-based proxy for identifying liquefaction triggering.As shown in Fig.11,there exists a unified hyperbolic form of the correlations between the deviatoric strain rate amplitudeγ˙qaand the scalar coefficient of thixotropic structureλst(here,λst= 1 -rup), indicating thatηis intricately linked to the deviatoric strain rateqγ˙.Therefore, the liquefiable coral sandy soils, before experiencing initial liquefaction,can be conceptualized as strain-rate-dependent, shearthinning, non-Newtonian viscous fluids.
As shown in Fig.12, theκaversusrupcurve is significantly influenced by cyclic patterns and stress paths.Nevertheless, all the curves exhibit a geometric similarity, whereκaincreases in an exponential function form asrupincreases, independent ofDr,f, and CSR.The morphological characteristics ofκaversusrupcurves illustrate a progressive transition from gradual to rapid increase.This transition is especially notable afterrup≈ 0.6,whereκaexperiences a swift ascent, ultimately leading to a drastic increase atrup≈ 0.9.It can be inferred that the critical point of theκaversusrupcurve, characterized by a drastic increase in theκavalue, represents a phase change point from solid to liquid, signifying the onset of liquefaction triggering.Note that the values ofκaatrup=0.9 for all the tested specimens fall within the range of 0.0015 to 0.0353 s-1.kPa-1.
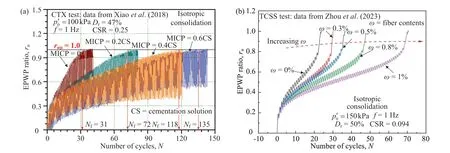
Fig.9 Variation of EPWP ratio for the coral sands: (a) MICP-treated coral sand (data from Xiao et al., 2018); and (b) fiberreinforced coral sand (date from Zhou et al., 2023)
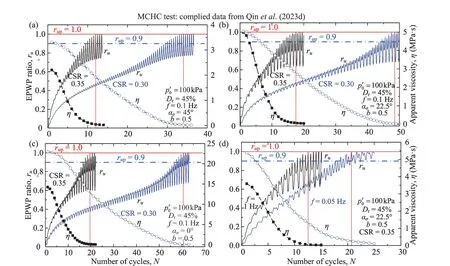
Fig.10 Variations of both apparent coefficient η plotted against N and EPWP ratio ru plotted against N at typical cyclic loading conditions (compiled data from Qin et al., 2023d)
Figure 13 provides examples of the variations of both the gradient Δη/ηand the gradient Δκa/κawithrup,recompiled the relevant data for saturated SCS coral sand in Qinet al.(2023d, 2023j), for saturated siliceous Fujian sand in Maet al.(2022b), and for saturated siliceous Nantong silt soil in Chenet al.(2020a).An interesting finding is that both Δη/ηand Δκa/κaexhibit an increase followed by a sharp decrease asrupincreases, where the maximum values are reached whenrupis approximately 0.9 for coral sand, around 0.85 for siliceous Fujian sand, and about 0.8 for siliceous Nantong silt soil, respectively.Considering the physical meanings ofηandκa, the morphological reversal points of both Δη/ηversusrupand Δκa/κaversusrupshould be interpreted as the phase change points from solid to liquid.Thus, it confirms that therup-based criterion is a robust method for identifying liquefaction triggering.Theη-based andκa-based approaches are preferred for identifying liquefaction triggering of sandy soils because they include the changing physical state of the soil throughout the progressive liquefaction process.

Fig.11 Variations of deviatoric strain rate ,,amplitude with increasing peak EPWP ratio rup at typical cyclic loading patterns and stress paths (compiled data from Qin et al., 2023j)
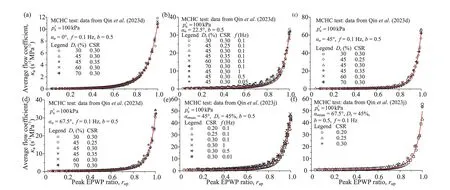
Fig.12 Variations of average flow coefficient κa with increasing peak EPWP ratio rup under various cyclic loading patterns and stress paths (data from Qin et al., 2023d, 2023j)

Fig.13 Variations of gradients Δη/η and Δκa/κa with increasing peak EPWP ratio rup at various conditions (compiled data from Chen and his co-workers: Chen et al., 2021; Ma et al., 2022b; Qin et al., 2023d, 2023j): (a) and (b) effect of cyclic loading conditions on the variations of Δη/η and Δκa/κa with rup for the SCS coral sand, respectively; (c) and (d) effect of and Dr on the variations of Δη/η and Δκa/κa with rup for the SCS coral sand, respectively; (e) variations of Δκa/κa with rup for saturated Fujian quartz sand (left) and Nantong silt soil (right)
The results of the undrained cyclic laboratory tests on isotropically consolidated, saturated CSC coral sand at 0p′ =100 kPa are listed as follows.For undrained CATC tests (b: 0↔1) on loose (Dr= 30%) coral sand subjected to a circular stress path, the mechanism that governs the liquefaction instability indicates a flow failure (Li,2005; Yu, 2006).For undrained CTS tests and CTX tests on loose coral sand, the liquefaction instability exhibits cyclic mobility.In contrast, for undrained CTX tests on medium-dense (Dr= 55%) coral sand, the liquefaction instability demonstrates typical cyclic mobility (Yu,2006).
In the undrained MCHCtest, the torsional shear strainγzθis independent of the volume change of the tested specimen.Only two of the vertical strainεz,circumferential strainεθ, and radial strainεrin the specimen are considered independent variables.Figure 14(a)exemplifies the strain components (γzθ,εz,εr,εθ) measured using undrained MCHCtests on the saturated SCS coral sand in Chenet al.(2021a) subjected to the 90° jump of principal stress with variousασ(Maet al., 2023a).The onset of liquefaction instability is characterized by simultaneously the cyclic mobility and plastic strain accumulation in different strain components, and the strain components exhibit no flow failure.In Fig.14(b),an interesting finding is that the differenceγdbetween plastic strain componentγaand cyclic strain componentγcatγqa= 5%, viz.γd=γa-γc, along with the physicsbased parameterλq(the ratio of theqγ˙ to thef) can be separately employed as indicators to distinguish the overall deformation failure model of the plastic strain accumulation from cyclic mobility at an element level.For the tested SCS coral sand, the regime values ofγdandλqare found to be zero and 0.22, respectively.
Jinet al.(2023) recently conducted undrained CDSS tests on the saturated SCS coral sand.Their results revealed that the deformation failure of loose specimens exhibits consistent characteristics with flow liquefaction.In contrast, for the dense specimens, the single-amplitude shear strainγsgradually approached the limit value of ± 3.75%, which is at a level known as cyclic mobility.
3.1.2 Generation model of excess pore-water pressure
3.1.2.1 Strain-based generic form ofrupexpressions
Via isotropically consolidated, undrained MCHC tests on a saturated siliceous silt soil under cyclic loadings with variousασandασmax, Chenet al.(2020a)proposed the relationship between deviatoric strain amplitudeγqa(in percent) andrup:
whereAis a constant related to the sandy soil in question.
Chenet al.(2021a) conducted undrained MCHC tests on a saturated SCS coral sand under cyclic loadings with various CSR,ασ, andασmax.They found that the values of intermediate principal strainε2may be as high as 2% or even higher.Asγgaincorporates the major,intermediate, and minor principal strainsε1,ε2, andε3,whileγqadoes not include ε2, thus,γgais a more rational index to characterize the overall deformation level quantitatively.Because of this, a unique yet universal form of the relationships exists betweenγgaandrup,regardless of consolidated and cyclic loading conditions(Chenet al., 2021a), as illustrated in Fig.15:
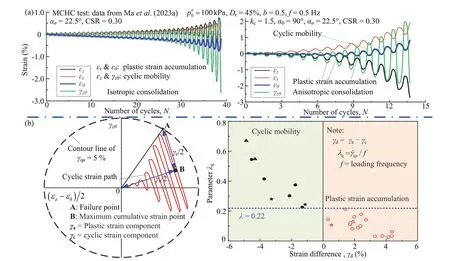
Fig.14 (a) Deformation characteristics of strain components of the saturated SCS coral sand specimens, and (b) overall deformation failure modes of the saturated SCS coral sand specimens (compiled data from Ma et al., 2023a)
whereAandBare the best-fitting coefficients associated with the sandy soil in question and consolidation conditions (AandBare insensitive to cyclic loading conditions), and therupis redefined as follows:
whereuepis the peak EPWP at theN-th cycle, anduep2.5is the asymptotic stable peak EPWP atγga= 2.5%.Note thatrupof 100% andγga= 2.5% are reached almost simultaneously for isotropically consolidated specimens.
As shown in Fig.16, through isotropically consolidated, undrained MCHC tests on the saturated SCS coral sandy soils withFCbelow theFCth=30%(the coral sandy soil withFC= 6.4% is the same in Chenet al.(2021a)), subjected to the 90° jump of principal stress with variousασ, Wuet al.(2023a) found that the coefficientAlinearly decreases asFCincreases and increases asDrincreases.Furthermore,Ais a parameter for characterizing particle gradation and interparticle packing state and increases nearly in an exponential function form as the void ratio (e) increases.In contrast,Bis a constant of about 0.97.Figure 16(b) shows the typical results of the measured and the predictedrup.
Using HCTA, by isotropically consolidated,undrained CATC tests on the saturated SCS coral sand in Chenet al.(2021a), subjected to the linear, circular,and heart-shaped stress paths, as displayed in Fig.17, a general form of the relationships betweenγqaandrupwas established, irrespective of cyclic loading paths (Maet al.,2022b):
whereA1is a material-dependent coefficient;B1is a constant independent of soil types, andB1≈ 0.98.
Note that for undrained CTS tests, there is only the shear strainγin the specimen, i.e.,γqa= the shear strain amplitudeγa.Using HCA, by the isotropically consolidated, undrained CTS tests on the same saturated SCS coral sand in Chenet al.(2021a), a general form of the relationships betweenγaandrup, which contains the influence ofFCbelow theFCthon therupgeneration, is as follows (Wuet al., 2023b):

Fig.15 Relationships between generalized shear strain amplitude γga and peak EPWP ratio rup of the saturated SCS coral sand subjected to various cyclic loading patterns and stress stresses (compiled data from Chen et al., 2021a): (a) isotropic consolidation; and (b) anisotropic consolidation

Fig.16 Variations of coefficient A with FC, Dr, or e: (a) the effect of FC and Dr on the values of A (left) and variation of A with e(right); and (b) comparison of the measured and the predicted rup for the representative specimens of saturated SCS coral sand (compiled date from Wu et al., 2023a)
whereA2is a coefficient associated withFCandDr.By introducing the equivalent skeleton void ratio(Thevanayagamet al., 2002; Chenet al., 2020b)to replace thee, it can be found that theA2/decreases within a power function form (see Fig.18(a)); whereasB2is a constant of about 0.97 for tested coral sand.Figure 18(b) exemplifies the typical results depicting the measured and the predictedrupversusγa.
3.1.2 Stress-based generic form ofrupexpressions
By isotropically consolidated, undrained MCHC tests on the saturated SCS coral sand in Chenet al.(2021a), subjected to the 90° jump of principal stresses with different CSR andασ, it is found that a unified form of the relationships exists betweenrupand cycle ratio (N/Nf)(Nf= the number of cycles to causeγga= 2.5%) (Maet al., 2023d):

Fig.17 Correlation between deviatoric strain amplitude γqa and peak EPWP ratio for the saturated SCS coral sand subjected to various cyclic stress paths (data from Ma et al., 2022b)
whereθ1is regarded as a material-dependent constant,and 1.0 is an appropriate value ofθ1for the tested SCS coral sand;λ1andλ2are the best-fitting coefficients related to the cyclic loading conditions and the sand in question.A unique relationship exists betweenλ1andλ2regardless of sandy soil types, whereasλ1is closely related to sandy soil types and decreases in power function form as the unit cyclic stress ratio USR increases (Fig.19(a)).Figure 19(b) illustrates the measured and predictedrupresults for typical specimens.The USR is defined as(Chenet al., 2020a):
in which
whereAMis a reference value for applying solely cyclic torqueMT(t), andAM= 1.27qamT;Tis the cyclic loading period;qamis the cyclic deviatoric stress amplitude acting on the hollow cylinder specimen;W(t) is the cyclic axial load, and 0.1 is an appropriate value forC3;roandriare outer and inner radiuses of the specimen, respectively.Note that for the CTS test, the CTX test, and the CATC test using HCA at a specificqam,C1=C2= 1, and thus,USR = CSR.
As shown in Fig.20, by isotropically and anisotropically consolidated undrained CTX tests, as well as isotropically consolidated undrained MCHC tests on the saturated SCS coral sand in Chenet al.(2021a),Qinet al.(2023a; 2023b) found that a unified form of the relationships exists betweenrupandN/Nf, regardless ofDrandkc, sandy soil types, as well as cyclic loading patterns and stress paths, as follows:

Fig.18 Variations of the coefficient A2 with fines content FC, relative density Dr, or equivalent skeleton void ratio: (a) the effect of FC and Dr on A2 (left) and variation of A2 with (right); and (b) correlation between the measured and the predicted rup for the representative specimens of saturated SCS coral sand (compiled data from Wu et al., 2023b)
whereθ2,λ3, andλ4are the best-fitting coefficients for the coral sand in question;θ2increases andλ3decreases,respectively, in a power function form as USR increases at a specificDr.Furthermore, a unique relationship exists betweenλ3andλ4regardless ofkc, andDr, sandy soil types, as well as cyclic loading patterns and stress paths (Fig.20(a)).Figure 20(b) illustrates the measured and the predictedrupfor typical specimens.Note that for undrained CTX tests,rupis defined as the ratio of the peakuetotheuep2.5, in whichuep2.5is the peakueat singleamplitude axial strain ofεsa= 2.5%;Nfisthe number of cycles to reachεsa= 2.5%.In addition, although the distinctions between theλ1-λ2curve in Eq.(6) and theλ3-λ4curve in Eq.(12) are minimal (Fig.20(a)), it is observed in Figs.19(a) and 20(a) that the differences betweenλ1andλ3with increasing USR are significant.However, in Fig.20(c), therupandN/Nfcurves predicted by Eqs.(6) and (12) are almost identical.Furthermore, it should be noted that Eq.(12) exhibits a relatively better fit for the reverseS-shaped curves near the onset of initial liquefaction.
By isotropically consolidated, undrained CTX tests on the saturated SCS coral sand with and without MICP treatment, considering the effects of0p′, CSR,Dr, and the biocementation level on theuebuild-up of MICPtreated coral sand, Liuet al.(2021) proposed a uniform model ofrup:

Fig.19 Generation patterns of rup under various cyclic loading patterns and stress paths: (a) correlations both between λ1 and λ2 and between λ1 and USR (data from Wang et al., 2010; Park et al., 2015; Ma et al., 2023d); and (b) comparison between the measured and the predicted rup for the typical specimens of saturated SCS coral sand (compiled data from Ma et al., 2023d
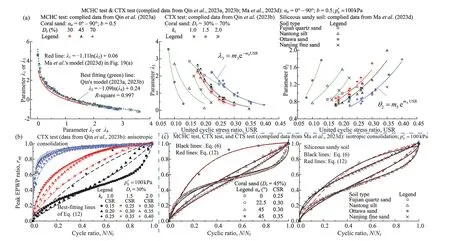
Fig.20 Generation patterns of rup under various Dr, consolidation and cyclic loading conditions (data from Qin et al., 2023a,2023b; Ma et al., 2023d): (a) correlation between λ3 and λ4 and variations of λ3 and θ2 with USR; (b) comparisons of the measured and the predicted rup by Eq.(12) for the saturated SCS croal sand specimens; and (c) comparison between the measured and the predicted rup by Eq.(6) and Eq.(12) for the saturated SCS croal sand and siliceous sands
whereαandβ,θare the best-fitting coefficients;Nfis the number of cycles required to cause initial liquefaction.Figure 21 shows the typical results of the measured and the predictedrupfor MICP-treated coral sand.
By the undrained TCSS tests on saturated fiberreinforced coral sand at the initial effective vertical stress (σv′0= 150 kPa), Zhouet al.(2023) proposed an empirical relationship between residual EPWP ratiorurandN/Nf(Nf= the number of cycles to causerur=100%),which can reflect the effect of fiber contents in coral sand on therurgeneration as follows:
whereaandbare the best-fitting coefficients.Figure 22 compares the tested and the predictedrurfor fiberreinforced coral sand.
3.1.2.3 Energy-based generic form ofrupexpressions
For MCHC tests, the cumulative energy dissipation per unit volume of soilWccan be expressed as:
wherejis thejth cycle;σz,σθ,σr,andτzθare vertical stress, circumferential stress, radial stress, and torsional shear stress acting on the hollow cylindrical specimen,respectively,σris always zero whenb= 0.5.
Qinet al.(2023h; 2023i) conducted isotropically consolidated, undrained MCHC tests on the saturated SCS coral sand withFC(below theFCth) subjected to the 90° jump rotation of principal stress with various CSR andασwithinf= 0.05-1.0 Hz, in which the coral sand withFC= 6.41% is the same material studied in Chenet al.(2021a).They found that the cumulative dissipated energy required for initial liquefactionWfdecreases in a power function form asincreases, see Fig.23, irrespective ofFC,Dr,f, CSR, andασ.Thus, a unified relationship between the normalized cumulative dissipated energyWRand therupwas established as follows (Qinet al., 2023h, 2023i):
in which
whereb1,b2, andnare the best-fitting coefficients independent of cyclic loading conditions, and for the tested coral sand,b1,b2, andnare 0.696, 0.6899, and 0.576,respectively;Parepresents the standard atmospheric pressure, and is approximately equal to 100 kPa.

Fig.21 Results of the measured and the predicted rup for the MICP-treated saturated coral sand (data from Liu et al., 2021)
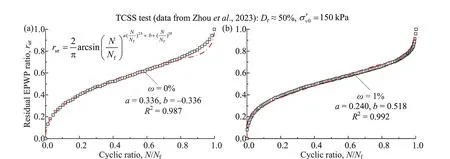
Fig.22 Results of the measured and the predicted residual rur for the fiber-reinforced saturated coral sand (data from Zhou et al., 2023)

Fig.23 (a) Variation of cumulative dissipated energy Wf for rup of first near 100% with equivalent skeleton void ratio esk and(b) variation of rup with normalized cumulative dissipated energy WR for the saturated SCS croal sand (compiled datafrom Qin et al., 2023h, 2023i)
Similarly, by isotropically consolidated, undrained CATC tests on the saturated SCS coral sand using HCA,as shown in Fig.24, a unified relationship betweenWcandrupis established for linear, circular, and heartshaped stress paths (Maet al., 2022b):
wherec1andc2are the best-fitting coefficients.
Moreover, by isotropically consolidated, undrained MCHC tests on saturated SCS coral sandy soils withFCbelow theFCth(the material withFC= 6.41% is almost the same in Chenet al.(2021a)) under the 90°jump rotation of principal stress with variousασ, Wuet al.(2023a) examined the broad applicability of Eq.(18)and the influence ofDrandFCon the values ofc1andc2,and found thatc1is a constant independent of theDrandFC, andc2is closely related to theDrandFC(see Fig.25(a)).Figure 25(b) compares the tested and predictedrupplotted againstWc.
3.2 Liquefaction resistance
3.2.1 Materials property effect
The results of field tests in lagoonal coral sand sites on Oahu and Maui islands (Hawaii) exhibit low standard penetration resistance (or cone penetration resistance)values but relatively high shear wave velocity (Vs)values (Nicholson, 2006).This finding implies thatVstesting may yield non-conservatively high values, while penetration testing reveals that coral sandy soils are susceptible to liquefaction.Through undrained CDSS tests on the SCS saturated coral sands with a similar PSD (particle sizes from 0.5 to 1 mm), Ruiet al.(2020)found that CRR has a nearly linear relationship with the overall regularity (OR)of sand particles (Here,ORis the average value of the aspect ratio, the convexity,and the sphericity corresponding to the 50% cumulative distribution).Based on the results of undrained CTX tests, Salemet al.(2013) reported that the liquefaction resistance of dense (Dr= 80%) Cabo Rajo coral sand is significantly higher than that of dense (Dr= 80%) Dabaa coral sand.In contrast, the liquefaction resistance of loose (Dr= 40%) Dabaa coral sand is significantly higher than that of loose (Dr= 45%) Cabo Rajo coral sand.These findings imply that depositional environments and mineral compositions strongly affect the CRR of coral sand soils.

Fig.24 Correlation between peak EPWP ratio rup and cumulative energy dissipation Wc for the saturated SCS coral sand subjected to various cyclic stress paths(data from Ma et al., 2022b)
Some cyclic laboratory studies indicated that the CRR of loose coral sands tends to be higher than that of siliceous sands at similarDrand consolidation conditions (e.g., Morioka and Nicholson, 2000; Brandes,2011; Salemet al., 2013; Maet al., 2022b).However,the results of undrained CDSS tests suggested that the liquefaction susceptibility of loose coral sands in the littoral zone surrounding the Hawaiian Islands (Maui Dune, Kawaihae Harbor, and East Island) is lower than that of siliceous Nevada and Ottawa sands (Brandes,2011).The opposite discrepancies highlight significant differences in liquefaction susceptibility among various coral sandy soils.
Figure 26 compares CSR curves versusNf(liquefaction resistance) for various types of saturated coral sands measured by undrained CTX, CDSS, and CTS tests, respectively.The critical implications from Figs.2(c) and 26 include the following three aspects.First, the liquefaction resistance of coral sands increases as eitherDrorp0′ increases.In addition, coral sands appear less susceptible to liquefaction than siliceous sands under similarDrand cyclic loadings due to their distinctive mineralogy and particle characteristics(nature, shape, and form).Secondly, at the identical index properties and physical state variables, while maintaining consistent consolidation and cyclic loading conditions, it is evident that significant difference in liquefaction resistances exists among coral sands in various regions of the world, even in the different island reefs, South China Sea.Third, multiple types of coral sands generally follow similar tendencies regarding the CSR versusNfcurves under the same undrained cyclic laboratory test.

Fig.25 Variations of (a) the coefficients c1 and c2 with the FC and Dr for the saturated SCS coral sand; and (b) comparison between the tested and the predicted rup plotted against Wc (compiled data from Wu et al., 2023a)
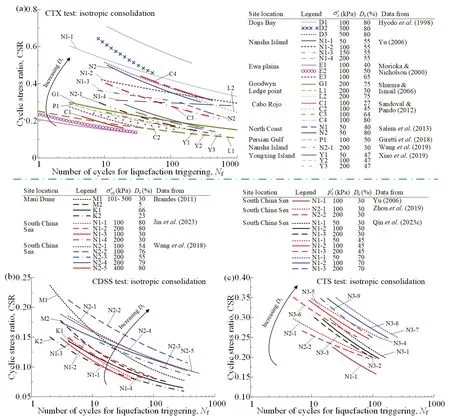
Fig.26 Comparisons of liquefaction resistances for coral sandy soils around the world for: (a) undrained cyclic triaxial (CTX) test;(b) cyclic direct simple shear (CDSS) test; and (c) cyclic torsional shear (CTS) test
Based on the results of the above-mentioned undrained CTX tests on the saturated SCS coral sand with and without MICP-treatment in Xiaoet al.(2018),from Fig.27(a), it is observed that the curve of CSR-Nfrequired to initial liquefaction shift significantly to the upper right as the CS content increases, after up to 0.4 CS, the rate of increase in CSR reduces.For the results of the aforesaid undrained TCSS tests on the saturated coral sand with and without fiber-reinforcement in Zhouet al.(2023), the liquefaction resistance of fiber-reinforced SCS coral sand increases evidently with increasing fiber contents, and a linear relationship in log-log scale exists between the normalized liquefaction resistance andNfrequired to initial liquefaction, see Fig.27(b).
Some researchers (e.g., Hyodoet al., 1998; Mao and Fahey, 2003; Porcinoet al., 2008; Ruiet al., 2020; Jinet al., 2023; Qinet al., 2023e) have identified a strong correlation between the stress ratioSPT/p0′ under UMS tests and the CRR under undrained cyclic laboratory tests,irrespective of consolidation condition, physical state,types of coral sands, cyclic loading patterns and stress paths.It was also demonstrated by Qinet al.(2023e,2023f) that, as shown in Fig.28, a virtual power-law relationship exists between the ratio of CRR to the stress ratio andNffor the same SCS coral sand in Chenet al.(2021a), irrespective ofkc,αc, andασ, where, both CRR andNfcorrespond to theγga= 2.5%.Therefore,SPT/p0′is an appropriate proxy for determining the CRR under various static stress states and cyclic loadings.
3.2.2 Cyclic loading pattern and stress path effect
Li (2005) and Yu (2006) found that the liquefaction resistance of saturated SCS coral sand in undrained CTX tests is generally notably higher than that observed in undrained CATC tests (b: 0↔1) or undrained CTS tests.Similarly, for the Goodwyn and Ledge Point coral sands,the liquefaction resistance in undrained uniaxial shear tests is greater than that in undrained bidirectional shear tests (Sharma and Ismail, 2006).
For isotropic consolidation, Figure 29 plots the variation of CSR againstNffor the saturated SCS coral sand subjected to the 90° jump rotation of principal stresses (Chenet al., 2021a; Maet al., 2020, 2022b;Qinet al., 2023a).It is observed that the relationship of CSR versusNfis almost the same at variousασfor the uncontrolledbvalue (b: 0↔1), as per Fig.29(a).However, when thebremains at a constant of 0.5, the relationship between CSR andNfis strongly influenced byασ.The curves of CSR againstNfatασ= 45° andασ= 0 are located at the bottom and top, respectively, where the liquefaction susceptibility of coral sand is almost the same atασ= 0 andασ= 90°, as shown in Fig.29(b).This discrepancy reflects the effect of stress-induced anisotropy on the liquefaction susceptibility of coral sandy soil.The implication is that the coral sandy soil is most susceptible to liquefaction atασ= 45°, which is consistent with the result of siliceous Nantong silt in Chenet al.(2020a).Likewise, Zhouet al.(2019,2020) reported the experimental results of isotropically consolidated, undrained CATC tests (b: 0↔1) on the saturated SCS coral sand withDr≈ 35% atασ= 0,22.5°, and 45°.They found that the relationship between CSR andNfrequired for initial liquefactionremains nearly unchanged at variousασ.Consequentially, the measured CSR-Nfcurves under variousασare fraught with inaccuracies at the uncontrolledbvalue.The critical implication in Fig.29(b) is that the conventional index CSR cannot uniquely characterize the liquefaction resistance for the various cyclic loading patterns and stress paths.However, in Fig.29(c), all data points (USR,Nf) fall within a narrow band, suggesting that a virtually unique power-law relationship exists between USR andNfat the similarDr, regardless of the cyclic loading patterns and stress paths (circular path, heart-shaped path; various 90° jump and continuous rotation paths;b:0↔1;b= 0.5).A key implication of this finding is that the coefficientsC1andC2in the USR formula (Eq.(7))play a vital role in normalizing the liquefaction resistance curve, effectively eliminating the effect of cyclic loading conditions, which is well in agreement with the results of siliceous sandy soils in Chenet al.(2020a).Figure 29(d)illustrates that the variations of USR withNfat variousDrare similar, where USR virtually decreases in the same power-law form asNfincreases and increases with increasingDr.These findings highlight the physical basis for the unique relationship between USR andNf,regardless of cyclic loading conditions.Especially for the SCS coral sandy soils with variousDrandFCbelowFCthsubjected to the 90° jump rotation of principal stress with variousασ, as shown in Fig.30, Wuet al.(2023a) found that liquefaction resistance USR15(USR in 15 cycles required to initial liquefaction) decreases asFCincreases at the sameDrand decreases in a powerlaw form asincreases.

Fig.27 Variations of CSR with Nf for saturated coral sands: (a) MICP-treated coral sand with diferent CS contents (data from Xiao et al., 2018); and (b) fiber-reinforced coral sand with different fiber contents (data from Zhou et al., 2023)

Fig.28 Correlation between the ratio of CRR to SPT/p′0 and the Nf correspond to the γga = 2.5% (data from Qin et al., 2023e, 2023f)

Fig.29 CSR plotted against Nf for (a) the uncontrolled b (0↔1) (data from Ma et al., 2020) and (b) b = 0.5 (data from Ma et al.,2020) under various cyclic loading patterns and stress paths; (c) USR plotted against Nf at Dr = 45% (compiled data from:Chen et al., 2021a; Ma et al., 2020, 2022b), and (d) USR plotted against Nf at variour Dr (compiled data from Chen et al.2021a; Qin et al., 2023a)

Fig.30 Variations of USR15 with a increase (a) in FC and (b) in equivalent skeleton void ratio for the saturated SCS coral sand(data from Wu et al., 2023a)
In addition, through undrained CTS tests on the SCS coral sand in Chenet al.(2021a), considering the influence ofp0′ andDron the liquefaction susceptibility,as shown in Fig.31, Maet al.(2023b) found that the normalized CSR based onWfdecreases in a power-law form asNfincreases, here,Wfis the cumulative energy dissipation of soil (Eq.(15)) to cause a single-amplitude shear strain ofγsa=2.5%.
3.2.3 Cyclic loading frequency effect
The loading frequencyfreported by Airey and Fahey(1991) has little to no effect on the liquefaction of coral sand.Hyodoet al.(1998) stated that the liquefaction of sand is not frequency-dependent over the range between that tested and that occurring in earthquakes, and it primarily depends on the number of loading cycles.The results of the above-mentioned undrained CTX tests by Wanget al.(2019) indicated the effect offon theNfrequired to causeεda= 5% is relatively small.The values ofNfrange from 46 to 50 cycles atf= 0.1 to 1.5 Hz, while theNfexhibits a noticeable increase atf=1.8 Hz at 58 cycles.Recently, via undrained MCHC tests on the saturated SCS coral sand in Chenet al.(2021a) subjected to the 90° jump of principal stress with variousασandf,as shown in Fig.32, the liquefaction resistance expressed as USR increases moderately asfincreases within the range of 0.05-1 Hz, yet the curve shapes of USR versusNfto causeγga=2.5% remain similar at variousf(Qinet al., 2023h; Yanget al., 2023a).So far, few investigations have been conducted addressing the effect offon the liquefaction resistance of saturated coral sandy soils.3.2.4 Stress-induced anisotropy effect

Fig.31 Correlation between energy-based normalized CSR and Nf corresponding to γsa =2.5% for the saturated SCS coral sand (complied data from Ma et al., 2023b)
The microstructural factors of coral sandy soils, such as fabric form and its evolution during loading at the microscopic scale, particularly in terms of anisotropy,can significantly affect the macroscopic liquefaction resistance.The contact density and inclination of particle contact in fabric form are two key microstructural factors influencing liquefaction resistance.
Through undrained CATC tests (b: 0↔1) on anisotropically consolidated, saturated SCS coral sand withDr= 30%, subjected to circular stress paths at 0p′ =100 kPa, and the different deviatoric stress ratioη, which is defined asη=q/p0′, it is observed that the liquefaction resistance corresponding toγga= 5%decrease asα0increases and asηdecreases.Forη=0.433, the curves of CRR versusNfatα0= 90° and 0 are located at the bottom (indicating the most susceptibility to liquefaction) and top of the graph, respectively, while the curves of CSR versusNfatα0= 60° and 90° are almost the same.For the fixedα0=0, the curves of CRR versusNfatη= 0.75, 0.60, and 0.433 are positioned at the top, middle, and bottom of the graph, respectively(Li, 2005; Yu, 2006).Recently, Zhouet al.(2019, 2020)investigated the influence of anisotropic consolidations on the liquefaction resistance for saturated SCS coral sand withDr≈ 35%, subjected to the 90° jump rotation of principal stresses (ασ= 0, 22.5°, and 45°;b: 0↔1).For isotropically and anisotropically consolidated tests,the liquefaction criteria are therupof near 100% and theγga= 5%, respectively.Atασ= 0 and 22.5°, the curves of CSR plotted againstNfatkc= 1, 1.5, and 2 are at the graph’s top, middle, and bottom (most susceptible to liquefaction), respectively.Precisely, atkc= 1.5, the curves of CSR versusNfatασ= 0, 22.5°, and 45° are positioned at the graph’s top, middle, and bottom.

Fig.32 Correlations between USR and Nf to cause γga =2.5% for all f, CSR, and ασ considered for the saturated SCS coral sand(compiled data from Qin et al., 2023h; Yang et al., 2023a)
Figure 33 compares the liquefaction resistance of the saturated SCS coral sandy soil subjected to different cyclic loading patterns and paths (Chenet al., 2021a).The specimens’ liquefaction resistance is strongly affected by cyclic loading patterns and paths.For the 90° jump of principal stress tests, the curves of CSR versusNfrequired to causeγga= 2.5% at differentασexhibit noticeable differences, and the specimen atkc=1.5 is the most susceptible to liquefaction atασ= 45°.For the continuous rotation of principal stress tests, the specimen under the anisotropic consolidation path along the bedding plane (α0= 90°) is the most susceptible to liquefaction.In contrast, at a specificα0, the specimens atασmaxranging from 45° to 67.5° are the most critical.Figure 34 compares the liquefaction susceptibility of the specimens subjected to the 90° jump of principal stress at variouskcandα0(Chenet al., 2021a).The number of cyclesNfincreases near linearly askcincreases.For any cyclic loading path (ασ),Nfdecreases asα0increases,while atασ= 45°, theNfis similar for any consolidation path.
For different anisotropic consolidations, as shown in Fig.35(a), the pairs of data points (USR,Nf) measured using undrained MCHC tests are still distinctly separated.They cannot fall within a narrow band (Chenet al., 2021a).Because of this, a universal formula of liquefaction resistance via the new proxy USRgto consider anisotropic consolidations was established(Chenet al., 2021a):
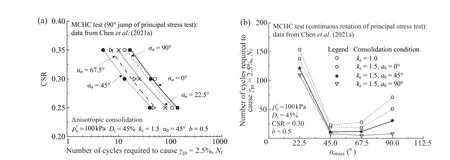
Fig.33 (a) Correlation between CSR and Nf obtained by the 90° jump of principal stress test and and (b) correlation between ασmax and Nf obtained by the continuous rotation of principal stress test for the saturated SCS coral sand (compiled data from: Chen et al., 2021a)
The details for determining the coefficientsD1andD2can be found in Chenet al.(2021a).For isotropic consolidation conditions,D1=D2= 1, leading to USRg=USR.
Figure 35(a) plots the variation of USRgagainstNffor all the data under the anisotropic consolidations(variouskcandα0) and cyclic loading conditions(different patterns and stress paths).All the data fall into a very narrow band, and a virtually unique relationship exists between USRgandNf.As in Fig.35(b), the general applicability of Eq.(19) is also validated by the original experimental data for the SCS coral sand in Li (2005).
4 Undrained deformation features
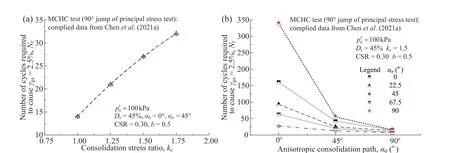
Fig.34 The influence of anisotropic consolidation conditions on the liquefaction resistance of saturated SCS coral sand (compiled data from: Chen et al., 2021a): (a) effect of consolidation ratios; and (b) effect of consolidation paths
The cyclic deformation characteristics primarily involve the stress-strain relationships of soils under cyclic loading.The focus here is on the small-strain shear modulusG0, the secant shear modulusGand damping ratioλover a wide strain range, and the shear modulus degradation of saturated coral sandy soils under cyclic loadings.TheGbelow a shear strain of 0.001% is generally termed theG0(Clayton and Heymann, 2001;Lianget al., 2023).G0can be represented by S-wave velocity (Vs) through the equationG0=ρVs2, whereρis the mass density of soil.Table 2 summarizes the basic index properties of coral sandy soils tested for undrained cyclic deformation characteristics of coral sandy soils in the literature.Figure 36 presents the PSDs of coral sandy soils in the literature.Research in this field has extensively explored the PSD range of soils with potential liquefaction susceptibility, and significant advancements have been made over the last two decades.In laboratory tests,G0is mainly determined by resonant column (RC)tests, bender element (BE) tests, and cyclic triaxial(CTX) tests.At the same time, the strain-dependentGandλand the shear modulus degradation are usually assessed using cyclic laboratory tests (e.g., CTX, CDSS,CATC).
TheG0,G, andλare three fundamental indices that provide insights into the mechanical behavior of soils under both static and dynamic loadings.They are also fundamental parameters for seismic site response analysis in which theue-based method is preferred for evaluating soil liquefaction.Additionally, they are crucial for geophysical characterization of geological profiles (e.g., Ishihara, 1996; Chenet al., 2016, 2019b,2022; Zhanget al., 2022; Lianget al., 2023; Qinet al., 2023g).
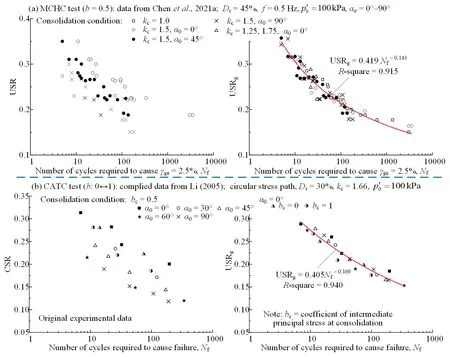
Fig.35 Variations of (a) USR with Nf (left) and USRg with Nf (right) obtained by MCHC tests for the saturated SCS coral sand subjected to various consolidation conditions and cyclic loadings (data from Chen et al., 2021); (b) variations of CSR with Nf (left) and USRg with Nf (right) obtained by CATC tests for the saturated SCS coral sand subjected to various consolidation conditions and circular stress paths (complied data from Li, 2005)
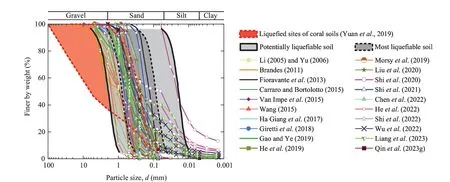
Fig.36 Particle size distributions of coral sand soils in the literature for shear modulus and damping ratio tests
Figure 37 schematically exhibits the shear stressstrain hysteresis loops of the first cycle (N= 1) and theNth cycle in an undrained CTX test on a saturated granular soil, as well as the definitions ofG0,G, andλ.It is observed that the skeleton curve degrades due to the generation ofueduring cyclic loading, leading to the initialG0Ndecrease with the number of cyclesN.Generally, the reduction ofGNis caused by the increasingγaand the decrease of effective stress resulted from theuebuild-up (Chenet al., 2022).
4.1 Small-strain shear modulus
4.1.1 Materials property effect
It is well recognized thatG0of siliceous sandy soils is strongly affected by types of particles (mineralogy,fabric form, morphology), material properties (e.g.,Cu,d50,FC) and physical state (e.g.,eorDr).In contrast, the effect of loading rate onG0of a siliceous sandy soil is negligible.Note that most of the previous experimental studies focused mainly on siliceous sands.The effects of the material properties and physical state of coral sands onG0have not been well studied (Lianget al., 2023).
By RC tests on the loose (Dr= 21%-26%), mediumdense (Dr=58%-59%), and dense (Dr= 91%) Cabo Rojo coral sands from beach in southwest of Puerto Rico at= 50-500 kPa, Catano and Pando (2010) found thatG0values of the loose and dense coral sands are much lower than those of the siliceous sands in the South Bend, Indiana at the similarDrandp0′.It was also found that the powerbof state variableein Hardin’smodel for predictingG0(Hardin and Black, 1966) is 1.953, which is larger than that of siliceous sands (Lianget al., 2023),and the stress powernin Hardin’smodel decreases linearly aseincrease.Through BE tests, Brandes (2011)reported that the values ofG0(S- wave velocity) for coral sands in the Hawaiian Islands (Maui Dune, Kawaihae Harbor) at similar normal stresses are lower than those for the siliceous Nevada sand.However, based on the results of RC tests on the loose (Dr= 14%-15%) and dense (Dr= 72%) coral sands taken from the Legendre field on the North West Shelf of Australia, Carraro and Bortolotto (2015) concluded thatG0values of coral sand are always higher than those of siliceous sandy soils with the similar particle shape, PSD,Dr, and0p′.
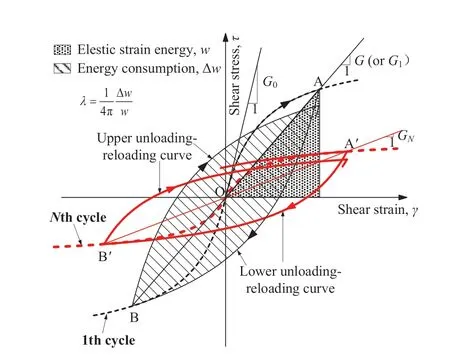
Fig.37 Idealized shear stress-strain relationships of granular soil in undrained CTX test
Recently, via RC tests on two types of coral sandy soils with similar PSDs (Dabaa sand: loose (Dr= 31%-37%) and dense (Dr= 71%-77%),FC= 8.75%; Agami sand: loose (Dr= 40%) and dense (Dr= 80%),FC=0.60%) at0p′ = 100-250 kPa, collected from on-shore along the North Coast of Egypt, Morsyet al.(2019)revealed that the powerband stress powernin Hardin’s model are 0.35 and 0.71 for saturated and sub-rounded Dabaa specimens, 0.2 and 0.58 for dry and angular Dabaa specimens, and 0.13 and 0.59 for saturated and sub-rounded Agami specimens.These results imply that thebandnvalues are significantly affected by coral sandy soils’ particle shape andFC.For the density state case, theG0values of dry Agami specimens are much larger than those of saturated Agami specimens.In contrast, theG0values of saturated and dry Dabaa specimens are nearly identical.Note thatG0values of Agami specimens for density state are much higher than those of saturated and dry Dabaa specimens, which can be attributed to much loweremaxandeminfor Agami coral sand.Shiet al.(2020) conducted multidirectional BE tests on coral sand collected from an artificial island in the Persian Gulf.Their results show thatG0decreases with increasedFCand becomes constant after reachingFCth(≈ 30%).They also found that the anisotropy ofG0decreases asFCincreases.The coefficientAand the stress powernin Hardin’s model exhibit a decreasing and increasing trend withFC, respectively; they become constant after reachingFCth.It’s worth noting that the calibratedn, which ranges from 0.63 to 0.77 for coral sandy soil, is larger than the typical range of 0.35-0.7 for siliceous sandy soils.Heet al.(2023) investigated the influence of PSDs onG0and the microscopic pore structure of SCS coral sands through BE tests and nuclear magnetic resonance tests.They found thatG0significantly decreases asCuincreases but slightly increases with larged50.The fractal dimension (Da),which reflects the complexity and irregularity of the pore structure, decreases with increasingCuand decreasingd50.The coefficientAand the stress powernare expressed as a function ofvariablesCuandd50.
Via RC tests on the saturated coral sandy soil located at the Nansha islands, South China Sea in Chenet al.(2021a), Wuet al.(2022) revealed thatG0increases with a decrease inFCbelow theFCth=30%.The stress powernin Hardin’smodel is a constant independent of theDrandFC, in which the mean value ofnis 0.56 for the Nansha coral sandy soil, andG0/ (p0′ /Pa)nincreases with increasingDr.As shown in Fig.38, a negative power-law relationship exists betweenG0/ (p0′ /Pa)nandfor the Nansha coral sandy soils with variousDrandFC.Using the RC test, Lianget al.(2023) measured theG0values of coral sandy soils with varyingFCs and gradations, sampled from the Nansha and Xisha islands,South China Sea.The particle shape of the Xisha coral sandy soils is more irregular than that of the Nansha coral sandy soils.Figure 39 compares the measured and the predictedG0by the updated Seed’s formula(Wichtmann and Triantafyllidis, 2009) for the Nansha and Xisha coral sandy soils.Clearly, there are significant differences in the measured and the predictedG0values for the Xisha and Nansha coral sandy soils.It implies that theG0of coral sandy soils is closely related to the regularity of coral sandy particles.Consequently, the reliability of the updated Seed’s formula is not guaranteed for coral sandy soils.
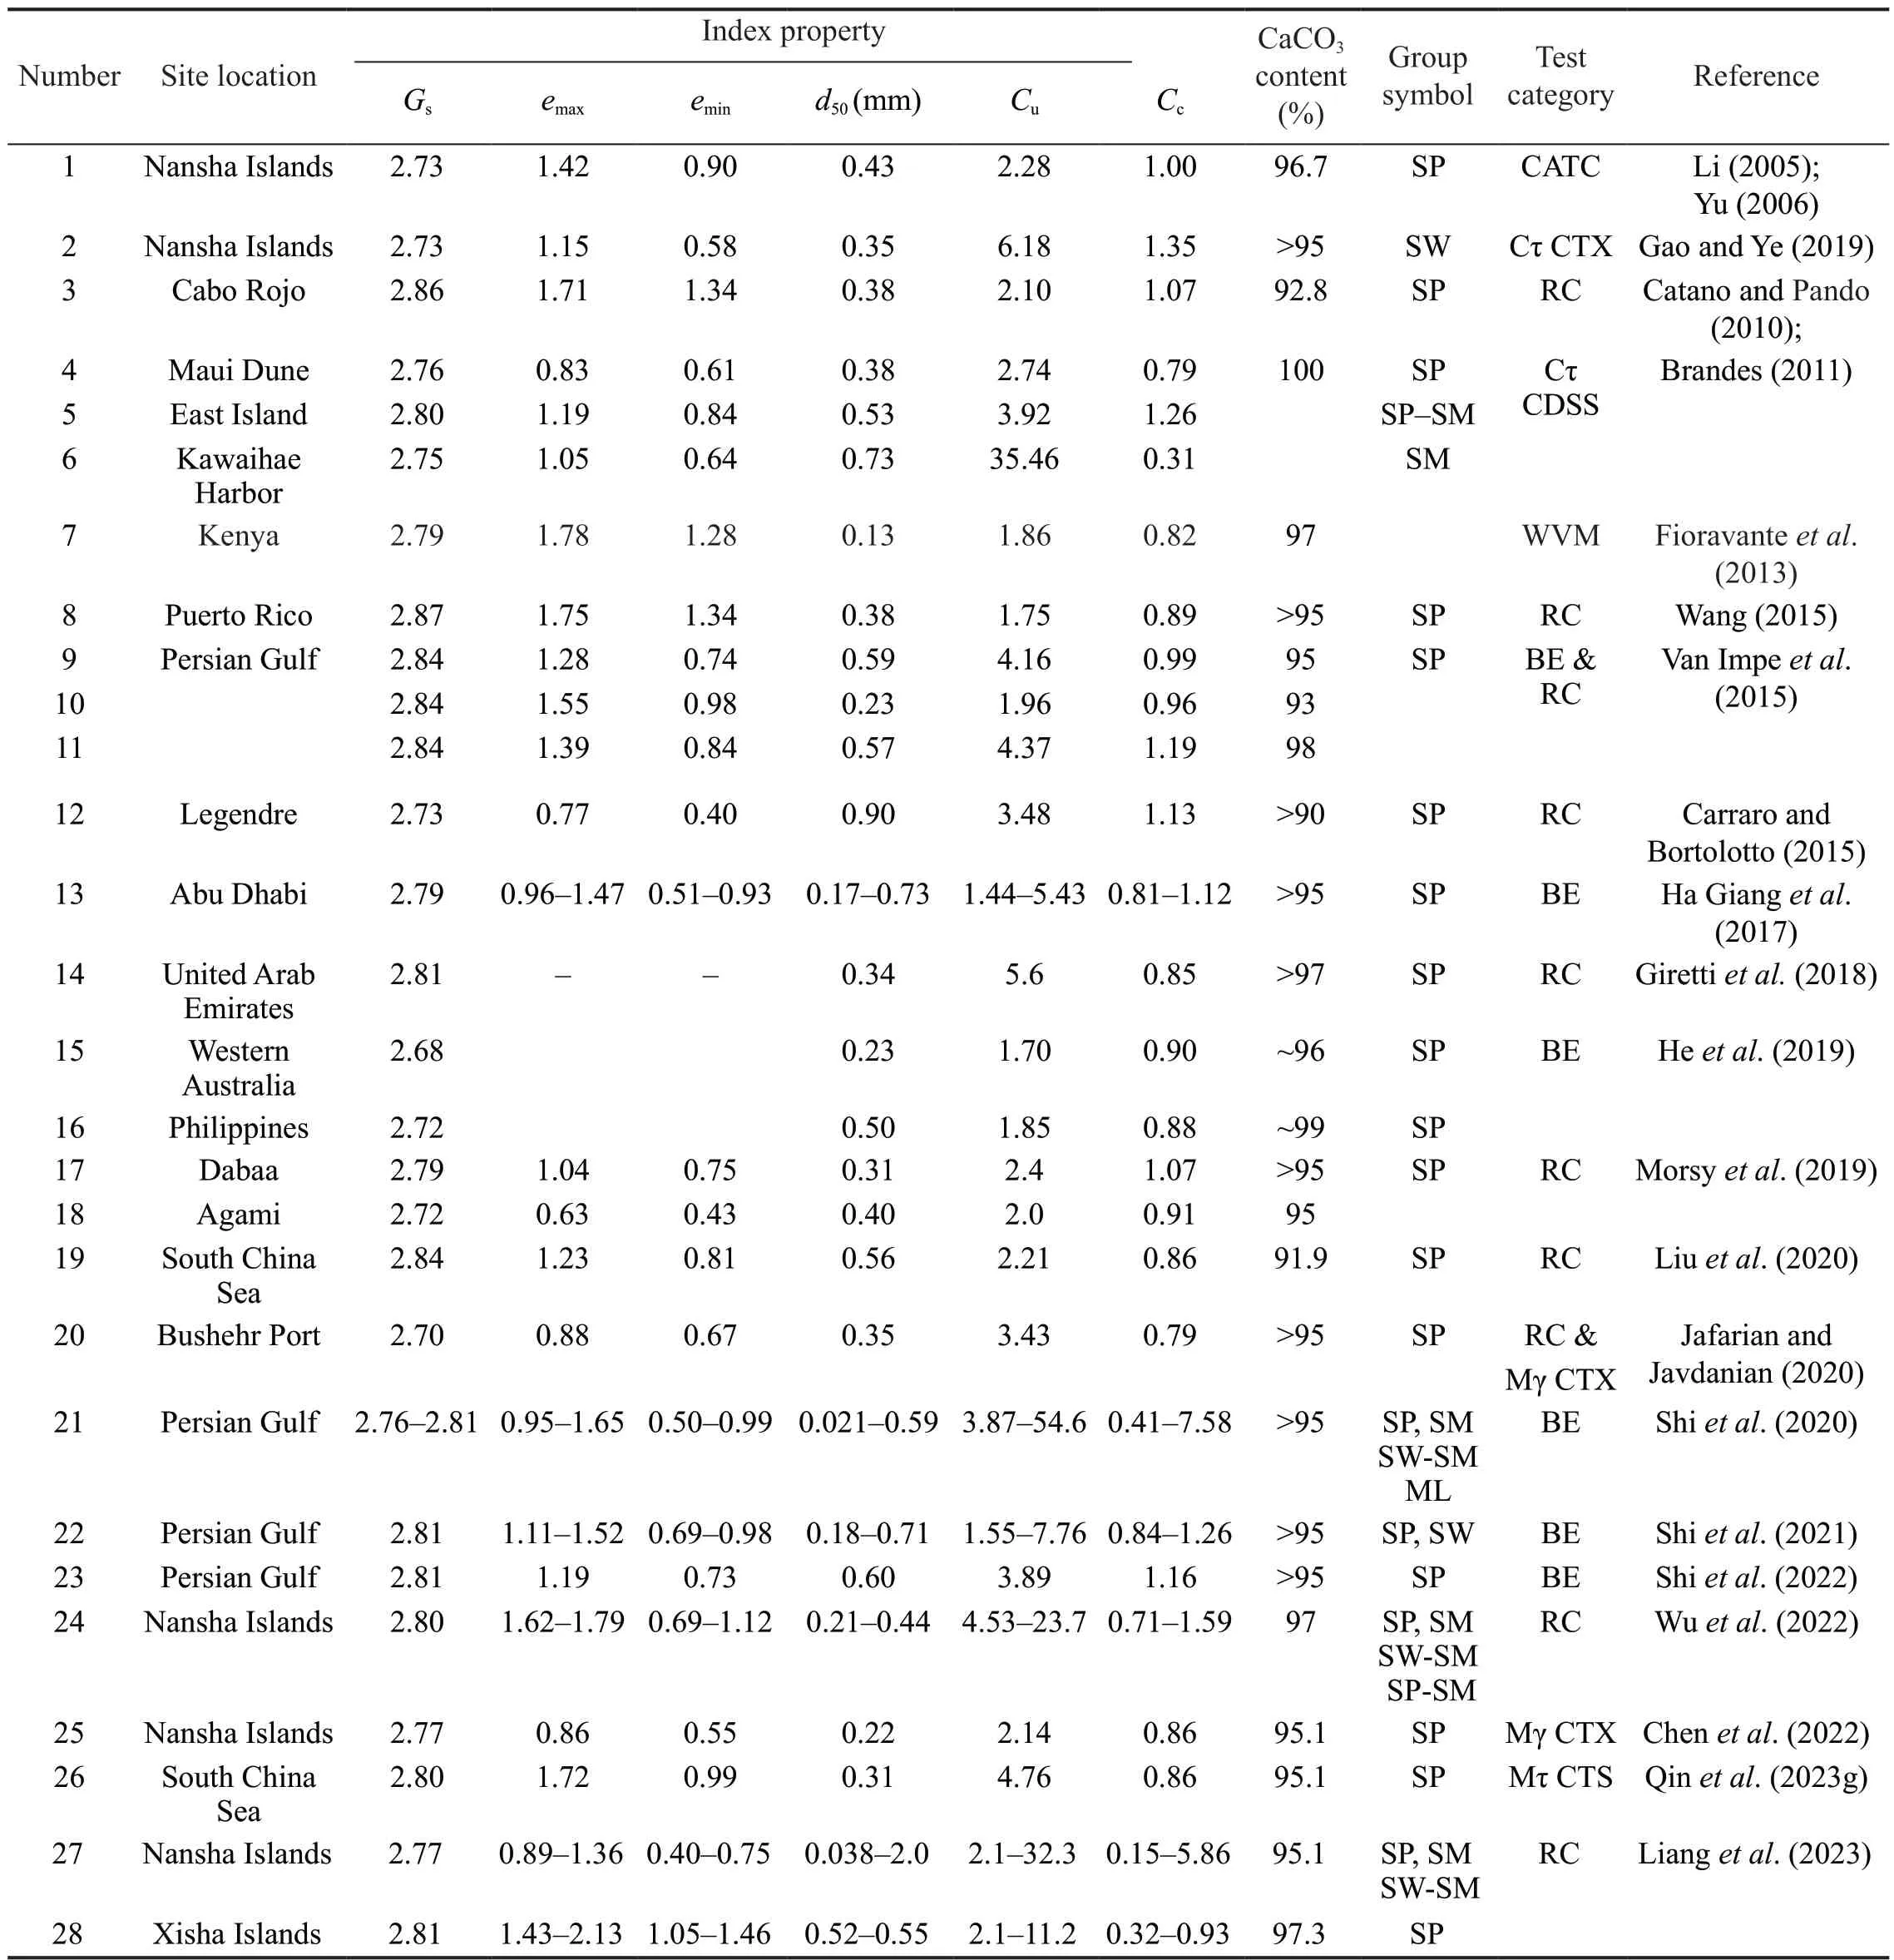
Table 2 Experimental studies on shear modulus and damping ratio of coral sandy soils in the literature
Figure 40 shows the graph ofG0againsteof the Nansha coral sandy soils.It can be observed thatG0-ecurves significantly shift to the left with increasingCuand shift to the right with increasingd50.Additionally,G0-ecurves initially shift to the left asFCincreases up to 20%, and reversely, they shift to the right with further increases inFC.Lianget al.(2023) revealed that power-law relationships exist between the minimum small-strain shear modulusG0minandemaxand between the maximum small-strain shear modulusG0maxandemin.Hence, an extreme void ratios-based unified formula ofG0was established for the tested coral sandy soils:

Fig.38 Variation of G0/(p′0/Pa)n with *esk for the saturated SCS coral sandy soils (data from Wu et al., 2022)
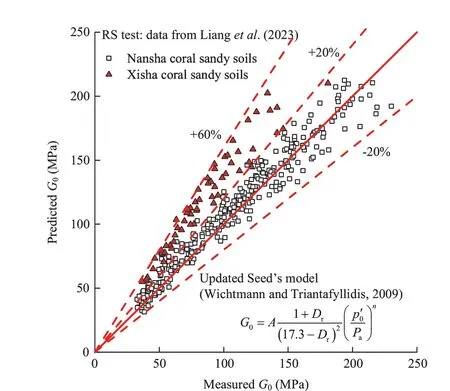
Fig.39 Comparison of the measured G0 and the predicted one by the updated Seed’s model for the saturated SCS coral sandy soils in the Xisha and Nansha islands (data from Liang et al., 2023)
As per Lianget al.(2023), the 1493 relevant test data for various sandy soils with different PSDs, particle shapes, and mineral compositions were obtained from 12 references.Of the 1493 test data validated in Lianget al.(2023), 1027 were siliceous sandy soil data, 57 were calcareous sandy soil data, and 409 were coral sandy soil data.It’s important to note that based on this dataset, the mean absolute value of the relative errors between the measured and the predictedG0using Eq.(20)was 10.4%.
4.1.2 Stress-induced anisotropy effect
Based on the results by Shiet al.(2022), the coefficients in the modified Hardin’s equation for predictingG0proposed by Fioravanteet al.(2013) were determined by:
wherep0′handp0′vare the horizontal and vertical effective confining stress, respectively;b,nh,nv, andmare the calibrated parameters for the tested coral sand.Shiet al.(2022) found thatG0of coral sand is highly spatially dependent, with notable variations between the horizontal and vertical planes.The anisotropyofG0decreases with increasingkc, and it is more affected by the stress history and stress path rather than the fabric form of the coral sandy soil.
Using HCA, Qinet al.(2023g) presented comprehensive results of multi-stage stress-controlled,undrained cyclic torsional shear (Mτ CTS) tests on the saturated SCS coral sandy soil in the Nansha islands in Chenet al.(2021a).The results indicated thatG0increases as0p′ increases and decreases asα0increases.However, the effect ofkcon theG0is nonmonotonic,asG0increases with increasingkcat theα0= 0, 22.5°,and 45°, but decreases askcincreases at theα0= 67.5°,and 90°.As seen in Fig.41, when using the anisotropic consolidation indexδ0introduced by Qinet al.(2023g)to quantify the effect of anisotropy consolidations onG0, it becomes evident that the data pairs ofG0andδ0fall within a narrow band, regardless of the anisotropic consolidations, andG0increases almost linearly asδ0increases.Consequently, a unified formula ofG0by modifying Hardin’smodel can be established as follows.
where the coefficientA′, the powerb, and the stress powernare the fitting constants related to soil type.
4.2 Secant shear modulus and damping ratio curves
4.2.1 Materials property effect

Fig.40 Variations of G0 with void ratio e of the saturated SCS coral sandy soils in the Nansha Islands (data from Liang et al., 2023):(a) effect of Cu; (b) effect of d50; and (c) effect of FC
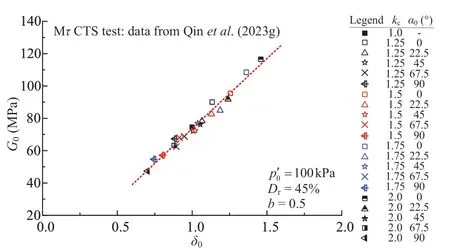
Fig.41 Correlation between G0 and index δ0 for the saturated SCS coral sandy soil (data from Qin et al., 2023g)
Based on the results of RC tests on the Cabo Rojo coral sand in Catano and Pando (2010), it is concluded that the siliceous South Bend sand exhibits higher strain-dependentGthan the Cabo Rojo coral sand under the similarDrand0p′, although no clear pattern is observed in material damping behavior.Furthermore,the variations ofGandλwithγaof Cabo Rojo coral sand are more dependent on the0p′ than the siliceous South Bend sand.Through CDSS tests on loose and dense coral sandy soils located in the Hawaiian Islands (Maui Dune, Kawaihae Harbor), Brandes (2011) found that the tendency curves ofG/G0andλfor the coral sands are lower than those for the clean siliceous Nevada sand at shear strain amplitudeγa= 0.05%-1%.TheG/G0-γacurves are insensitive to CSR.Meanwhile, the Kawaihae Harbor coral sandy soil with highFCsubstantially exhibits larger damping than the Maui dune coral sandy soil atγaabove 0.2%.However, the results of RC tests on the Legendre coral sands in Carraro and Bortolotto(2015) demonstrated that the coral sand exhibits fasterG/G0reduction and largerλvalue at the sameγathan its siliceous sand counterparts with similarDrandp0′.
The results of RC tests on the Dabaa and Agami coral sandy soils in Morsyet al.(2019) revealed that no noticeable difference exists between G-γacurves for saturated and dry Dabaa sandy soils with differentDr.Additionally, Catano and Pando (2010) reported that theG/G0values for Dabaa coral sandy soils are similar to those for Cabo Rojo coral sand at lowerγa, while they are slightly higher at higherγa.In terms of theλvalues, for Dabaa coral sandy soilsλdecreases asp0′ increases whenγais above 0.01%, but there is no significant tendency for the effect ofp0′ onλat lowerγa.Meanwhile, the data points (G/G0,γa) of saturated Dabaa and Agami coral sandy soils are within the data point range of siliceous gravels in Rollinset al.(1998), while for dry Dabaa sand coral sandy soils, the data points (G/G0,γa) seem to be closer to the upper bound of siliceous gravels in Rollinset al.(1998).At the same time, the data points ofλagainstγaof saturated and dry Dabaa coral sandy soils almost match the lower bound of siliceous sandy gravelly soils proposed by Seedet al.(1986), while for saturated Agami sand, the data points ofλagainstγaare mainly within the upper and lower bounds proposed by Seedet al.(1986).
Via isotropically consolidated, multi-staged straincontrolled undrained cyclic triaxial (Mγ UCTX) tests on the SCS coral sand withFC= 6.4%, Figure 42 plotsG/G0againstγaandλagainstγaat variousDrandp0′, in which theG/G0andλvalues are calculated by using a correlation-function-based method with higher precision at both small and large strain levels (Chenet al., 2022).It is observed that the data points (G/G0,γa) for the SCS coral sand fall in the upper half of the range proposed by Liuet al.(2020) for seven coral sands, and the upper bound ofG/G0-γafor the SCS coral sand is slightly higher than that of the seven coral sands from Liuet al.(2020) forγa= 0.01% - 0.05%.Compared to the range ofG/G0-γafor siliceous sands (Oztoprak and Bolton, 2013)and siliceous gravels (Rollinset al., 2020), the ranges for the coral sands in Chenet al.(2022) and in Liuet al.(2020) shift upward.Thus, an important implication is that theG/G0reduction rate of the coral sands is lower than that of siliceous sands and gravels, indicating a weaker nonlinearity of coral sands than siliceous sands and gravels.It also can be inferred that the difference in the variation ofG/G0againstγamay be attributed to the substantial differences in particle shape and mineral composition between them.Note that the rate ofuebuildup in coral sands is much lower than that in siliceous sands under undrained cyclic laboratory tests (Chenet al., 2021a; Maet al., 2022b).Therefore, theG/G0reduction of coral sands caused by the increase ofueandγawill be slower.In addition, theλvalues of the SCS coral sand are almost constant forγabelow 0.01% and increase rapidly with increasingγawhenγais above 0.01%.This result is consistent with the finding of Chenet al.(2006,2016) that small energy dissipation exists even at very small strain levels for soils.Compared to the bounds ofλagainstγafor seven coral sands in Liuet al.(2020), the range ofλagainstγaof the SCS coral sand in Chenet al.(2022) is much narrower, and the correspondingλvalues are remarkably higher forγaabove 0.3%.Meanwhile, the increasing rate ofλwithγafor the coral sands, reported by Chenet al.(2022) and Liuet al.(2020), is slower than that for siliceous Toyoura sand (Kokusho, 1980) and gravels (Rollinset al., 2020) whenγais below 0.02%.Theλvalues are lower than those of siliceous Toyoura sand and gravels forγa= 0.01% - 0.1%.
By RC tests, Wuet al.(2022) investigated the effect ofFCon theGof saturated SCS coral sandy soil reported by Chenet al.(2021a) over a wide strain range, revealing that theG/G0-γacurve shifts slightly to the left with increasingFCbelowFCth.On the other hand, theG/G0versusγacurve shifts slightly to the right with increasingp0′.Meanwhile, the effect ofDron theG/G0-γacurve was found to be negligible.As shown in Fig.43(a), the data points ofG/G0versusγafor the SCS coral sandy soils with variousFCs fall in the range of siliceous sandy soils created by Seed and Idriss (1970)and fall in the lower half of the range for siliceous sands as reported in Oztoprak and Bolton (2013) and terrestrial soils (clay, silty clay, silt, sand, muddy soil) as per Yuanet al.(2000), whereas forFC= 30%, the data points (G/G0,γa) for the SCS coral sandy soils lower than the lower bound created by Yuanet al.(2000) and Kokusho (1980).Thus, it can be concluded that theG/G0reduction rate of coral sandy soils with higherFCis higher than those of terrestrial soils, indicating that coral sandy soils with higherFCexhibit a stronger nonlinearity than terrestrial soils.This result is consistent with the finding of Wuet al.(2023b) that the rate ofuebuild-up increases asFCincreases (Fig.8(f)).In Fig.43(b), it is observed that a virtually negative power-law relationship exists between the reference shear strainγrin the Davidenkov skeleton curve (Martin and Seed, 1982; Chenet al., 2021b)normalized byand thefor the SCS coral sandy soils with variousFCs andDr.
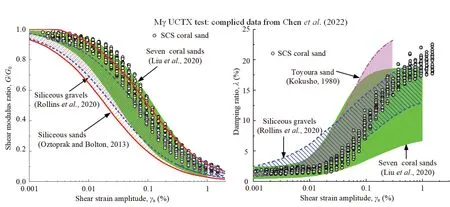
Fig.42 (a) Shear modulus reduction G/G0 plotted against γa and (b) damping ratio λ plotted against γa measured using in Mγ UCTX tests at various Dr and (compiled data from Chen et al., 2022)

Fig.43 (a) Variation of G/G0 with γa and (b) reference shear strain γr with for the saturated SCS coral sandy soils with various FC (data from Wu et al., 2022)
4.2.2 Stress-induced anisotropy effect
Through undrained CATC tests (b: 0↔1) on the saturated SCS coral sand subjected to a circular stress path, Li (2005) and Yu (2006) revealed that the relationships betweenG/G0andγa/γrare quite similar under various consolidated conditions (varying initial intermediate principal stress coefficientsb0,η0, andp0′)and differentDr(30% and 55%), whereγris the reference shear strain in the hyperbolic stress-strain relationships;and the relationships betweenλandγaare mainly affected byDr,α0, andp0′.
Based on the above Mτ CTS test results on the SCS coral sand, Qinet al.(2023g) defined an anisotropic consolidation indexδrto quantify the effect of anisotropy consolidations on the strain-dependentGas follows:
Thus, a unique formula of theG/G0versusγawas established by correctingγrin the expression of the Davidenkov skeleton curve (Martin and Seed, 1982;Chenet al., 2021b):
Figure 44 shows that the measured and predicted strain-dependentGover a wide strain range fall within 15% of both sides of the bisecting linefor the tested SCS coral sandy soil.
4.3 Cyclic degradation on shear modulus
Few studies have investigated the cyclic degradation behavior of shear modulus for saturated coral sandy soils.Chenet al.(2022) conducted undrained, isotropically consolidated, constant-amplitude strain-controlled (Cγ)and variable-amplitude strain-controlled (Vγ) CTX tests on the SCS coral sand reported in Chenet al.(2021a).Figure 45 shows that the degradation patterns ofGN/G0in undrained Cγ CTX test and Vγ CTX test are quite different.The variation ofGN/G0withNexhibits monotonic degradation in the Cγ UCTX test.In contrast,it shows cyclic degradation with fluctuation due to the variation ofγain the Vγ UCTX test.This feature indicates that the cyclic degradation of shear modulus depends on theuegeneration and the strain history applied in the cyclic loading tests.
Yanget al.(2023b) conducted isotropically consolidated, multi-stage and single-stage, undrained MτCTS tests on the saturated SCS coral sandy soil in Chenet al.(2021a) at variousf.As shown in Fig.46,forγaabove the threshold shear strainγth, in which no shear modulus degradation andueare generated whenγais less thanγth, the modulus degradation indexδd(defined as the ratio of theGat theNth cycle to theG0at the first cycle) decreases in a power function form asγaincreases,irrespective of cyclic loading conditions.
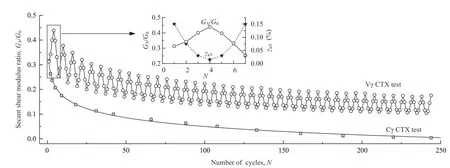
Fig.45 Variations of GN/G0 with N for the isotropically consolidated, saturated SCS coral sand specimens in Cγ and Vγ cyclic triaxial tests (data from Chen et al., 2022)

Fig.46 Effect of CSR and f on the correlation between modulus degradation index δ and shear strain amplitude γa for the saturated SCS coral sand (data from Yang et al.,2023b)
5 Summary and prospectives
Coral sand soil is unique due to its peculiar mechanical properties.Limited studies of undrained cyclic response features of coral sand soils are available.This paper provides an overview of the state-of-the-art on the undrained behavior of saturated coral sandy soils during the last three decades.The major conclusions are summarized as follows:
(1) The depositional environment of coral sandy soil profoundly influences its particle shapes and fabric forms.Coral sandy soil exhibits an initial contraction followed by varying degrees of dilatancy.The undrained monotonic shear behaviors of coral sandy soil are closely related to the relative density (Dr), particle gradation,consolidation conductions, and stress path of monotonic shearing.The South China Sea (SCS) coral sandy soil exhibits shear contraction until the phase transformation point, after which it exhibits an inherent continuous dilatancy as deviatoric stress increases.
(2) The pattern of excess pore water pressureuebuild-up in coral sandy soil is collectively affected by its types (mineralogy, fabric form, morphology), material properties (fines contentFC, particle gradation), physical state (Dror void ratioe), consolidation conditions,and cyclic loading conditions (loading pattern, stress path, and frequencyf).A fixed intermediate principal stress coefficient (b) value during multidirectional cyclic loadings is necessary to eliminate the influence of varyingbvalues on the undrained behavior of coral sandy soil.In a similar situation, the rate ofuegeneration in coral sandy soil is generally lower than that in siliceous sandy soil, leading to a lower liquefaction susceptibility for coral sandy soils than their siliceous counterparts.The mechanics of triggering liquefaction instability of saturated coral sandy soils are characterized by flow failure, cyclic mobility, or plastic strain accumulation,depending onDr, consolidation conditions, and cyclic loading conditions.MICP-treated and fiber-reinforced methods are available to reduce the rate ofuegeneration and to mitigate the liquefaction susceptibility of saturated coral sandy soils.
(3) The liquefaction susceptibility of coral sandy soil is synthetically affected by its type, material properties and physical state, consolidation, and cyclic loading conditions.A unique relationship exists between the stress ratio (SPT/p0′) in undrained monotonic shearing and the cyclic resistance ratio (CRR) in undrained cyclic laboratory testing for saturated coral sandy soil,irrespective of its type, material properties, consolidation,and cyclic loading conditions.
(4) The small strain shear modulusG0of coral sand soils, as well as the variations of shear modulus reduction (G/G0) and damping ratio (λ) with shear strain amplitude (γa), are affected by its type, material properties and physical state, saturated degree, and consolidated conditions.The relative larger or smaller relationships of the values ofG0,G/G0,andλfor coral sand soil and siliceous sandy soil are complex under similar conditions.
(5) Novel findings from Chen and his co-workers’cyclic laboratory studies of the saturated SCS coral sandy soils withFCbelowFCthunder various complicated cyclic loadings cover the main components of the liquefaction susceptibility and cyclic deformation characteristics, collectively termed the invariance theory of saturated sandy soil liquefaction under different cyclic loadings, mainly including the following aspects:
(a) The impacting mechanism of any single factor of the index properties and physical state variables of coral sand soil, complicated consolidation and cyclic loading conditions on the pattern ofuegeneration is qualitatively characterized (see Fig.8).The coral sandy soils before initial liquefaction under cyclic loadings can be regarded as a rate-dependent, shear-thinning non-Newtonian fluid.Hence, the apparent viscosityηand the average flow coefficientka, are suitable proxies for the quantitative interpretation of progressive liquefaction mechanisms and the precise identification of liquefaction triggering(see Figs.10-12).Moreover, the morphological reversal point of the gradient Δη/ηor Δka/kaagainstrupis the critical point of the solid- liquid phase change, and therupvalue at the critical point is related to the types of sandy soil, which is about 0.9 for the SCS coral sandy soil,regardless ofDr,0p′, and complicated cyclic loading conditions (Fig.13).The ratio of the deviator strain rate qγ˙tofis a simple proxy to distinguish the failure regime of cyclic mobility from the plastic strain accumulation(Fig.14).
(b) An invariable form (Eq.(2)) of the relationships exists between generalized shear strain amplitudeγgaand peak EPWP ratiorup(Figs.15 and 16), and an invariable combination form (Eq.(12)) of the relationships exists betweenrupand cycle ratio (N/Nf) (Fig.20), irrespective of index properties and physical state of sandy soils,consolidation conditions, and complicated cyclic loading conditions.
(c) Under isotropic consolidations, an invariable form (Eq.(4)) of the correlations exists between deviatoric strain amplitudeγqaandrupunder cyclic axialtorsional loadings, regardless of cyclic loading path and CSR (Fig.17).For the cyclic torsional loading, a simple form (Eq.(5)) of the relationships between shear strain amplitudeγaandrupis unique, regardless ofFC,Dr, and CSR (Fig.18).Meanwhile, the relationship betweenrupand cumulative energy dissipationWccan be expressed as any of the two invariable forms (Eqs.(16) and Eq.(18)),regardless of complicated cyclic loading conditions over a wide low-frequency range (Figs.23 - 25).
(d) Under isotropic consolidation, a power-law correlation exists between USR andNf(Fig.29(c)), the form of USR versusNfcurves at variousfis unique(Fig.32), irrespective of complicated cyclic loading patterns and stress paths.In particular, liquefaction resistance USR15in 15 cycles decreases in a powerlaw function form as the equivalent skeleton void ratioincreases (Fig.30(b)).Moreover, the relationship between the generalized unit cyclic stress ratio USRg andNfis virtually unique, irrespective of consolidation conditions and complicated cyclic loading conditions(see Fig.35(right)), and the cumulative energy dissipation-based normalized CSR decreases generally in a power-law function form asNfincreases (Fig.31).
(e) For isotropic consolidations, a unique correlation(Eq.(20)) between extreme void ratios (maximumemaxand minimumemin) andG0exists for coral and siliceous sandy soils.In addition, the state indexcan be used as a single indicator to capture the effect ofFCandDronG0andstrain-dependentG/G0of coral sandy soils withFCbelowFCth(Figs.38 and 43(b)).The anisotropic consolidation indexesδ0andδrcan be used as single indicators to capture the effect of anisotropy consolidations onG0and strain-dependentG/G0(Eqs.(22)and (23); also see Figs.41 and 44).Furthermore, a unique relationship exists between modulus degradation indexδdand shear strain amplitudeγaunder undrained cyclic torsional shearing (Fig.46).
Note that the invariable form of strain-based, stressbased, or energy-basedruformulas, as well as the unique formula for liquefaction resistance curves in terms of clear physics-based USR or USRg (defined in Chenet al.(2020, 2021a)), have been consistently confirmed using the original experimental data for various sandy soils from the literature.In addition, the morphological reversal of the gradient Δη/ηor Δka/kawithrupis an inherent physical phenomenon associated with the solid-liquid phase change for saturated sandy soils when considered as an equivalent viscous material, and therupvalue corresponding to the reversal point only depends on the type of saturated sandy soils.
The undrained cyclic response nature of saturated coral sandy soils and their liquefaction susceptibility remains a topic to be investigated.To resolve the fundamental problems involving the liquefaction mechanism and the whole-life safety assessment of coral sandy soil sites under complicated cyclic loadings associated with earthquake events and marine environments, future research directions are proposed in this paper as follows:
(1) Comprehensive laboratory experimental and theoretical studies are needed to quantitatively characterize the inherent anisotropy of coral sandy soils and its influence on the dynamic mechanical properties.A micromechanical model is desirable to quantify the inherent anisotropy of coral sandy soil precisely and to clarify the micro-mechanism of the influence of intrinsic anisotropic factors on the liquefaction susceptibility and strain-dependent modulus.Furthermore, the difference in the liquefaction susceptibility and deformation nature of coral sandy soils in different sea regions worldwide must be studied in-depth through cyclic laboratory tests.
(2) Cyclic laboratory tests on saturated coral sandy soils subjected to complex static stress and cyclic loading conditions are essential.It is desirable to find a quantitative proxy for characterizing the overall deformation at the soil element level and establish a unique correlation betweenpore pressure ratioruand quantitative proxy.Afterward, a unique correlation form of the cyclic shear-volume strain coupling effect should be developed, as well as the correlation between the progressive generation ofuebuild-up during undrained conditions and the accumulated volumetric strain during drained conditions.Note that these correlations should be independent of the physical and static stress states of coral sandy soils and the complicated cyclic loading conditions.
(3) Cyclic laboratory tests on saturated coral sandy soils should consider the influence of loading frequency.It is desirable to reveal the EPWP generation characteristics and establish a time-varyinguemodel for precisely capturing the alternating contraction-dilation behavior in pre- and post-liquefaction and to develop a nonlinear constitutive model in which the shear stressstrain skeleton curve and hysteretic rules are integrated with the time-varyinguemodel.
(4) Conducting undrained cyclic laboratory tests on saturated coral sandy soils under multidirectional cyclic loadings with various frequencies, amplitudes,and phase differences for extreme earthquake events and ocean dynamics environments is also essential.Further research should aim to describe the time-space evolution of complicated cyclic stress paths mathematically, and stress states at soil element level when subjected to strong earthquake shaking-sea waves simultaneously.In addition, it is necessary to elucidate the characteristics and describe patterns of this complicated cyclic loading and to clarify the undrained response behaviors of saturated coral sandy soils under extremely complex cyclic loadings.
Acknowledgment
The financial support provided by the National Natural Science Foundation of China (52278503) is gratefully acknowledged.
杂志排行
Earthquake Engineering and Engineering Vibration的其它文章
- A novel mitigation measure for normal fault-induced deformations on pile-raft systems
- Time-domain dynamic constitutive model suitable for mucky soil site seismic response
- Finite element model updating for structural damage detection using transmissibility data
- Experimental study on seismic reinforcement of bridge foundation on silty clay landslide with inclined interlayer
- Longitudinal vibration characteristics of a tapered pipe pile considering the vertical support of surrounding soil and construction disturbance
- Resilient performance of self-centering hybrid rocking walls with curved interface under pseudo-static loading
