Time-domain dynamic constitutive model suitable for mucky soil site seismic response
2024-02-23DongQingChenSuJinLiguoZhouZhenghuaandLiXiaojun
Dong Qing, Chen Su, Jin Liguo, Zhou Zhenghua and Li Xiaojun
1.Architectural Engineering Institute, Huaiyin Institute of Technology, Huai’an 223600, China
2.Key Laboratory of Urban Security and Disaster Engineering of Ministry of Education,Beijing University of Technology, Beijing 100020, China
3.Institute of Geophysics, China Earthquake Administration, Beijing 100089, China
4. College of Transportation Science and Engineering, Nanjing Tech University, Nanjing 211816, China
Abstract: Soil nonlinear behavior displays noticeable effects on the site seismic response.This study proposes a new functional expression of the skeleton curve to replace the hyperbolic skeleton curve.By integrating shear modulus and combining the dynamic skeleton curve and the damping degradation coefficient, the constitutive equation of the logarithmic dynamic skeleton can be obtained, which considers the damping effect in a soil dynamics problem.Based on the finite difference method and the multi-transmitting boundary condition, a 1D site seismic response analysis program called Soilresp1D has been developed herein and used to analyze the time-domain seismic response in three types of sites.At the same time, this study also provides numerical simulation results based on the hyperbolic constitutive model and the equivalent linear method.The results verify the rationality of the new soil dynamic constitutive model.It can analyze the mucky soil site nonlinear seismic response, reflecting the deformation characteristics and damping effect of the silty soil.The hysteresis loop area is more extensive, and the residual strain is evident.
Keywords: seismic response; time-domain dynamic constitutive model; logarithmic dynamic skeleton; dampening effect; mucky soil
1 Introduction
The nonlinear seismic response analysis of soil is mainly composed of a suitable soil dynamic constitutive model and a stable numerical analysis method.Before the dynamic response analysis of the soil layer, the dynamic characteristics of soil under dynamic load needs to be understood to determine the constitutive model of soil.Soil has prominent nonlinear characteristics, and it can manifest itself even under the action of small amplitude ground motion (Duncan and Chang, 1970; Chenet al.,2021).The nonlinear behavior of soil becomes more and more evident with the increase of ground motion intensity,and how to describe the stress-strain relationship of soil under dynamic action is particularly critical.The stressstrain relationship of soil depends on its physical and mechanical properties and external loading conditions(Roscoeet al., 1963; Lade and Duncan, 1975; Dafalias and Manzari, 2004; Dellowet al., 2011; Sunet al.,2013; Tafili and Triantafyllidis, 2020), such as density,water content, void ratio, confining pressure, rigidity,shear strength, stress loading path, loading strength,loading frequency, and loading history.Therefore, the stress-strain relationship of soil is more important than the numerical analysis method in the nonlinear seismic response analysis of the site.
The nonlinear characteristics of soil are an essential factor that must be considered in analyzing the seismic response of the site.Whether the dynamic constitutive model can truly represent the nonlinear characteristics is crucial to site nonlinear seismic response calculation reliability.The equivalent linear method (ELM) is often used in 1D site nonlinear seismic response analysis, but its essence is a linear method based on the average hysteresis curve (Li, 1992; Kaklamanoset al., 2013; Adampiraet al.,2015).Relevant research shows that ELM seriously reduces intermediate frequency (frequency band determined by site condition) seismic motions with a specific bandwidth, but increases the corresponding high and low-frequency ones, then overestimates the nonlinear effect of high and low frequency; that is, noticeable amplification effect of intermediate frequency seismic motions (often seen as “resonance” effect) (Sugitoet al.,1994; Assimaki and Kausel, 2002; Wanget al., 2010;Sun and Yuan, 2020), in addition, ELM cannot reflect the plastic deformation of soil.To solve the deficiency of ELM, scholars have carried out extensive research on the time-domain dynamic constitutive model of soil(Prevost and Keane, 1990; Boulonger and Ziotopoulou,2019; Yaoet al., 2019).In engineering practice, the soil constitutive model is mainly determined according to the empirical formula.The empirical formula is based on the shear modulus test data to obtain the experimental characteristic quantity, thus determining the empirical relation of stress-strain skeleton curve.Combined with certain loading and unloading criteria, the constitutive model of soil is obtained.The most basic stress-strain constitutive model is the Masing model (Masing, 1926;Rosenblueth and Newmark, 1971; Yniestaet al., 2017),and its stress-strain relationship under irregular loading and unloading is made up of the skeleton curve.The primary focus is on the experimental data and the two times loading-unloading rule regarding the skeleton curve.The biggest problem of the Masing model is that it does not satisfy the experimental damping curve.Pyke modified the “two-fold” relation in the Masing rule to“N-fold”, which improved the feasibility of the model,but this constitutive relation does not have symmetry(Pyke, 1979; Ray and Woods, 1988).The threeparameter Davidenkov constitutive model proposed by Martin and Seed (1982) can be used to describe the nonlinear dynamic characteristics of all kinds of soils in an ideal way, and abundant experimental data have been accumulated (Martin and Seed, 1982; Prevost and Keane,1990; Ruanet al., 2017).Chen developed the simplified loading-reloading rule instead of the upper boundary criteria of the extended Masing rule, Davidenkovmodel based, reducing the amount of recorded data in the program implementation (Zhuang and Chen, 2006;Chenet al., 2019, 2021; Ruanet al., 2019).However,these constructs are only applicable to the soil under small strain, and the nonlinear characteristics of soil are not obvious enough.Considering that additional judging rules are needed for the Masing model to be used for irregular cyclic loadings, called the extended Masing rules, and the judging rules cannot be expressed in simple, functional forms, Li and Liao (1993) presented the concept of the dynamic skeleton curve based on the modified skeleton curve.However, the constitutive formula of these models can not consider the influence of damping on the dynamic response of soil, especially the stress-strain development law of complex sites with soft soil under seismic load.
The ELM is usually used for site nonlinear seismic response analysis.However, it can still cause a “resonance effect” under seismic motion, and the method applied to the soft soil layer cannot obtain reasonable results.The time-domain analysis method considered the fitting test curves of damping and stiffness ratios, and compared them with the actual records to verify their applicability(Hardin and Drnevich, 1972; Luet al., 2008; Liao and Yang, 1995).It is feasible to establish a soil dynamic constitutive model based on the simulation test.However, numerical simulation results show that the hysteresis curves of existing soil dynamic constitutive models are narrow; the corresponding hysteresis loops underestimate the damping effect of soil.Hence, by modifying the soil dynamic constitutive model to consider the damping effect, the process method is often complex and not convenient for programming implementation.
Based on the hyperbolic dynamic skeleton curve(HDSC) (Li, 1992; Liet al., 1994), this study proposes a logarithmic function to replace the hyperbolic function as a skeleton curve.According to the essential characteristics of the soil skeleton curve, a logarithmic skeleton curve (LSC) which can reflect the test modulus radio curve, is configured based on the logarithmic function.At the same time, the concepts of “modified dynamic skeleton curve” and “damping ratio degradation coefficient” are introduced to the logarithmic dynamic skeleton constitutive model (LDSCM), depicting both the shear modulus and the damping of soil (Luet al.,2008).In LDSCM, the stress-strain at the loading and unloading turning point is the reference stress-strain.The asymptote of the skeleton curve rises slowly, and the hysteresis loop is wider.The stress-strain relationship can better simulate the damping effect and the plastic characteristics of the soil.
Based on the logarithmic dynamic skeleton stressstrain relationship, the time-domain numerical simulation for site nonlinear seismic response is proposed.Based on boundary conditions, initial conditions, motion equation,and LDSCM, a 1D site was developed herein with a timedomain nonlinear seismic response analysis program called Soilresp1D on the Microsoft Visual C++ 6.0 platform.The program can easily and quickly calculate the seismic response at any site depth.The nonlinear seismic response analysis of different types of sites is realized by self-programming.A comparison with the results of the hyperbolic dynamic skeleton constitutive model (HDSCM) and ELM verifies the feasibility of the dynamic constitutive model proposed by the authors and the rationality of numerical simulation of soil layer seismic response.
2 Logarithmic dynamic skeleton constitutive model (LDSCM)
For the dynamic stress-strain relationship study,physical or mathematical models are used as the main model.The constitutive model is configured by fitting test data or choosing physical elements.Soils under cyclic dynamic load have two essential characteristics:nonlinearity and hysteresis.The stress-strain curve of a reasonable dynamic constitutive model should be able to delineate a corresponding hysteretic loop within a cyclic period.The size and shape of the hysteretic loop will influence the dynamic characteristics, such as modulus,damping, and nonlinearity.The stress-strain hysteresis loops of soil under different amplitudes should also be different.The turning point trajectories of the hysteresis loops under different amplitudes form the constitutive stress-strain skeleton curve, which is also the stressstrain curve of the soil subjected to initial loading.The tangent of the curve reflects the shear modulus of the soil, and the area of the hysteretic loop reflects the soil damping.The hysteresis curve corresponds to the stressstrain relationship of soil under loading and unloading.Therefore, the skeleton and hysteretic curves constitute the entire stress-strain relationship of the soil.
2.1 Logarithmic dynamic skeleton curve (LDSC)
2.1.1 Determination rule of LDSC
Skeleton and hysteretic curves are two primary components of the nonlinear dynamic constitutive stress-strain relationship; the skeleton curve and loadingunloading criteria determine the hysteretic curve, so choosing the skeleton curve is crucial.In this study, the logarithmic function is selected as the skeleton curve.The dynamic parameters (a,b) in the model related to shear modulus and shear strength are consistent with those of the hyperbolic skeleton curve (Kondner, 1963;Hardin and Drnevich, 1972; Muravskii, 2005; Zhanget al., 2022), obtained by fitting test curveG/G0-γ, and the tangent modulus of LSC satisfies test curveG/G0-γ.The basic assumptions for constructing the LDSCM can be summarized as follows:
(1) During initial loading, the stress-strain curve coincides with the LSC,.
(2) The hysteresis and skeleton curves have the same function forms; both are logarithmic functions.
(3) During unloading and reloading, the stressstrain curve refers to the two-times relationship of the dynamic skeleton curveg( )γ, pointing directly to the point
(4) When the unloading or reloading curve intersects the initial skeleton curvef( )γat point, the stress-strain curve for subsequent loading will coincide with the initial skeleton curvef( )γ.
According to the above basic assumptions, soil stress and strain values can be obtained under arbitrary loading and unloading conditions, as shown in Fig.1.Based on the definition of “two-times relation” and “dynamic skeleton curve,” the constitutive formulation of soil can be expressed as
where |γ| is the absolute value of the shear strain, andτcandγcare the values of the shear stress and the shear strain at the last spinodal, respectively.τmandγmare the values of the shear stress and the shear strain at the biggest spinodal, which are positive.is the dynamic skeleton curve relative to the dynamic coordinate system.
The function relation deduced from Eq.(1) still cannot satisfy the experimental relationλ-γ.As shown below, the damping ratio degradation coefficient is introduced to correct Eq.(1).
2.1.2 Stress-strain relations
The hyperbolic formulas of the initial skeleton curvef( )γand the dynamic skeleton curveg( )γare commonly used as follows for the soil dynamic constitutive model.
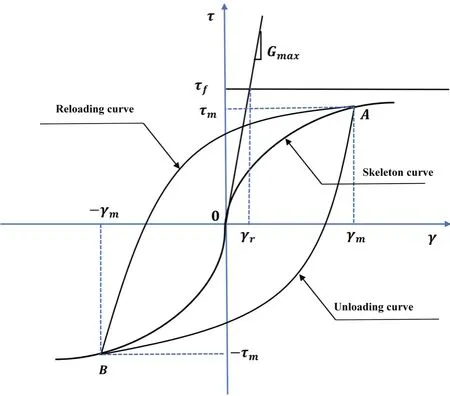
Fig.1 Logarithmic dynamic skeleton curve and hysteresis curve

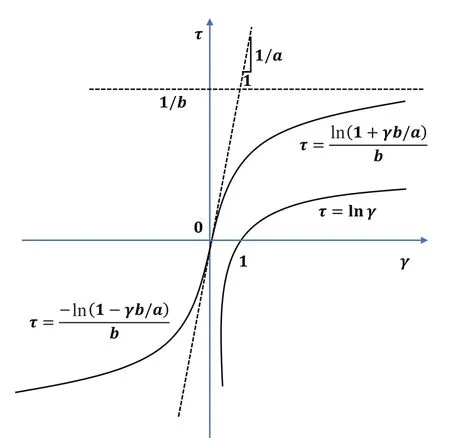
Fig.2 Logarithmic skeleton curve (LSC)
g(γ′ )takes the same functional form
wherea,bcan be obtained by fitting experimental dataG/G0-γ;a′,b′ are parameters derived froma,bandτ m,γm.
The tangent of the dynamic LSC at 0′ is consistent with that of the LSC at 0, 0′and 0 as shown in Fig.3, and they coincide at the ultimate.This fact can be described by the formula as follows
Substituting Eqs.(5) and (6) into Eq.(7),a′=acan be conveniently obtained.
Substituting Eq.(5) and Eq.(6) into Eq.(8), withγincreases, Eq.(8) can be expressed as
The equation has only one unknown quantityb′,which can be solved by Newtonian iteration.Set(τc-τm)/2=τD, (γm-γc)/2a=γD, the question can be rewritten as

Fig.3 Stress-strain trajectory of dynamic skeleton constitutive model
● When -τD<γD, Eq.(9) has a solution forb′∈ ( 0,+∞ ), and the following equation degrades to solve

whereη(γ0) is the damping ratio corresponding to the unloading curve of LSC.
By substituting Eq.(5) into Eq.(11), Eq.(11) can be rewritten as
To this end, the complete stress-strain relation of LDSCM can be expressed as follows
AccordingtoEq.(12),K(γ0)isnotonlyrelated to the test parameters(a,b,a1,b1)ofthesoil,but also related to the stress-strain history parameter0γ.Due to the difference in skeleton curves, the calculation formulas ofK(γ0) of LDSCM and HDSCM are not consistent.Based on the loading-unloading criterion and Eq.(13), only the maximum history stress-strain and the spinodal of the current stress-strain need to be recorded.The specific shape and trend of the stress-strain curve can be determined through Eq.(13) to determine the skeleton curve and hysteretic curve, which simplifies the realization of the algorithm.
2.2 Comparison of logarithmic dynamic skeleton curve (LDSC) and hyperbolic dynamic skeleton curve (HDSC)
As is well known, the skeleton curve and dynamic skeleton curve of LDSC are the logarithmic function,f(x) =γ/ (a+bγ), and HDSC is the hyperbolic function,f(x) = ln (1 +bγ/a)/b.This is the difference between the two models.Therefore, they have different hysteretic curves.From the definition of LDSC and HDSC, for the same shear modulus and shear strength parameters of soil (a,bin Eq.(3) and Eq.(5)), the specific shape and path of the stress-strain after a constant amplitude cycle-sinusoidal loading-unloading can be simulated.The soil is loaded from the initial state to the ultimate stress and strain, then unloaded to the reverse ultimate, and next loaded to the positive ultimate.For the stress-strain curves of two constitutive models, as shown in Fig.4, the hysteretic curve and skeleton curve of LDSC and HDSC, coincide at the ultimate.
In Fig.4, the red dotted line is HDSCM, while the solid black line is LDSCM.It shows that, for the same strain condition and the same shear modulus and shear strength parametersa,b, due to the difference in skeleton curves, the stress of LDSCM is greater than that of HDSCM for small strain; for large strain, the stress of LDSCM is smaller than that of HDSCM.LSC increases rapidly in the early stage of loading but slowly in the later stage, which is highly related to the small strain.With soil strain increase, the stress variation tends to be gentle, while the shear modulus of soil usually decreases.The asymptote of LDSCM rises more slowly than that of HDSCM, leading to a wider hysteresis cycle and more obvious nonlinear characteristics of the soil.When the stress is zero, the residual strain of LDSCM is larger than that of HDSCM, which can better reflect the plastic deformation.
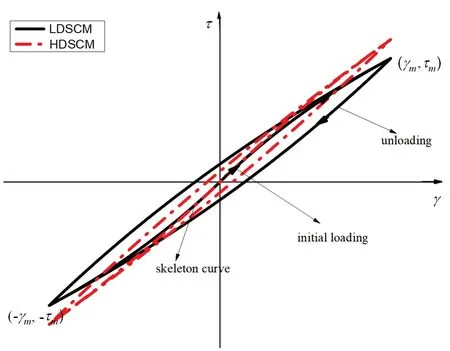
Fig.4 Loading and unloading stress-strain curves for LDSCM and HDSCM
3 Seismic response analysis of the site in timedomain
The time-domain method (TDM) is used to analyze site nonlinear seismic response (Kimet al.,2000; Trifunac, 2016), but its use is limited due to the lack of an effective stress-strain relationship.Given this, LDSCM is presented here and a program called Soilresp1D is developed.The program can calculate the 1D site seismic response.In Soilresp1D, finite element and finite difference methods are applied, and the boundary condition is a multi-transmitting formula(Song and Wolf, 1997, 2000; Chopra, 2000).
3.1 Establishment of motion equation
The homogeneous horizontal layered soil with thicknesshis assumed to be overlaid on an elastic homogeneous isotropic bedrock half-space (as shown in Fig.5).The model of the soil medium is LDSCM.The medium density and constitutive parameters of soil are measured experimentally, and seismic waves are input from the bedrock vertically upward.The 1D site seismic response is investigated based on the initial and boundary conditions.
The particle motion of the overlying soil layer is described by motion velocityυand shear strainγ, and the particle motion meets the coordinate deformation conditions
The particle motion of soil satisfies the equilibrium equation
whereρis the density of soil.
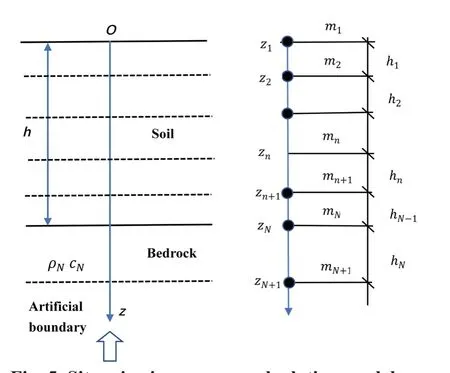
Fig.5 Site seismic response calculation model
The constitutive equation of soil is Eq.(13), simply rewritten as
Based on the definition of LDSCM and test data(a,b,a1,b1), the constitutive parameters of soil are determined.The unknown parameterγcan be solved according to the initial and boundary conditions as follows
Given the above infinite domain question, artificial boundary conditions should be established to simulate the scattered downward wave for satisfying infinite radiation conditions.It should be assumed that the bedrock under the artificial boundary is a semi-infinite uniform linear elastic medium.The downward reflected wave from the artificial boundary will no longer propagate upward.That is, the downward wave in the overlaying half-space below the artificial boundary propagates to infinity.Based on these conditions, the sum of the shear stress consists of the shear stresses distributed on the top of the bedrockτR(t,h) and the bottom of the soil layerτI(t,h), generated by the incident and reflected waves of the bedrock.
According to the definition of wave impedance and wave energy, the stressτI(t,h) of the incident, and the wave can be expressed as
whereυI(t,h) is the particle velocity on the top of the bedrock caused by the incident wave, andNρandcNare the density and shear wave velocity of the bedrock.It can be known from the continuity of velocity at the interface
whereυR(t,h) is the particle velocity caused by a reflected wave,υ(t,h) is the total particle velocity, and the stressτR(t,h) caused by a reflected wave can be obtained asτI(t,h),
Substitute Eq.(21) into Eq.(22), Eq.(22) can be expressed as
Substituting Eqs.(20) and (23) into Eq.(19), Eq.(19)can be expressed as
For the artificial boundary, the distance from the artificial boundary to the top of the bedrock ishN≥c NΔt(Fig.5),andthecalculationdomain[0,h] isextended to[0,h+hN],and Δtis thetime step.On theartificial boundary,
Equation (25) can be rewritten as
According to Eq.(24), the shear stress on the interface between the bottom of the soil layer and bedrock can be calculated atz=h.The artificial boundary conditions represented by Eq.(26) apply to the calculation of the particle velocity on the artificial boundary atz=h+hN,and are directly used in the numerical simulation in the discrete model.
3.2 Solution of motion equation
The motion equations mentioned above are discretized by the staggered grid method in this section.Assume that the soil layer is divided intoNsub-layers(Fig.5), and the thickness of each sub-layer isnh
whereznis the vertical coordinate ofn-th sub-layer top,and
The shear stress and shear strain at timeat the midpoint ofn-th sub-layer is written as
According to the free boundary condition in Eq.(18),Eq.(15) can be written as the central difference discrete form, as follows
As the constraint conditions of Eq.(15), Eq.(14) is also discrete as
Equation (30) can be further represented as
The stress-strain relationship of LDSCM can be simply expressed as
Equations (29)-(33) give an explicit recurrence method for the node velocity of each sub-layer and the stress-strain relationship between sub-layers.
The realization process for simulating the propagation of incident waves from bedrock to soil layer is as follows.First, bedrock is divided into three layers based on the element discrete criterion (Liao and Yang, 1995); next, the recurrence formula of boundary node velocity is expressed by Eq.(27), which can be described as

the incident wave at timep+1 on the artificial boundary.
The method has a second-order calculation precision.The stability condition is
wherencis the shear wave velocity of the medium in then-th layer, andnhis the thickness of then-th layer determined by the following equation
whereTminis the shortest period of input motion.
According to the given input ground motion and initial conditions, the site seismic response can be calculated at any depth step-by-step by Soilresp1D,which is coded based on the above time-domain site nonlinear seismic response method.
4 Verification
To illustrate the reasonability of the proposed method, Soilresp1D is used to analyze the nonlinear seismic response of two different sites.By comparing the results with HDSCM and ELM, the verification of the model described herein is demonstrated.
The simulation shows the input seismic motion in Fig.6, with a peak acceleration of 2.02 m/s2, the cutofffrequency of 15 Hz, and time step 0.02 s.According to Eq.(35),tΔ is 0.0025s.
4.1 Thin overlayer site
The overlayer of the site consists of backfill and gravel soil with thickness 8.5 m; the site parameters are given in Table 1, and the nonlinear characteristic parameters are listed in Table 2.
The peak ground acceleration (PGA) and the acceleration response spectrum (ARS) (damping ratio 5%)were obtained by using LDSCM, HDSCM, and ELM, as shown in Fig.7(a).The parametersa,b,a1,b1in Eq.(14)are obtained by fitting the test dataG/Gmax-γandζ-γof the soil in Tables 1 and 2.As a comparative analysis, the results of ELM are also given in Fig.7(a).The results show that PGA based on LDSCM, HDSCM, and ELM are 1.52 m/s2, 1.69 m/s2, and 3.71 m/s2, respectively.The PGA of ELM is maximum, while the PGA of LDSCM is minimum.The ARS of LDSCM and HDSCM are similar and have similar variation trends except for the differences in the period range of 0.08 s-0.09 s and 0.18 s-0.3 s.However, they are significantly different from the ELM results.Compared with the ARS of the ELM, the ARS of the two models are larger; as for the long period segment, the amplification of the two model is more prominent.Meanwhile, it shows that the PGA on the thin overlayer site by LDSCM and HDSCM is smaller, and the characteristic period is larger, which is more reasonable than ELM.
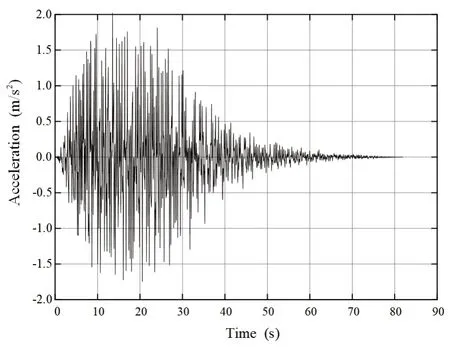
Fig.6 Input seismic motion, PGA is 2.02 m/s2, the cutofffrequency is 15 Hz, and the time step is 0.02 s

Table 1 Calculation model for thin overlayer site

Table 2 Nonlinear characteristic parameters of the site
The stress-strain obtained by LDSCM and HDSCM in the fourth sub-layer of the backfilled soil layer are also given in Figs.7(b) and 7(c), respectively.It shows that (τm,γm) of LDSCM is smaller than HDSCM, the hysteretic loop is larger and has a shuttle shape, and the stress-strain curve has evident nonlinearity.Therefore,the stress-strain relationship of LDSCM can adequately describe the nonlinear characteristics and plastic deformation of soil.
4.2 Thick soft layer site
The overlayer of the site consists of 14 kinds of soft soil (silty clay, clay silt, and mucky silty clay) with a total thickness of 108 m.The site parameters are given in Table 3, and the nonlinear characteristic parameters are shown in Figs.8(a) and 8(b).The shear wave velocity of the second silty clay layer with the thickness of 14 m is 140 m/s, and the minimum in the site is set so that the soil layer can be regarded as a soft layer based on the literature (Wanget al., 1983).
The mucky silty clay in this site is a soft soil layer with the smallest shear strength.PGA and ARS of LDSCM, HDSCM, and ELM are shown in Fig.9(a).The parametersa,b,a1,b1in Eq.(14) are obtained by fitting the test dataG/Gmax-γandζ-γof the soil in Figs.8(a) and 8(b).The results show that PGA based on LDSCM, HDSCM, and ELM are 4.07 m/s2, 2.95 m/s2, and 1.40 m/s2, respectively.From this, the ARS of LDSCM and HDSCM have a large amplification in the analysis frequency band, while ELM is usually attenuated with a large attenuation in the range of 0.06 s-0.1 s.The ratio between the PGA of LDSCM or HDSCM and the peak of input motion approaches 2, but ELM is 0.69 (1.4/2.02),which is much less than 2.Therefore, the ARS obtained by LDSCM and HDSCM is more reasonable than ELM.
The stress-strain of the mucky soil layer obtained by LDSCM and HDSCM are also given in Figs.9(b) and 9(c).It shows that the hysteretic loop of HDSCM is a shuttle shape, and the plastic deformation is not apparent.The hysteresis loop of LDSCM is larger and different from that of the HDSCM, with larger residual strain and more obvious plastic deformation, which agree with the test hysteretic loop of soft soil (Chuet al., 2014).

Fig.7 Seismic response of thin overlayer site obtained by using LDSCM, HDSCM, and ELM: (a) surface ARS of LDSCM, HDSCM, and ELM; (b-c) stress-strain of the fourth sub-layer of backfliled soil obtained from LDSCM and HDSCM

Table 3 Calculation model for thick, soft layer site
4.3 Eureka Canyon Road clay site
Based on the field data of the Eureka Canyon Road site in Corralitos, California, USA, a calculation model was established, and the input ground motion was the seismic acceleration record obtained at 33 m below the surface (as shown in Fig.10, PGA is 0.75 g).The overburden of the site is 33 m thick and composed of clay.Table 4 shows the calculated parameters of the model.The website (http://www.seas.ucla.edu/~jstewart/CalibrationSites/Webpage/main.htm) shows details and parameters of the model.
The site is classified as a moderate stiffsoil site,according to Table 4.The bedrock ground motion was input, along with the site seismic response of LDSCM and ELM and the observed surface ground motion records, as shown in Fig.11(a).The results show that the PGAs of LDSCM and ELM are 0.81 g and 0.82 g,respectively, and the measured value is 0.72 g.The error between the PGA of LDSCM and the measured value is 12.5%.

Fig.8 Parameters of thick, soft layer site: (a) shear modulus ratio for different soil layers, and (b) damping ratio for different soil layers

Fig.9 Seismic response of thick, soft layer site obtained by LDSCM, HDSCM, and ELM: (a) surface ARS of LDSCM, HDSCM, and ELM; (b-c) stress-strain of mucky soil obtained by LDSCM and HDSCM
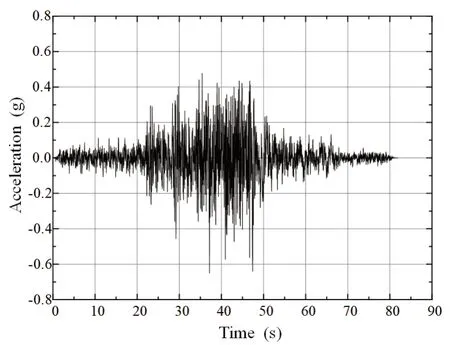
Fig.10 Bedrock acceleration record, PGA is 0.75 g

Table 4 Calculation model for Eureka Canyon Road site
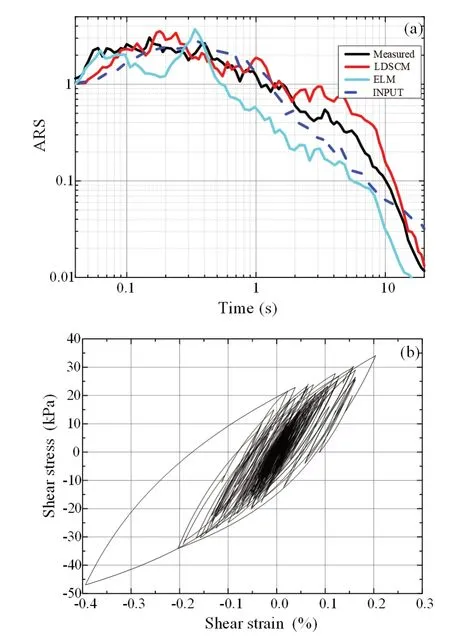
Fig.11 Site seismic response of LDSCM, ELM, and measured data in Eureka Canyon Road site: (a) surface ARS of measured, LDSCM, and ELM; (b) stress-strain of clay obtained from LDSCM
According to Fig.11(a), the ARS based on LDSCM is close to the measured results within the period of 1.8 s.Other periods larger than the measured results were obtained, but the variation trend is similar.The result of ELM has an obvious amplification phenomenon (usually considered as the “resonance” effect) in the middle frequency band.LDSCM is more reasonable than ELM.Figure 11(b) shows the stress-strain curve of the fourth clay layer.It is not difficult to see that the stress-strain curve based on LDSCM is a shuttle shape with obvious plastic deformation and the hysteresis curve is more realistic.
5 Conclusions
This study proposed a new time-domain dynamic constitutive model LDSCM, which requires fewer experimental parameters and can simulate the nonlinear characteristics and plastic residual deformation of soil.A 1D time-domain site seismic response analysis program,Soilresp1D, was developed using the staggered grid method.
By comparing two specific sites and a site with actual records, the seismic response, rationality and reliability of the LDSCM are verified.The main conclusions and findings are as follows.
(1) The LDSCM LSC-based model introduces the concepts of “modified dynamic skeleton curve”and “damping ratio degradation coefficient”, which is determined by test dataG/Gmax-γandζ-γof soil, can fully consider the damping effect in the soil dynamics problem.The asymptote of the skeleton curve rises slowly, and the hysteresis loop is wider.
(2) Compared with the ARS of the ELM, LDSCM and HDSCM are larger, and the two constitutive amplifications are more obvious.Meanwhile, the PGA on the thin overlayer site by LDSCM and HDSCM is smaller, while the PGA on the thick, soft layer site is larger.The characteristic period of ARS by LDSCM and HDSCM is larger.PGA and ARS of the two models are more reasonable than that of the ELM.
(3) The stress-strain obtained by LDSCM and HDSCM in these sites shows that the hysteretic loop of LDSCM is larger.The stress-strain of HDSCM has no obvious nonlinearity compared with LDSCM.Therefore, the stress-strain relationship of LDSCM can adequately describe the nonlinear characteristics and plastic residual deformation of the soil.
(4) The simulation results of the Eureka Canyon Road clay site show that the error between the PGA simulated based on LDSCM and the measured PGA is 12.5%.However, their ARS are similar, and the simulated ARS has no “resonance” effect.The simulation of these sites shows that the LDSCM presented in this study is suitable for the complex site (thin overlayer site and thick, soft layer site) earthquake response.
Acknowledgment
This work was supported by the Major Program of the National Natural Science Foundation of China(52192675) and the 111 Project of China under Grant No.D21001.
杂志排行
Earthquake Engineering and Engineering Vibration的其它文章
- Reliability-based life-cycle cost seismic design optimization of coastal bridge piers with nonuniform corrosion using different materials
- Finite element model updating for structural damage detection using transmissibility data
- Experimental study on seismic reinforcement of bridge foundation on silty clay landslide with inclined interlayer
- A novel mitigation measure for normal fault-induced deformations on pile-raft systems
- Longitudinal vibration characteristics of a tapered pipe pile considering the vertical support of surrounding soil and construction disturbance
- Resilient performance of self-centering hybrid rocking walls with curved interface under pseudo-static loading
