Clinical usefulness of the baby vision test in young children and its correlation with the Snellen chart
2024-02-23YaLanWangJiaJunWangXiCongLouHanZouYunZhao
Ya-Lan Wang, Jia-Jun Wang, Xi-Cong Lou, Han Zou, Yun-E Zhao
1The Eye Hospital of Wenzhou Medical University, Hangzhou 310000, Zhejiang Province, China
2National Clinical Research Center for Ocular Diseases,Wenzhou 325027, Zhejiang Province, China
Abstract
● KEYWORDS: baby vision test; acuity assessment; fixand-follow system; Snellen chart DOl:10.18240/ijo.2024.02.18
INTRODUCTION
Human visual function is not fully developed early in life and is susceptible to future visual damage.Conditions affecting the development of vision in children include refractive error, amblyopia and its risk factors (strabismus,anisometropia, or congenital cataract), color vision defects, and ocular pathology[1-2].Therefore, pediatric vision screening is essential for evaluating children’s vision.Accurate testing and recording of visual acuity (VA) are crucial for the diagnosis and treatment of ocular diseases in children.The measurement of VA in preverbal children involves quantitative methods,such as preferential looking techniques including Teller acuity cards (TAC), visual evoked potential, or optokinetic nystagmus[3-4].These tests are usually not conducted as part of routine pediatric eye examinations owing to a lack of time, experience, or the child’s cooperation.To optimize and circumvent the above problems, increasingly more tests to assess VA in children are being developed.
The baby vision test is a new testing modality that uses a dynamic target visual assessment tool.A circle with grating that moves horizontally is displayed on a device screen, which can be varied by different diameters (angular arc width or area) to assess VA thresholds in terms of minimum perceptible resolution.In this study, we compared VA in children aged 2-8y obtained using the baby vision test with those obtained using the Snellen visual chart (“E” chart).We aimed to investigate the efficacy of this new VA test in young children.
SUBJECTS AND METHODS
Ethical ApprovalThis study was conducted following the tenets of the Declaration of Helsinki.Approval from the ethics committee for human studies of Eye Hospital Clinical Research Institute was granted for this study (approval No.2020-089-K-81-01).Written informed consent was obtained from all the parents or guardians of each subject after a thorough explanation of the study.
Study Design and ParticipantsWe conducted a crosssectional study between January 2021 and January 2022 to investigate the efficacy of the baby vision test in comparison with the Snellen visual chart.
All patients were aged 2-8y, with VA lower than 20/32 in at least one eye using the Snellen visual chart, and were considered able to cooperate with VA evaluation using the baby vision test and Snellen visual chart.All participants underwent ophthalmologic examinations.Patients with ocular structural abnormalities, including retinopathy of prematurity and retinal or corneal disease, were excluded from the initial medical records review.Children who were unable to cooperate with testing were also excluded from the study.We included patients with refractive errors, amblyopia, strabismus,nystagmus, epiblepharon, or a history of cataract surgery.
Baby Vision TestGrating VA was measured using the baby vision model assessment by Metrovision (Monpack3.FRANCE).The device includes a screen for the examiner to look at, a near infrared camera to capture eye-movement images and a computer to connect to the assessment.
Children were seated in a comfortable chair or on a parent’s lap at a measured distance of 33-40 cm from a display (Figure 1A).The lighting in the test room was at a level similar to that of the display.Testing was performed monocularly using an eye mask covering the fellow eye.The right eye was tested first,followed by the left eye.A series of transversely striped circles with an increasing spatial resolution of unequal diameters was presented as grating in screen (Figure 1B), and the frequency of gratings was defined as cycles per centimeter (cpcm) on the surface of the circle.The cycles per degree (cpd) was reconverted into acuity values for presentation of results.VA was estimated according to the highest resolution the children could follow.Eye movements were tracked using a reflective material dot (Gabor patch) positioned above the bridge of the nose, slightly above the horizontal level of the child’s two eyes(Figure 1C).
Eyes and grating dot movements were superimposed on a graph and then analyzed (Figure 1D).We evaluated the baby vision testviathe fix-and-follow system by analyzing the graphs and the pointing-out method.The moving visual dot on the screen of the baby vision model looks like a small moving bee (Figure 1B), which has a certain appeal to children.This involves telling the child to point out the dot (in language: bee)on the screen and move their finger with the dot as it moves,or by observing the child’s eye movements.If the child failed to fix and follow or point out the target twice or more during three attempts, this was interpreted to mean that the child could not see the grating dot.In these cases, we increased the size of the grating dot by one step.If the child pointed out the target twice or more during three attempts, the circle size was decreased by one step.The same examiner evaluated all of the above procedures.
Snellen Visual Chart TestingVisual acuities were measured under photopic conditions using Snellen visual charts and then converted into logarithm of the minimum angle of resolution(logMAR) notation.The testing distance was set at 3 m.Spectacle wearers were allowed to use their spectacles while undergoing VA testing.All children were tested by the same optometrist using a Snellen visual chart and were asked to identify optotypes beginning from the top line of the chart with the left eye covered initially.Nearly all children aged over 3y cooperated well and gave reliable answers in the test and only a few 2 to 3-year-old children could complete the test.Nevertheless, it is worth noting that there exist exceptional children above the age of 2.5 who demonstrate accelerated learning capabilities and exhibit proficient cooperation.Besides, our optometrists have provided parental instruction on how to effectively train their children, starting from the age of 2, in recognizing VA charts within the comfort of their own homes.These young children received training and guidance to familiarize them with the test and the optotypes.They then underwent a pretest at a close distance, which was conducted by their parents using Snellen cards.Those 2-year-old children who were able to complete the Snellen test were enrolled.
Statistical AnalysisThe data were collected using Excel spreadsheets (Microsoft Corporation, Redmond, WA, USA).Decimal VA data were converted to logMAR for statistical analysis and calculation of the average VA using a standard conversion formula.Statistical calculations were performed using IBM SPSS version 26.0 (IBM Corp., Armonk, NY,USA).The mean and standard deviation were calculated.A Bland-Altman-style plot was created using IBM SPSS 26.0 to show the agreement between the two acuity test systems.For all statistical tests,P<0.05 was considered statistically significant.
RESULTS
Patient DemographicsTable 1 shows the demographic and clinical features of study participants.A total of 65 children (105 eyes) participated in the study, including 47 boys and 18 girls,with an average of 4.50±1.60y (Figure 2).Among the included children, 54 right and 51 left eyes were enrolled.Diseases that did not affect the study are also shown in Table 1.
Results of Visual Acuity TestsAll included participants underwent comprehensive eye examinations and VA testing using both the baby vision test and Snellen visual chart.The mean VA measured using the Snellen visual chart was 0.62±0.32 and that assessed with baby vision was 0.66±0.27.Children were divided into two groups according to age: the average Snellen VA in children younger than 4 years old was 0.69±0.29, and that with the baby vision test in this group was 0.72±0.32.Snellen visual chart VA values for children aged 4 to 8y was 0.59±0.33 and that with baby vision was 0.64±0.23.The two measures of VA did not exhibit any statistically significant difference (Table 2).
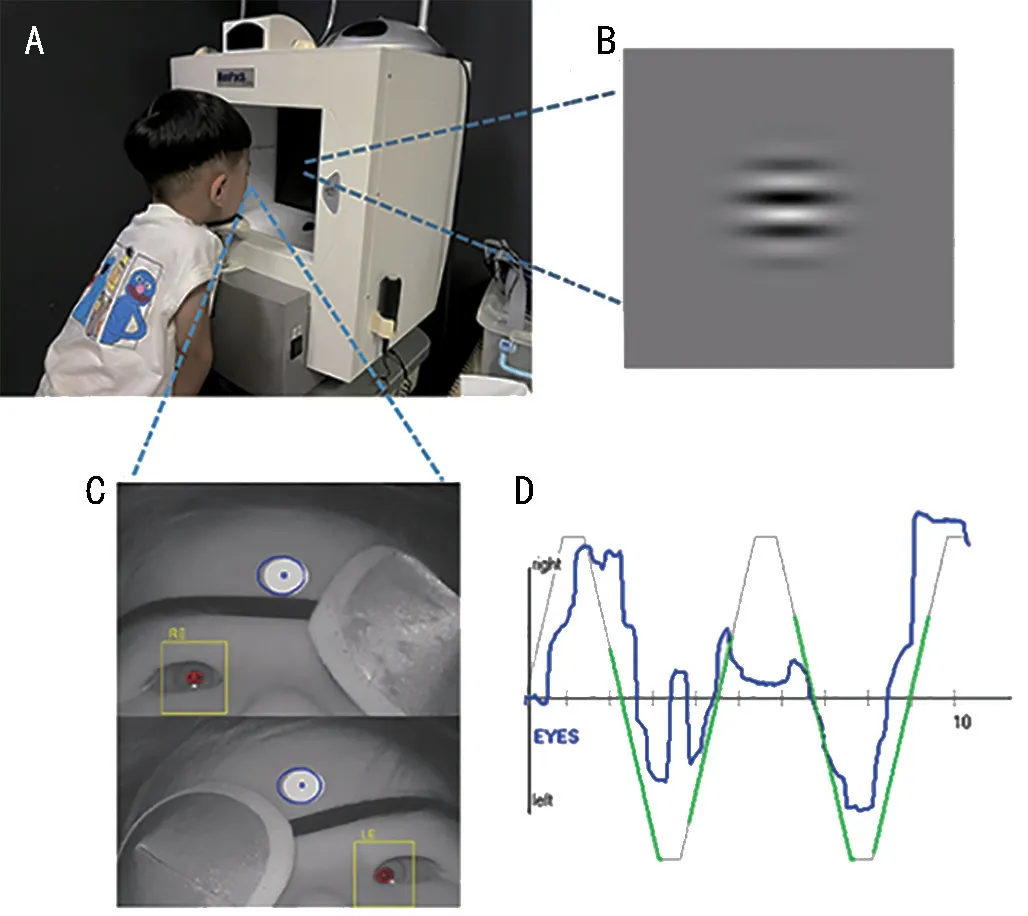
Figure 1 The method of baby vision A: Position of subject; B: The pattern of baby vision in Screen; C: Children are monitored during testing; D: Eye movement tracking chart.

Figure 2 The distribution of age of subjects.

Figure 3 The agreement of Snellen visual chart and baby vision system (Bland-Altman plot, n=105).
Correlation of Visual Acuity TestsThe 95% limit of agreement was -0.609, 0.695 (Figure 3), with 95.2% (100/105)plots within the 95% limits of agreement.Using intraclass correlation coefficient (ICC), the reliability was ICC=0.519.VA values using the Snellen visual chart were lower than thoseusing the baby vision test and were significantly correlated with VA as determined with baby vision (Spearman correlation test:R=0.274,P=0.005; Table 2, Figure 4).

Table 1 Demographic data of enrolled subjects (n=65 children,105 eyes) n (%)
DISCUSSION
The findings of our study among children aged 2-8y with bestcorrected VA less than 20/32 confirmed the validity of the baby vision test, which correlated well with the Snellen visual chart test and was also able to be used in younger children.Our results suggest that the new VA test has important potential clinical applications.
In our study, children were divided into two groups for analysis, according to age.Children aged 4 to 8y who met the diagnostic criteria for amblyopia had high correlation and consistency between results using baby vision and the Snellen visual chart.We included these children in assessment to verify the accuracy of baby vision in amblyopia.The reliability, as indicated by ICC=0.519, suggests a moderate level of consistency.This interpretation implies that the values obtained from the two test methods may not be exactly equal but fall within an acceptable margin of error.Additionally, we employed a Bland-Altman-style plot to assess the agreement between the two indicators in our study, and the results demonstrated strong concordance.The findings indicated that the new test is suitable for infants and young children whose vision is developing and who may not achieve higher VA.Although the test distance and size of the visual target are different, the angle of view at the standard test distance for far and near VA is identical.
The baby vision test comprises three main elements: circle,movement, and grating.A previous study[5]showed that individuals with amblyopia are severely impaired in terms of detecting motion at fine spatial and long temporal offsets,corresponding to fine spatial scale and slow speeds.Therefore,children who have different causes of amblyopia have difficulty with motion tasks[6].Baby vision uses a moving target, which is more conducive to detecting amblyopia in early visual development than traditional methods.This feature is similar to a study by Shinet al[7]who used a moving dot to detect; those authors considered the sensitivity to be higher.
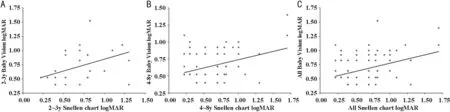
Figure 4 Correlation between baby vision test and Snellen visual chart (P<0.05, spearman correlation test) A: 2-3y; B 4-8y; C: All.
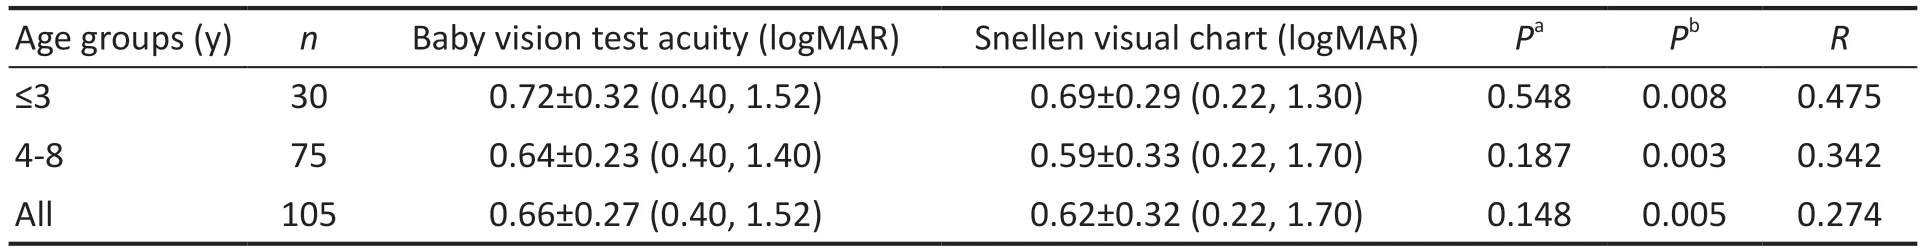
Table 2 Results of two types of visual acuity tests mean±SD
The baby vision test uses grating of a circle, which can be considered a visual pattern combining dot and grating.Regarding dot VA, Kirschenet al[8]used an illuminated light box with printed black dots of different diameters.The child’s task was to locate the dot, which could appear anywhere within the aperture, and to touch the dot; the smallest dot correctly identified twice was taken as the acuity threshold.Shinet al[7]used a computerized moving dot and monitor and analyzed eye movement using an infrared camera.Those authors confirmed that using a moving dot is effective and could be correlated to resolution VA (e.g., TAC).Baby vision is a VA test that combines all the above features and has results consistent with those of the Snellen visual chart, making it more effective and accurate.
The fix-and-follow approach is a feature used in baby vision.Among the various methods for assessing visual function in young children, fix-and-follow is the easiest for general ophthalmologists to perform[9].Stable fixation can be achievedviacontinuous corrective saccade.To follow a moving target,maintenance of fixation and pursuing the moving stimulus are necessary[10].Therefore, fix-and-follow may be a suitable means to assess early visual development.Children’s VA is estimated by recording their eye movements as they follow a horizontally moving grating dot target on a display screen.Jeonet al[11]developed a quantitative and reproducible grading system.Fixing is graded according to the availability and quality of the reaction to the target; the following is evaluated according to whether the smooth pursuit of movement is complete.This system can be used as a tool to screen early visual function, which includes both visual and visuo-cognitive components.This can be further combined and explored in future assessments of the baby vision test.
As an assessment of resolution (grating) VA, the TAC procedure is widely used in infants and young children[12].Baby vision has the following differences and advantages compared with TAC.First, baby vision uses a television-like monitor, and TAC is usually assessed by the examiner holding a card.A previous study[12]noted that the screen could be used to minimize distractions for younger children during testing so that they can pay more attention to the tasks.Second, baby vision uses a moving pattern or grating dot.For example, a red car pattern is shown in the first step and a grating circle that looks like a small bee is shown in the following steps, which a child may be more interested in.Third, TAC can potentially overestimate VA results and requires an experienced examiner and considerable time[13].Additionally, the tracking curve according to the fix-and-follow method is displayed on the computer screen, which is more accurate for the examiner to evaluate objectively.
Clinically, there are many young children with visual damage.Some preschool and school-age children with poor cooperation in general vision screening may also have mental or developmental impairment.For this reason, in initial vision screening and evaluating the effect of monitoring, an accurate method of recording VA is needed.In comparison with the Snellen visual chart, we found that the baby vision test can provide a relatively accurate method of visual screening in young children.
This study has certain limitations.First, TAC was not included in the comparison.We performed a TAC test in some children,but the results were obviously low owing to children’s difficulty with concentration; additionally, the values resulted from TAC of some children who were able to cooperate with the baby vision test were significantly higher than that from the Snellen visual chart.Therefore, we did not include these data in the analysis.Second, nystagmus and strabismus were not evaluated in this study.Therefore, other advantages of the baby vision test were unable to be assessed in the present study.
A high degree of consistency was found in children aged 2 to 8y who could perform both the baby vision and optotype(Snellen visual chart) vision tests.Our results suggest that baby vision can be used as a relatively reliable method for estimating VA in preverbal children.This new method of VA assessment might be a valid predictor of optotype-measured acuity in young children.
ACKNOWLEDGEMENTS
Conflicts of Interest: Wang YL,None;Wang JJ,None;Lou XC,None;Zou H,None;Zhao YE,None.
杂志排行
International Journal of Ophthalmology的其它文章
- Using choroidal thickness to detect myopic macular degeneration
- lmpact of multifocal gas-permeable lens designs on short-term choroidal response, axial length, and retinal defocus profile
- Baerveldt glaucoma implant with Supramid© ripcord stent in neovascular glaucoma: a case series
- Efficacy and safety of Usights UC100 illuminated microcatheter in microcatheter-assisted trabeculotomy
- Quantifying peripapillary vessel density and retinal nerve fibre layer in type 1 diabetic children without clinically detectable retinopathy using OCTA
- Nomogram to predict severe retinopathy of prematurity in Southeast China