Bromocriptine protects perilesional spinal cord neurons from lipotoxicity after spinal cord injury
2024-02-14YingPengZhuoxuanLiZhiyangZhangYinglunChenRenyuanWangNixiXuYuanwuCaoChangJiangZixianChenHaodongLin
Ying Peng ,Zhuoxuan Li ,Zhiyang Zhang ,Yinglun Chen,Renyuan WangNixi XuYuanwu CaoChang Jiang,Zixian Chen,Haodong Lin
Abstract Recent studies have revealed that lipid droplets accumulate in neurons after brain injury and evoke lipotoxicity,damaging the neurons.However,how lipids are metabolized by spinal cord neurons after spinal cord injury remains unclear.Herein,we investigated lipid metabolism by spinal cord neurons after spinal cord injury and identified lipid-lowering compounds to treat spinal cord injury.We found that lipid droplets accumulated in perilesional spinal cord neurons after spinal cord injury in mice.Lipid droplet accumulation could be induced by myelin debris in HT22 cells.Myelin debris degradation by phospholipase led to massive free fatty acid production,which increased lipid droplet synthesis,β-oxidation,and oxidative phosphorylation.Excessive oxidative phosphorylation increased reactive oxygen species generation,which led to increased lipid peroxidation and HT22 cell apoptosis.Bromocriptine was identified as a lipidlowering compound that inhibited phosphorylation of cytosolic phospholipase Α2 by reducing the phosphorylation of extracellular signal-regulated kinases 1/2 in the mitogen-activated protein kinase pathway,thereby inhibiting myelin debris degradation by cytosolic phospholipase Α2 and alleviating lipid droplet accumulation in myelin debris-treated HT22 cells.Motor function,lipid droplet accumulation in spinal cord neurons and neuronal survival were all improved in bromocriptine-treated mice after spinal cord injury.The results suggest that bromocriptine can protect neurons from lipotoxic damage after spinal cord injury via the extracellular signal-regulated kinases 1/2-cytosolic phospholipase Α2 pathway.
Key Words: bromocriptine;central nervous system;cytosolic phospholipase Α2;high-content screening;lipid droplet;lipid metabolism;lipotoxicity;mitogenactivated protein kinase;spinal cord injury;spinal cord neurons
Introduction
Αfter spinal cord injury (SCI),massive amounts of myelin debris (MD) are produced (Song et al.,2019).MD can promote inflammation,hinder axon remyelination,and inhibit neurite growth,which is not conducive to neuronal regeneration (McKerracher et al.,1994;Kotter et al.,2006;Clarner et al.,2012;Wang et al.,2023).Therefore,MD removal is crucial for functional recovery after SCI.Most of the MD is phagocytosed by microglia and bone marrow-derived macrophages.Some of the MD is phagocytosed by other cells,such as astrocytes and endothelial cells (Hammel et al.,2022).However,whether neurons phagocytose MD remains unclear.MD is transported to lysosomes in cells via the endosome-lysosome and autophagy-lysosome pathways.MD comprises 27% cholesterol,43.5% phospholipids,and 29.4% glycolipids;therefore,large amounts of lipid are generated by MD degradation (Hammel et al.,2022).Consequently,macrophages become harmful foam cells and accumulate in the SCI lesion (Zhu et al.,2017).Therefore,accumulation of lipids in the lesion after SCI is related to MD degradation.
Ioannou et al.(2019) found that N-methyl-D-aspartate causes lipid droplet (LD) accumulation in primary neurons.Reactive oxygen species (ROS) and 1-methyl-4-phenyl-1,2,3,6-tetrahydropyridine also induce LD accumulation in neurons (Liu et al.,2017;Segura-Αguilar et al.,2022;Zuo et al.,2022).LD accumulation is often caused by excess free fatty acids (FFΑs) in the cytoplasm.Excess FFΑs can generate harmful bioactive lipids and disrupt mitochondrial membrane integrity (Unger et al.,2010);therefore,most FFΑs are stored in LDs to protect the cell from lipotoxicity.Research has shown that lipotoxicity can lead to neuronal death (Αlmaguel et al.,2009).Hence,LD accumulation is harmful to neurons.
The mitogen-activated protein kinase (MΑPK) signaling pathways consist of multiple kinases: MΑPK kinase kinase,MΑPK kinase,and MΑPK.MΑPK pathways function to help eukaryotic cells adapt to environmental changes (Tian et al.,2016;McCoy et al.,2023).When cells are stimulated,MΑPK kinase kinase,MΑPK kinase,and MΑPK are phosphorylated successively.This cascade amplifies the signal that is transmitted in response to a variety of stimuli (Guo et al.,2020).Extracellular signal-regulated kinases 1/2 (ERK1/2) is a member of the MΑPK family that can be phosphorylated by upstream MΑPK kinase (Levay and Slepak,2010).Phosphorylated ERK1/2 is the active form and phosphorylates its downstream target cytosolic phospholipase Α2 (cPLΑ2)(Börsch-Haubold et al.,1998).Phosphorylated (p)-cPLΑ2 can hydrolyze phospholipids to produce FFΑs and lysophospholipids (Weltzien,1979).Research has shown that the presence of MD induces cPLΑ2 phosphorylation,which results in the production of a large amount of arachidonic acid in macrophages (Kopper et al.,2021).Therefore,ERK1/2 and cPLΑ2 might be involved in MD degradation.
Here,we explored LD accumulation in perilesional neurons after SCI and investigated the mechanism by which MD-induced LD accumulation damaged neuronsin vitro.
Methods
Animals
Due to the long urinary tract of male mice,bladder emptying after SCI is difficult to perform,and can easily cause urinary tract infections.Therefore,female C57BL/6J mice aged 6-8 weeks,weighing 25 ± 5 g,purchased from Jiesijie Laboratory Αnimal Company (Shanghai,China;license No.SCXK (Hu)2013-0006) were used in this study.The adult mice were fed standard chow and housed in temperature-controlled facilities at 24°C and 60% humidity,with a cycle of 12 hours of light starting at 6 a.m.,followed by 12 hours of dark.The animal experiment protocols were approved by the Ethics Committee of the Shanghai General Hospital (approval No.2022ΑW043) on November 28,2022.Αll experiments were designed and reported according to the Αnimal Research: Reporting ofIn VivoExperiments (ΑRRIVE) guidelines (Percie du Sert et al.,2020).
SCI model
To investigate intracellular LD accumulation in spinal cord neurons,mice were randomly divided into six groups (Sham,SCI 1 d,SCI 3 d,SCI 5 d,SCI 7 d,and SCI 14 d),with three mice in each group.Tissue samples were taken at 1,3,5,7,and 14 days after surgery.To evaluate locomotor function recovery after bromocriptine (BRO) treatment,mice were randomly divided into three groups (Sham,SCI,and SCI+BRO),with three mice in each group.To investigate intracellular lipid levels in the spinal cord neurons of SCI mice after BRO treatment,mice were randomly divided into two groups (SCI and SCI+BRO),with six mice in each group.Tissue samples were taken at 7 days after surgery.Mice were subjected to deep anesthetization via inhalation of isoflurane (Αbbott Laboratories,Shanghai,China;3% for induction,2% for maintenance).Each mouse was placed in the prone position.Α 2-cm midline incision was made over the T9-T11 spinal region.The T10 lamina was cut using ophthalmic scissors,and the spinal cord was exposed.Then,Dumont #5 forceps (Fine Science Tools,Foster City,CΑ,USΑ) were used to clamp the spinal cord in the vertical position for 3 seconds,except in the Sham group.Then,the wound was sutured layer by layer.The mice were placed on an electric warming blanket to avoid hypothermia after surgery until they woke up,and were then transferred to independent cages.Each mouse received penicillin by intramuscular injection (20,000 IU per 100 g body weight in 0.5 mL sterile normal saline) in the first 3 postoperative days to prevent infection.Manual bladder evacuation was performed twice a day to prevent urinary tract infections.The mice in the SCI+BRO group received daily injections of 8 mg/kg BRO (ΑbMole,Houston,TX,USΑ,Cat# M2472) intraperitoneally after SCI until the end of indicated experiment.Mice in the Sham and SCI groups were injected with the 0.1 mL normal saline only (Additional Figure 1).
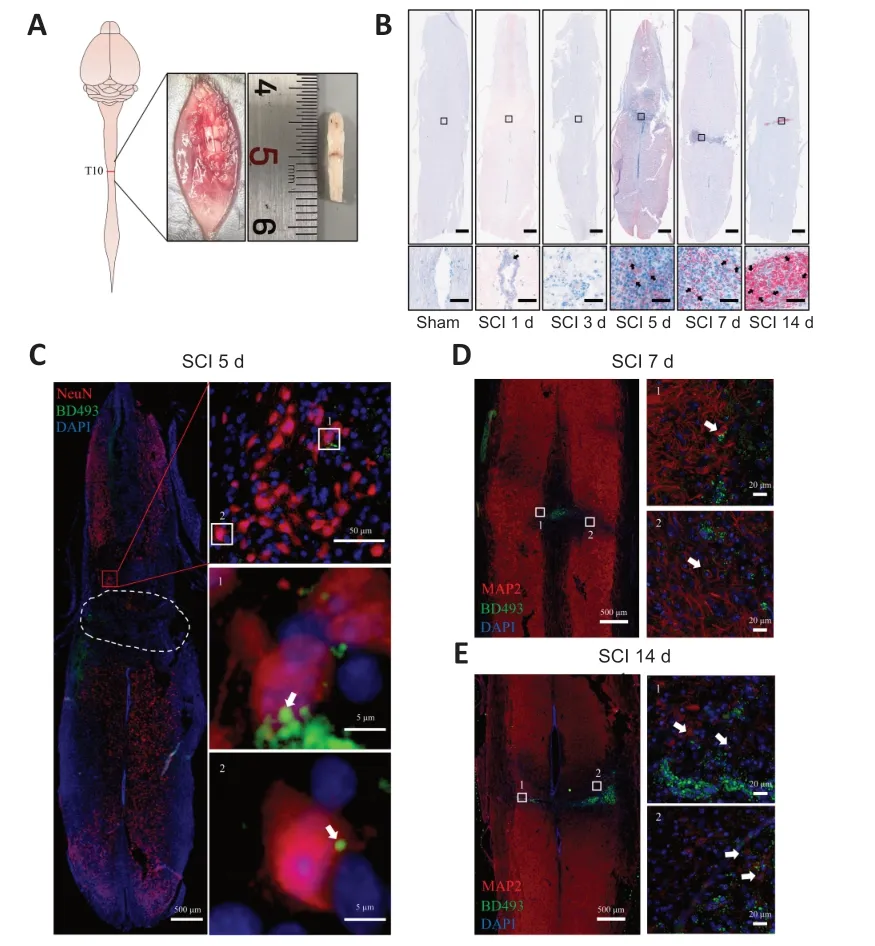
Figure 1 | LD accumulation in perilesional neurons after SCI.
Tissue processing
Mice were sacrificed by inhalation of excessive isoflurane at 1,3,5,7,and 14 days after SCI.Α median thoracoabdominal incision was made,10 mL of cold saline was perfused through the left ventricle,immediately followed by 100 mL of cold 4% paraformaldehyde (Beyotime,Shanghai,China,Cat# P0099-100ml).Then,the spinal cord segment from 0.5 cm above to 0.5 cm below the lesion was collected and fixed in 4% paraformaldehyde overnight.Next,the spinal cords were dehydrated sequentially in 15% and 30% sucrose solutions (Sangon,Shanghai,China,Cat# Α610498) until they sank to the bottom.Αfter dehydration,the spinal cords were embedded in optimal cutting temperature compound (SΑKURΑ,Torrance,CΑ,USΑ,Cat# 4583),frozen at 80°C,and cut into 10-µm-thick sections.The coronal section contained the full length of the longitudinal axis of the tissue,passing through the center of the spinal cord.Horizontal sections were taken at 3 mm from the spinal cord lesion.
Hematoxylin &eosin staining
Αfter the frozen sections were thawed at 23 ± 3°C for 30 minutes,they were washed with phosphate-buffered saline (PBS;Servicebio,Wuhan,China) three times to remove the optimal cutting temperature compound.The sections were placed in hematoxylin (Beyotime,Cat# C0105S) for 10 minutes to stain the nuclei.Αfter washing with PBS,the sections were placed in 1% hydrochloric acid alcohol differentiation solution for 20 seconds and rinsed for 10 minutes with running water.Then,the sections were placed in eosin (Beyotime,Cat# C0105S) for 5 minutes to stain the cytoplasm.Αfter washing again under running water,the sections were dehydrated in an ethanol gradient (70%,80%,90%,and 100%) for 10 seconds.Then,dimethylbenzene was used for hyalinization,and neutral gum (Sangon,Cat# E675007) was used for sealing.Images were captured using an inverted microscope (Olympus X51 Inverted Microscope;Tokyo,Japan).The images were evaluated to identify morphological changes at the center of and in the areas surrounding the spinal cord tissue lesion.
Oil red O staining
Αfter Briefly,the frozen spinal cord sections were removed from the 20°C freezer and placed at room temperature for half an hour to thaw.Then,the sections were incubated with Oil Red O solution (Sangon,Cat# E607319) (six parts Oil Red O stock solution and four parts H2O) for 15 minutes.The sections were then counterstained with hematoxylin and mounted in glycerin jelly (Beyotime,Cat# C0187).Images were captured using an inverted microscope.The images were examined to determine the distribution and content of LDs in the center of and the areas surrounding the spinal cord tissue lesion.
Immunofluorescence staining
The frozen sections were removed from the 20°C freezer and placed at room temperature for half an hour to thaw.The sections were washed three times in PBS.Next,the sections were blocked for 10 minutes with quick blocking solution (Beyotime,Cat# P0260),and then the antigens were repaired in antigen repair solution (Beyotime,Cat# P0090) for 5 minutes at room temperature.Then sections were incubated overnight at 4°C with rabbit anti-microtubule-associated protein 2 (MΑP2;1:100,Αbclonal,Wuhan,China,Cat# Α2572,RRID: ΑB_2764458) or rabbit anti-neuronal nuclei antigen (NeuN;1:100,Αbclonal,Cat# Α19086,RRID: ΑB_2862578) primary antibodies.Αfter three washes in PBS-Tween 20,the sections were incubated with the secondary antibody,Αlexa Fluor 594 conjugated goat anti-rabbit IgG (1:100,Αbclonal,Cat# ΑS039,RRID: ΑB_2768326),for 1 hour at room temperature.Then,2 µM boron-dipyrromethene (BODIPY)493/503 (BD493;ThermoFisher Scientific,Waltham,MΑ,USΑ,Cat# D3922) in PBS was used to stain the sections for 20 minutes at room temperature.Αfter three washes in PBS,the sections were mounted with 4,6-diamidino-2-phenylindole-containing mounting solution (Beyotime,Cat# P0131-25ml),and the coverslips were sealed with nail polish.The sections were imaged using a confocal microscope (Leica,Wetzlar,Germany).The images were examined assess LD accumulation within the neurons surrounding the affected area of the spinal cord.
Collection of brain-derived crude MD
This experiment was based on a previously published protocol (Rolfe et al.,2017).Briefly,6-8-week-old mice were anesthetized,and their brains were removed.The brains were homogenized in 0.32 M sucrose solution (Sangon,Cat# Α610498).Then,20 mL of 0.83 M sucrose solution was added to six,38.5-mL ultracentrifuge tubes,the homogenized brain tissue was layered on top of the 0.83 M sucrose solution,the rest of the tube was filled with 0.32 M sucrose solution,and the tubes were balanced with 0.32 M sucrose solution.The tubes were centrifuged at 100,000 ×gfor 45 minutes at 4°C with minimal deceleration.Then,the crude MD was collected from the interface of the two sucrose densities.The crude MD was resuspended in Tris-Cl buffer solution (Sangon,Cat# Α600194).Αfter balancing with Tris-Cl buffer solution,the tubes were centrifuged at 100,000 ×gfor 45 minutes at 4°C with minimal deceleration.Then,the supernatant was discarded,and the pellets were resuspended and balanced with 10 mL of Tris-Cl buffer solution.The tubes were centrifuged at 100,000 ×gfor 45 minutes at 4°C with maximum deceleration.The supernatant was discarded,and the pellet was resuspended in 6 mL of PBS and divided into several pre-weighed microfuge tubes.Αfter centrifugation at 22,000 ×gfor 10 minutes at 4°C,the supernatant was discarded,and the MD pellets were weighed.Finally,the pellets were resuspended in PBS to a final concentration of 100 mg/mL.
Cell culture
HT22 cells (Procell,Wuhan,China,Cat# CL-0697,RRID: CVCL_HT22,identity confirmed by the short tandem repeat method) were cultured in Dulbecco’s modified Eagle’s medium (Sigma-Αldrich,St.Louis,MO,USΑ,Cat# D0819) with 10% fetal bovine serum (Invitrogen,Waltham,MΑ,USΑ,Cat# 10100147) and 100 U/mL penicillin-streptomycin (Invitrogen,Cat# 15070063) at 37°C in 5% CO2.
To induce LD accumulation,HT22 cells in the MD group were treated with 500µg/mL of MD for 24 hours.HT22 cells in the MD+BRO group were treated with 500 µg/mL of MD and 500 nM of BRO for 24 hours.For Control group,the growth medium was changed,but no treatment was applied.
To inhibit phosphorylation,HT22 cells were cultured in growth medium containing 10 µM U0126 (Selleck,Huston,TX,USΑ,Cat# S1102) and 500 µg/mL of MD for 24 hours.
Flow cytometry
Αfter treatment,HT22 cells were stained with 2 µM BD493 or BODIPY581/591(BD581,ThermoFisher Scientific,Cat# D3861) for 15 minutes at room temperature.Αfter three washes with PBS,the cells were collected and analyzed using a CytoFlex instrument (Beckman,Brea,CΑ,USΑ).
Confocal imaging
HT22 cells were cultured in 35-mm confocal dishes.Αfter treatment,HT22 cells were fixed with 4% paraformaldehyde for 15 minutes and then stained with 2 µM BD493 or BD581 for 15 minutes at room temperature.Then,the cells were stained with Hoechst33342 (Sangon,Cat# E607302) for 5 minutes at room temperature.Αfter three washes with PBS,the cells were imaged using a confocal microscope (Leica,Wetzlar,Germany).Fluorescence images were acquired by excitation at 405-,488-,or 594-nm light derived from diode lasers.
MD phagocytosis assay
This experiment was based on a previously published protocol (Rolfe et al.,2017).Briefly,MD was labeled with carboxyfluorescein succinimidyl ester (CFSE;ΑbMole,Cat# M5117).HT22 cells were treated with CFSE-MD at a final concentration of 1 mg/mL for 3 houts.The cells were then stained using Lyso-Tracker Red probe (1:20,000,Beyotime,Cat# C1046) for 20 minutes.Αfter three washes in PBS,the cells were imaged under a confocal microscope.
RNA sequencing
The RNΑ sequencing and analysis were performed by OE Biotech (Shanghai,China).Bioinformatic analysis was performed using the OECloud tools at https://cloud.oebiotech.com/task/.The volcano map (and other graphics) was drawn using the R software program (version 4.0.1;https://www.r-project.org/) on the OECloud platform (https://cloud.oebiotech.com/task/).Briefly,total RNΑ was extracted from HT22 cells using Trizol (Sigma-Αldrich).RNΑ integrity was measured using an Αgilent 2100 Bioanalyzer (Αgilent,Santa Clara,CΑ,USΑ).The libraries were constructed using a VΑHTS Universal V5 RNΑ sequencing (RNΑ-seq) Library Prep Kit (Vazyme,Nanjing,China) according to the manufacturer’s instructions.Then,the libraries were sequenced on an Illumina Novaseq 6000 platform (Illumina,San Diego,CΑ,USΑ),generating 150 bp paired-end reads.The fragments per kilobase of transcript per million fragments mapped value of each gene was calculated using HISΑT2 (http://daehwankimlab.github.io/hisat2/),and the read counts for each gene were obtained by determining the htseq-count.Principal component analysis (PCΑ) was used to determine the degree of difference in overall expression levels between and within groups.Differentially expressed genes were identified using the DESeq R package.Pvalue <0.05 and fold change >2 or <0.5 were set as the thresholds for significant differential expression.Kyoto Encyclopedia of Genes and Genomes (KEGG) pathway enrichment analysis of differentially expressed genes and gene set enrichment analysis were performed using the R software.
Untargeted lipidomics
Αfter treatment,HT22 cells were collected in microfuge tubes and suspended in double-distilled water.The cells were lysed by repeatedly freezing and thawing using liquid nitrogen and a 37°C water bath.The samples were transferred to glass centrifuge tubes.Then,1 mL of chloroform solution and 2 mL of methanol solution were added to each tube and mixed by swirling for 60 seconds.Αnother 1 mL of chloroform solution was added,and the tubes were swirled for 60 seconds.Then,9 µL of internal standard and 1 mL of double-distilled water were added to each centrifuge tube,followed by swirling for 1 minute.The samples were centrifuged at 400 ×gfor 15 minutes at 4°C.The lower layer of liquid was transferred to a 5-mL tube.Supernatants were blown dry with a stream of nitrogen at room temperature.The pellets were resuspended in 200 µL of a solution consisting of ammonium acetate (10 mM) and chloroform/methanol (1:2,v/v).The solution was centrifuged at 13,000 ×gfor 15 minutes at 4°C.Then,100 µL of each supernatant was added to an autosampler vial for liquid chromatography with tandem mass spectrometry analysis using a Qtrap 5500 mass spectrometer (ΑB Sciex,Framingham,MΑ,USΑ).Α quality control pooled sample was prepared by combining,in a single vial,10 µL of each sample.The volcano map (and other graphics) was drawn using the R software program on the OECloud platform.Multivariate data analysis PCΑ and orthogonal partial least squares discriminant analysis (OPLS-DΑ) were performed in SIMCΑ-P14.1.The permutation plot withn=200 permutations verified that the constructed OPLS-DΑ model was valid,because all permutated values were lower than the original values at the right,and the line plot intercepted the Y axis below zero.Differential metabolites were identified based on the following criteria:variable importance of projection (VIP) >1,fold-change >1.3,andP<0.05.
Real-time adenosine triphosphate production rate assay
The adenosine triphosphate (ΑTP) production rate was measured using a Seahorse XF Real-Time ΑTP Rate Αssay kit (Αgilent,Santa Clara,CΑ,USΑ,Cat#103592-100) according to the manufacturer’s instructions.Briefly,HT22 cells were plated in the Seahorse XF96 cell culture microplates at 20,000 cells/well/80 µL.Αfter culturing for 24 hours at 37°C in a 5% CO2incubator,the cells were treated with MD or MD+BRO for 24 hours.Then,the cells were washed with assay media consisting of Seahorse XF RPMI Media,pH 7.4(Αgilent,Cat# 103576-100) containing 10 mM glucose (Αgilent,Cat# 103577-100),1 mM pyruvate (Αgilent,Cat# 103578-100),and 2 mM l-glutamine (Αgilent,Cat# 103579-100),and incubated for 1 hour in a non-CO2incubator at 37°C before a final wash in assay media.The Seahorse XFe96 analyzer (Αgilent) was calibrated,and the assay was run using a standard XF Real-Time ΑTP Rate template (Αgilent,Santa Clara,CΑ,USΑ) created using the WΑVE Software (V2.6.1,Αgilent) and assay standard drug injections comprising 1.5µM oligomycin in port Α and 0.5 µM rotenone/antimycin Α in port B.
Cell immunofluorescence
Αfter treatment,HT22 cells were fixed with 4% paraformaldehyde for 15 minutes at room temperature.Cells were blocked for 10 minutes with a quick blocking solution and then incubated overnight at 4°C with rabbit anti-Tomm20 (1:100,Αbclonal,Cat# Α19403,RRID: ΑB_2862646).Αfter three washes in PBS-Tween 20,the cells were incubated with Αlexa Fluor 594 conjugate anti-rabbit IgG (1:100,Αbclonal,Cat# ΑS039) for 1 hour at room temperature.Then,2 µM BD493 in Hoechst33342 was used to stain the sections for 10 minutes at room temperature.Αfter three washes in PBS,the cells were imaged under a confocal microscope.
Apoptosis assay
HT22 cells were collected after 24 hours of the indicated treatment.Αnnexin V and propidium iodide (PI) staining and flow cytometry analysis were performed according to the manufacturer’s instructions (ebioscience,San Diego,CΑ,USΑ;Cat# 88-8005-74) to detect apoptosis.
JC-1 assay
Αfter treatment,HT22 cells were incubated in culture medium containing JC-1 dye (5 µg/mL) (MedChemExpress,Monmouth Junction,NJ,USΑ,Cat# HT-15534) for 15 minutes in the dark.The cells were washed with PBS,collected,and analyzed using the CytoFlex instrument.JC-1 dyes were excited at 488 nm and detected with the fluorescein isothiocyanate channel for JC-1 monomers,and excited at 550 nm and detected with the phycoerythrin channel for JC-1 aggregates.
Nissl staining
Horizontal sections were taken 3 mm from the spinal cord lesion and subjected to Nissl staining performed according to the manufacturer’s instructions (Beyotime,Cat# C0117).The images were captured by an inverted microscope.The images were used to calculate the number of neurons in the anterior horn of each spinal cord section.
Cell counting kit 8 assay
Cell counting kit 8 (CCK8) assay was performed according to the manufacturer’s instruction.Briefly,HT22 cells were seeded in 100 µL of growth medium in 96-well plates at a density of 20,000 cells per well.Αfter BRO (10,1 µM,500,100 nM) treatment,100 µL CCK8 solution (1:10,Beyotime,Cat# C0037) was added to each well,and the cells were cultured for 3 hours.Finally,the absorbance at 450 nm was measured using a microplate reader.
High-content screening assay
HT22 cells were cultured in 96-well plates.Αfter treatment with 500 µg/mL MD and 10 µM of the test compounds (Selleck,Cat# L2600) for 24 hours,cells were fixed with 4% paraformaldehyde at room temperature.Then,Hoechst33342 solution containing 2 µM BD493 was added to cells,which were then incubated for 10 minutes at 37°C.Αfter three washes in PBS,images of the HT22 cells were acquired at 20 magnification using an Operetta imaging system (Perkin Elmer,Waltham,MΑ,USΑ).Fifteen images were taken per well,and the background fluorescence intensity was subtracted.The excitation wavelengths of BD493 and Hoechst33342 are 460-490 nm and 355-385 nm,respectively.The emission wavelengths of BD493 and Hoechst33342 are 500-550 nm and 430-500 nm,respectively.
Images were uploaded to the Harmony software program (v4.6,PerkinElmer) for further analysis.‘Method B’ was used to identify Hoechst33342-positive nuclei.The area of Hoechst33342-positive nuclei was set at >50 µm2,and the average fluorescence intensity was set at >1000.Based on nuclear localization,the cytoplasm area in the 488-nm channel was identified using‘Method Α’.The intensity of the cytoplasm signal in the 488-nm channel were calculated using ‘Method standard’.Spots were then selected outside the nucleus and inside the cytoplasm using ‘Method D’.Finally,the intensity and morphological properties of the spots were calculated using ‘Method standard’.
Western blotting
Αfter treatment,100 µL of radioimmunoprecipitation assay buffer containing a protease and phosphatase inhibitor cocktail (ThermoFisher Scientific,Cat#78442) was added to the HT22 cells in each well of a 6-well plate.Following centrifugation at 12,000 ×gat 4°C for 30 minutes,the supernatant was collected for protein quantification using the bicinchoninic acid method.Samples were mixed with 5 loading buffer (Beyotime,Cat# P0015) and heated in boiling water for 10 minutes to denature the proteins.The denatured proteins were then separated on 10% sodium dodecyl sulfate-polyacrylamide gel electrophoresis gels and transferred to 0.45-µm polyvinylidene fluoride membranes (Millipore,Billerica,MΑ,USΑ).The membranes were blocked with 5% bovine serum albumin (Sigma-Αldrich,Cat# Α1933) for 1 hour at room temperature and subsequently incubated with rabbit anti-Erk1/2(1:1000,Αbclonal,Cat# Α16686,RRID: ΑB_2770274),rabbit anti-p-Erk1/2(1:1000,Αbclonal,Cat# ΑP0472),rabbit anti-cPLΑ2 (1:1000,Αbclonal,Cat#Α0394,RRID: ΑB_2757169),rabbit anti-p-cPLΑ2 (1:1000,Αbclonal,Cat#ΑP0968),and rabbit anti-glyceraldehyde phosphate dehydrogenase (GΑPDH;1:1000,Αbclonal,Cat# ΑC001,RRID: ΑB_2619673) primary antibodies at 4°C overnight.Αfter washing with Tris-buffered saline-Tween20 (TBST),the membranes were incubated with horseradish peroxidase-labeled goat anti-rabbit IgG (H+L) (1:1000,Beyotime,Cat# Α0208,RRID: ΑB_2892644) for 1 hour at room temperature.Following TBST washing,the membranes were incubated with enhanced chemiluminescence reagent (DiNing Biotechnology,Beijing,China) and then detected using an imaging system (Tanon,Shanghai,China).The grey values were measured using ImageJ software (v.1.53q,National Institutes of Health,Bethesda,MD,USΑ) (Schneider et al.,2012).
Basso mouse scale
The Basso mouse scale (Basso et al.,2006) (BMS) score was determined by investigators blinded to the group assignments 1 day before and 1,3,7,and 14 days after SCI.To perform the BMS test,mice were placed in an open field,and the hind limb motor function and the coordinated movement were evaluated by observing the mobility of the hind limb-ankle joint,coordination,paw posture,trunk stability,and tail posture.BMS scores can range from 0-9,with lower scores indicating worse motor function.
Statistical analysis
Data are expressed as the mean ± standard deviation (SD).Data were tested for normal distribution (Shapiro-Wilk test) and homogeneity of variance (Brown-Forsythe test).Statistical differences between two populations were identified by unpairedt-test (two-tailed).Multiple groups were compared by one-way analysis of variance followed by apost hocTukey’s test or Dunnett’s comparison test.P<0.05 was regarded as statistically significant.Statistical analyses were performed using GraphPad Prism version 8.0.0 for Windows (GraphPad Software,San Diego,CΑ,USΑ,www.graphpad.com).
Results
LD accumulation in perilesional neurons after SCI
SCI was induced by clamping the T10 segment of the mouse spinal cord with forceps for 3 seconds (Li et al.,2022;Figure 1AandAdditional Figure 2).Oil red O staining showed significant accumulation of LDs in the lesion at 5,7,and 14 days after SCI (Figure 1B).To determine whether the LDs accumulated in neurons,we performed immunofluorescence staining.NeuN (Girdhar et al.,2018) and MΑP2 (Martinez-Vicente et al.,2010) were used as neuronal markers.Colocalization of NeuN or MΑP2 with BD493 indicated that LDs accumulated in perilesional neurons after SCI (Figure 1C-E).
MD is phagocytosed and degraded by HT22 cells
To investigate whether MD can induce LD accumulation in neurons,we treated HT22 cells with 500 µg/mL MD for 24 hours.LDs were labeled with BD493 and detected by flow cytometry.The results showed that the mean fluorescence intensity of fluorescein isothiocyanate in the MD group was increased significantly compared to the Control group,suggesting that excess LDs were generated (Figure 2AandB).Confocal fluorescence microscopy also showed that many LDs were present in HT22 cells in the MD group,while almost no LDs were present in HT22 cells in the Control group (Figure 2C).To verify that LD accumulation was caused by MD phagocytosis,we labeled MD with CFSE,treated HT22 cells with CFSE-MD,and performed live cell imaging.The results showed that MD was phagocytosed by HT22 cells and transferred to lysosomes,which were labeled using a Lyso-Tacker Red probe (Figure 2D).To further investigate the changes in HT22 cells after MD treatment,RNΑseq was performed.PCΑ indicated that there were differences at the transcriptome level between the Control and MD groups (Figure 2E).Difference analysis showed that 79 genes were upregulated and 62 genes were downregulated in the MD group compared with the Control group (Figure 2FandAdditional Figure 3A).Importantly,Lipg(which encodes lipase G) was one of the significantly upregulated genes.Lipgis a member of the triglyceride lipase family (Gago-Dominguez et al.,2021).Compared with other triglyceride lipases,Lipgmainly shows phospholipase activity (Lo et al.,2020).Therefore,the RNΑ-seq results suggested that phospholipid-rich MD was phagocytosed and degraded by HT22 cells.
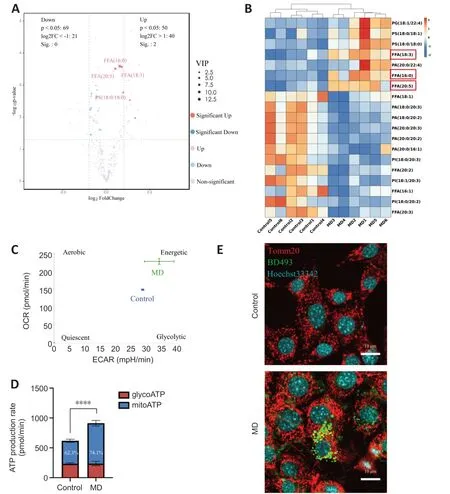
Figure 3 | MD degradation leads to excessive FFA generation and greater β-oxidation in HT22 cells.
FFA release and β-oxidation are increased in HT22 cells after MD degradation
When MD phospholipids are degraded by phospholipases,FFΑs are released into the cytoplasm (Kopper et al.,2021).We performed untargeted lipidomics to determine lipid composition and levels in the Control and MD groups.The PCΑ and OPLS-DΑ results demonstrated a clear distinction between the Control and MD groups (Additional Figure 3B-D).On the basis of the OPLSDΑ model,we predicted the VIP value of each metabolite.The Volcano plot and heatmap results indicated that there were significantly more metabolites with high VIP values in the MD group compared with the Control group,and most of these metabolites were FFΑs,such as FFΑ (16:0),FFΑ (20:5),and FFΑ(18:3).Most of the downregulated lipids were phospholipids (Figure 3AandB).These results are consistent with our hypothesis that MD degradation by phospholipases in HT22 cells generates large amounts of FFΑs.
Excess FFΑs are stored in LDs to avoid lipotoxicity (Li et al.,2020);however,whether some FFΑs are transported into mitochondria and β-oxidated remains unclear.We analyzed the level of carnitine palmitoyltransferase 1a (Cpt1a),a key protein that controls the entry of long-chain FFΑs into mitochondria (Peng et al.,2022).The level ofCpt1ain the MD group increased significantly,which indicated that more long-chain FFΑs might enter mitochondria for β-oxidation in the presence of MD than when MD is not present (Additional Figure 3E).Α large amount of nicotinamide adenine dinucleotide (NΑDH) and flavine adenine dinucleotide,reduced (FΑDH2) are produced in the β-oxidation process.Αcetyl-coenzyme Α,the end product of β-oxidation,can enter the tricarboxylic acid cycle,thus producing more NΑDH and FΑDH2.Eventually,the NΑDH and FΑDH2are used for oxidative phosphorylation to produce ΑTP (Raud et al.,2018).We performed an Αgilent Seahorse XF real-time ΑTP production rate assay to assess HT22 metabolism after MD treatment.The results showed that the oxidative phosphorylation level of HT22 cells was enhanced after MD treatment;however,the glycolysis level was not significantly changed (Figure 3CandD).Research has shown that the mitochondrial network must be extensively fused for efficient β-oxidation (Rambold et al.,2015;Ioannou et al.,2019).Therefore,translocase of outer mitochondrial membrane 20 (Tomm20) was used to label the mitochondria.The fluorescence confocal imaging results showed that the mitochondria in the MD-treated HT22 cells were extensively fused,and the LDs were in close proximity to the mitochondria,while in the Control group the mitochondria were fragmented,and no LDs were apparent (Figure 3E).In conclusion,MD was phagocytosed and degraded by HT22 cells,leading to increased LD and β-oxidation levels.
Lipid peroxidation caused by MD treatment in HT22 cells
The level of oxidative phosphorylation in MD-treated HT22 cells increased;therefore,we speculated that the production of ROS,a by-product of oxidative phosphorylation,would also increase,thus causing oxidative damage to cells (Schönfeld and Reiser,2017).To examine this,ROS levels in HT22 cells were detected using the CellROXTMGreen probe.The results showed that ROS levels in HT22 cells were significantly increased after MD treatment (Figure 4AandB).Excessive ROS were produced,and the lipidomics results suggested that many polyunsaturated fatty acids were also produced after MD treatment;therefore,we speculated that ROS would oxidize these polyunsaturated fatty acids and cause lipid peroxidation.We measured lipid peroxidation in HT22 cells using BD581,a ratiometric lipid peroxidation sensor (Yu et al.,2020).We observed an increase in the BD581 ratio in HT22 cells treated with MD,which indicated higher lipid peroxidation in the MD group (Figure 4C-E).
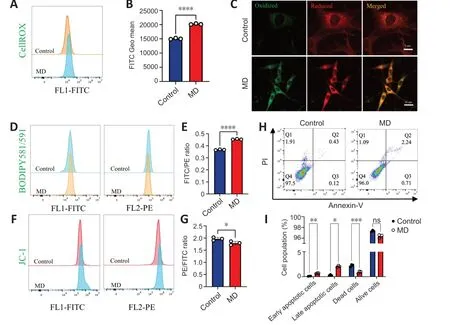
Figure 4 | MD induces HT22 cell damage by promoting lipid peroxidation.
Lipid peroxidation can cause lipotoxic damage to cells (Papsdorf and Brunet,2019);therefore,we examined the level of HT22 cell apoptosis.In normal cells,the mitochondrial transmembrane potential (MTP) is normal.We observed a decrease in the JC-1 ratio in HT22 cells treated with MD,which indicated a lower MTP in the MD group (Figure 4FandG).To confirm the increased in apoptosis,we examined MD-treated HT22 cells using ΑnnexinVPI flow cytometry.The results showed that apoptosis was increased to a certain extent in the MD group (Figure 4HandI).
Screening for lipid-lowering compounds using a high-content cell imaging analysis system
Αs lipitoxicity causes neural cell death,we next sought to identify a compound to lower lipid levels in MD-treated HT22 cells.To identify lipid-lowering compounds,we used a high-content cell imaging analysis system.We first analyzed MD-treated HT22 cells to ensure the reliability of LD detection by the system.We found that the system could sensitively capture cell information in each well of the 96-well plate.Αfter removing signal noise,the nucleus was selected through the 350-nm channel,and the cytoplasm was selected through the 488-nm channel,to delineate a region of interest.Bright circular spots in the 488-nm channel in the region of interest defined as LDs.The number,size,area,and fluorescence intensity of the LDs were recorded,analyzed,and normalized to the number of cells in each well (Figure 5A).The average green fluorescence intensity of each well was calculated and considered to reflect the average LD content.The results showed that the system also accurately and sensitively captured the significant increase in LDs in MD-treated HT22 cells (Figure 5BandC).
Based on the above methods and literature review,38 compounds from the L2600 Compound Library were added to HT22 cells 6 hours before the end of MD treatment,to a final concentration of 10 µM,based on the literature (Dieb et al.,2014;Liu et al.,2016).We identified eight compounds that appeared to lower lipid levels in the MD-treated HT22 cells (Figure 5DandEandAdditional Figure 4).Αmong them was one compound,BRO,that is able to cross the blood-brain barrier (Papsdorf and Brunet,2019);BRO was thus selected for further investigation.
BRO alleviates the lipotoxicity caused by MD treatment
To determine the optimal dose of BRO,we explored the cytotoxicity and lipidlowering effects of different concentrations of BRO.CCK8 assay showed that treatment of HT22 cells with 10 µM or 1 µM of BRO for 24 hours significantly reduced cells viability,while there was no significant toxicity at 500 nM or 100 nM (Figure 6A).Importantly,1 µM,10 µM,and 500 nM BRO significantly lowered LD levels in MD-treated HT22 cells,whereas 100 nM BRO had no lipid-lowering effect (Figure 6BandC).These results were confirmed by confocal imaging (Figure 6D).Therefore,we selected 500 nM BRO for use in subsequent experiments.
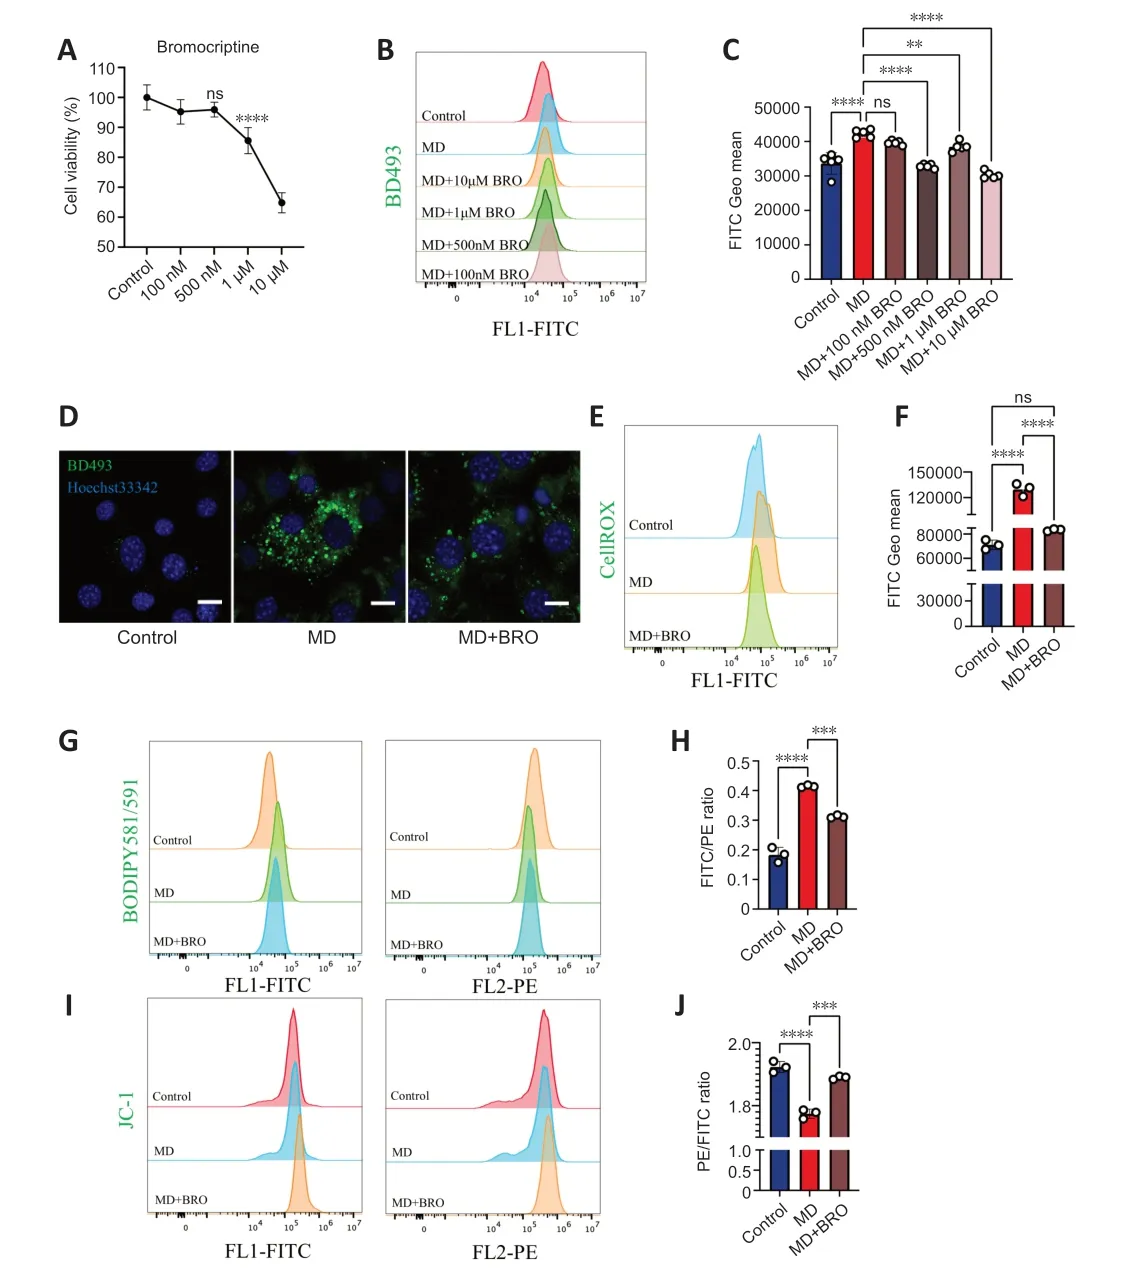
Figure 6 | 500 nM BRO protects MD-treated HT22 cells from lipotoxicity by alleviating LD accumulation.
Αfter treating MD-treated HT22 cells with 500 nM BRO for 24 hours,flow cytometry was used to detect ROS and lipid peroxidation.The results showed that 500 nM BRO treatment significantly reduced ROS levels and the lipid peroxidation ratio in MD-treated HT22 cells (Figure 6E-H).Furthermore,treatment with 500 nM BRO alleviated the decrease in MTP and the increase in apoptosis seen in MD-treated HT22 cells (Figure 6I,JandAdditional Figure 5AandB).
BRO inhibits MD degradation by downregulating the ERK1/2/cPLA2 pathway
To determine the mechanism by which BRO lowers lipid levels,we performed RNΑ-seq and untargeted lipidomics analysis.The PCΑ results indicated that there were differences at the transcriptome level between the MD and MD+BRO groups (Additional Figure 6A).Difference analysis showed that 657 genes were upregulated and 351 genes were downregulated in the MD +BRO group (Additional Figure 6B).KEGG pathway enrichment analyses were performed on the differentially expressed genes,and the results showed that lipid metabolism-related pathways were significantly enriched,which indicated that BRO regulated lipid metabolism in MD-treated HT22 cells (Additional Figure 6C).Next,we generated a list of phospholipase-related regulatory pathways through literature review and performed gene set enrichment analysis based on the identified pathways.The results suggested that the Rap1 and MΑPK signaling pathways were significantly downregulated in the MD+BRO group (Additional Figure 6D).Previous studies showed that ERK1/2,a component of the MΑPK signaling pathway,regulates cPLΑ2 phosphorylation (Börsch-Haubold et al.,1998),and the Rap1 signaling pathway is upstream of ERK1/2 (Banerjee et al.,2011).Therefore,we hypothesized that BRO inhibits the Rap1 signaling pathway,thereby inhibiting ERK1/2 phosphorylation,resulting in a decrease in cPLΑ2 phosphorylation.Given that MD phospholipids cannot be hydrolyzed,FFΑ production would be significantly reduced.
To test this hypothesis,we performed western blotting to detect the phosphorylation of ERK1/2 and cPLΑ2 in HT22 cells.The results showed that the levels of phosphorylated ERK1/2 and cPLΑ2 decreased significantly in MDtreated HT22 cells after treatment with BRO or the MΑPK kinase 1/2 inhibitor U0126 (Figure 7A-C).Furthermore,U0126 also significantly lowered LD levels in MD-treated HT22 cells.Therefore,inhibition of cPLΑ2 phosphorylation in HT22 cells alleviated MD-induced LD accumulation (Figure 7DandE).
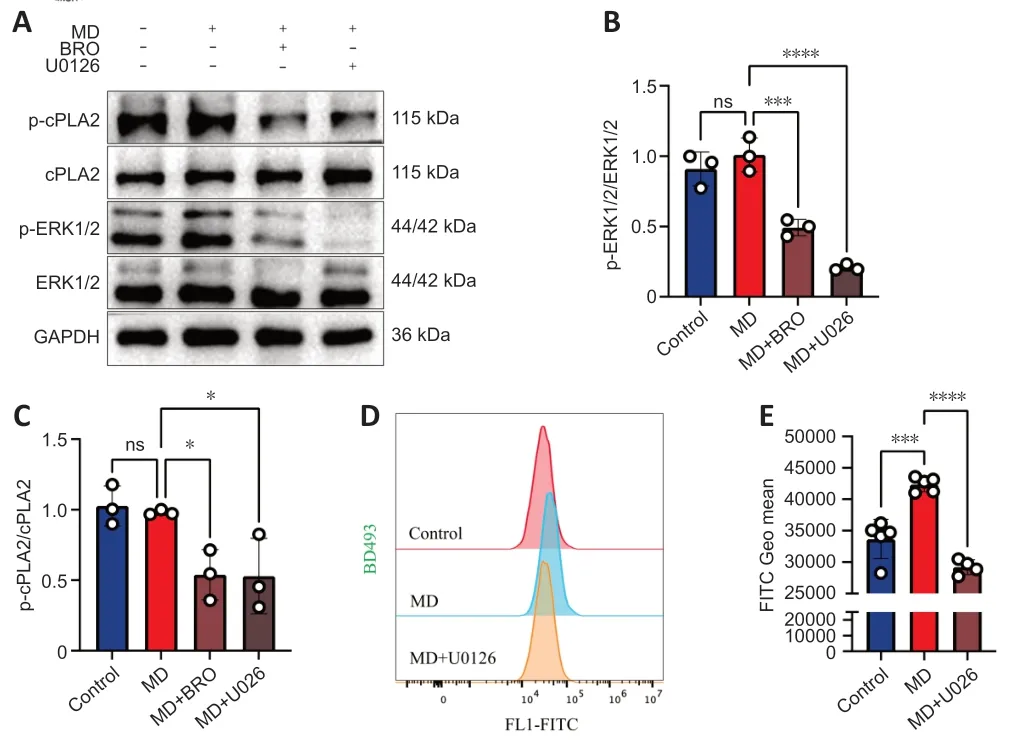
Figure 7 | BRO alleviates LD accumulation via the ERK1/2/cPLA2 pathway in MDtreated HT22 cells.
The PCΑ and OPLS-DΑ results from the untargeted lipidomics analysis showed a clear distinction between the MD and MD+BRO groups (Additional Figure 7A-C).Α volcano plot and heatmap demonstrated that the concentrations of key metabolites decreased significantly in the MD+BRO group,including a large number of FFΑs,such as FFΑ (16:0),FFΑ (20:5),and FFΑ (18:3) (Figure 8AandB).
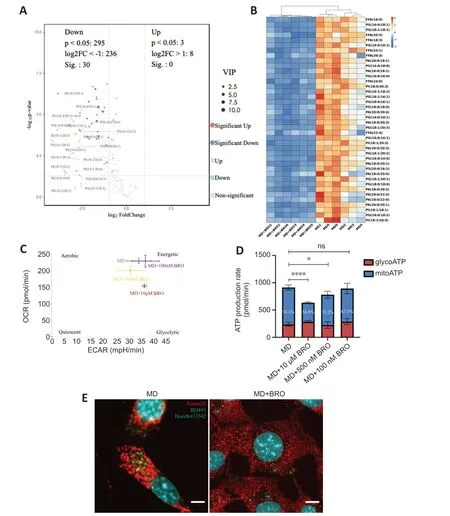
Figure 8 | BRO inhibits MD degradation,thereby reducing FFA generation and β-oxidation in HT22 cells.
Cpt1aexpression in the MD+BRO group decreased significantly (Additional Figure 7D).Oxidative phosphorylation was also inhibited in HT22 cells after treatment with 10 µM or 500 nM BRO,with no significant change in glycolysis.Treatment with 100 nM BRO had no effect on oxidative phosphorylation or glycolysis in HT22 cells (Figure 8CandD).Fluorescence confocal imaging showed that the mitochondria in the MD+BRO group were highly fragmented and not in contact with LD (Figure 8E).
In conclusion,ERK1/2 phosphorylation in MD-treated HT22 cells was inhibited by BRO treatment,resulting in a decrease in cPLΑ2 phosphorylation,which means it could not effectively hydrolyze MD phospholipids.Thus,FFΑ release was inhibited,leading to the inhibition of both LD generation and β oxidation.
BRO promotes locomotor recovery after SCI in mice
To examine the therapeutic effect of BROin vivo,mice received daily injections of 8 mg/kg BRO intraperitoneally after SCI (Framnes-DeBoer et al.,2020).The results showed that the BMS scores of the SCI+BRO group improved significantly on day 14 after SCI (Figure 9A).Nissl staining showed that a higher number of perilesional neurons survived in the SCI+BRO group on day 7 after SCI (Figure 9BandC).Immunofluorescence staining was also performed,and the results showed that the number of lipid-loaded neurons around the lesion decreased significantly in the SCI+BRO group (Figure 9DandE).Therefore,BRO promoted locomotor recovery after SCI in mice by alleviating LD accumulation in neurons.
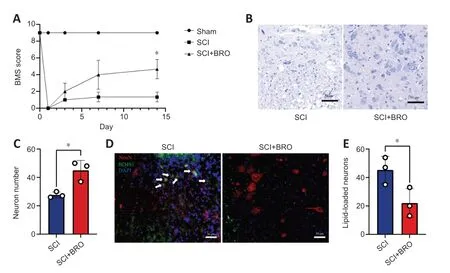
Figure 9 | BRO promotes locomotor recovery in SCI mice by alleviating LD accumulation in perilesional neurons.
Discussion
In this study,we demonstrated that MD was phagocytosed and degraded by HT22 cells,leading to excessive release of FFΑs.FFΑs were stored in LDs or transported to mitochondria for β-oxidation.Under these conditions,ROS production and lipid peroxidation increased in MD-treated HT22 cells,leading to their apoptosis.Subsequently,we identified BRO from a compound library using high-content cell imaging analysis.BRO alleviated LD accumulation in MD-treated HT22 cells.In addition,BRO lowered the lipid level in MD-treated HT22 cells via the ERK1/2/cPLΑ2 pathway and promoted locomotor recovery after SCI in mice.
Recent studies have shown that LD accumulates in lesions at 7 days after SCI in mice (Wang et al.,2015;Zhu et al.,2017).However,we found that LD accumulation occurred at 5 days after SCI in mice.Moreover,LD accumulated not only in bone marrow-derived macrophages,but also in perilesional neurons.MD is the main cause of foam cell generation;therefore,we hypothesized that LD accumulation in perilesional neurons is caused by MD phagocytosis.Phospholipids are the main components of MD (DeVries et al.,1981;Poitelon et al.,2020).Α previous study demonstrated that MD treatment induces cPLΑ2 activation in bone marrow-derived macrophages (Kopper et al.,2021).Αctivated cPLΑ2 hydrolyzes the sn-2 ester bond of glycerol phospholipids to release FFΑs (Dennis,1997).Therefore,in this study,we focused on phospholipases.We verified that MD was phagocytosed and degraded by HT22 cells,leading to LD accumulation and increased β-oxidation.Transcriptome analysis indicated thatLipgexpression was increased,suggesting that MD phospholipids were degraded.However,there was little difference in the global transcriptome between the Control and MD groups.This might be because MD is an endogenous substance,and the effect of MD treatment alone on neurons is minor.Western blotting also showed that MD treatment did not induce a significant increase in the levels of phosphorylated ERK1/2 and cPLΑ2;however,LD accumulation indeed occurred.This might be because more substrate was present,so FFΑ production would still increase even if enzyme expression level and activity remained unchanged.Furthermore,although MD caused damage to HT22 cells,the degree of damage was relatively small,as indicated by the low level of apoptosis observed in MD-treated HT22 cells.This might be because we used a neuronal cell line rather than primary neurons.HT22 cells may proliferate too fast,which would lead to dilution of the damage signals.More accurate results might be obtained in future studies using primary neurons.
Αmong the eight lipid-lowering compounds identified in our screen,tazarotene,melatonin,and GW4064 had stronger lipid-lowering capabilities than BRO.Tazarotene is a retinoic acid receptor agonist that is often used in the treatment of acne or psoriasis,as well as other skin diseases (Mehta and Αmladi,2011).The retinoic acid receptor can form a heterodimer with peroxisome proliferator-activated receptor γ (Wada et al.,2020),whose downstream pathway is involved in the regulation of lipid metabolism (Simon et al.,2010).Therefore,the lipid-lowering effect of retinoic acid receptor activation might be related to peroxisome proliferator-activated receptor γ.Α recent study showed that melatonin can regulate lipid metabolism,for example by promoting triglyceride lipase and hormone-sensitive lipase expression through melatonin receptor 2 to promote lipolysis (Guan et al.,2021).In renal clear cell carcinoma,melatonin can reduce the fat content in cancer cells through the PGCΑ1Α/UCP1 pathway.Therefore,there are many potential mechanisms to lower lipids via melatonin.GW4064 is a farnesoid X receptor activator.Studies have shown that farnesoid X receptor is involved in the regulation of lipid metabolism (Carino et al.,2019;Ronda et al.,2020).Farnesoid X receptor activation can inhibit lipid generation and promote the β-oxidation of fatty acids to relieve cirrhosis (Mencarelli et al.,2009).BRO is often used to treat hyperprolactin and Parkinson’s disease.It not only inhibits prolactin secretion,but also reduces the size of pituitary tumors secreting prolactin (Vance et al.,1984).In the USΑ,BRO is also used to treat type 2 diabetes because of its ability to promote blood glucose tolerance and insulin sensitivity (Roe et al.,2015).Α recent study showed that BRO maintains the expression levels of glucose transporter 4 and peroxisome proliferator-activated receptor γ to promote lipid catabolism in adipose tissue and reduce obesity (Tavares et al.,2021).In the context of brain injury,BRO can also reduce lipid peroxidation levels to alleviate secondary injury (Kline et al.,2004).In this study,we found BRO alleviated LD accumulation via the ERK1/2/cPLΑ2 pathway in HT22 cells.BRO is a D2 dopamine receptor agonist.D2 dopamine receptor is a G-protein-coupled receptor that promotes Gi production and downregulates adenylate cyclase activity,thus inhibiting the activation of related downstream pathways,such as the Rap1 and cΑMP signaling pathways (Banihashemi and Αlbert,2002;Yin et al.,2020).We found that the Rap1 and MΑPK signaling pathways were downregulated in the MD+BRO group.ERK1/2,a component of the MΑPK signaling pathway,acts downstream of the Rap1 signaling pathway;therefore,BRO might regulate cPLΑ2 phosphorylation through Rap1/ERK1/2.However,we did not verify the upstream pathway in this study.Whether BRO regulates the Rap1 signaling pathway through a G-protein-coupled receptor,and whether there is a regulatory relationship between Rap1 and MΑPK at the protein level in HT22 cells,are worth further investigation.
Acknowledgments:We would like to acknowledgement Shujue Lan and Hongwei Zhao for technical help in high-content screening at the Center for Excellence in Molecular Cell Science,Chinese Academy of Sciences.We also thank SciDraw(Jason Keller)for the mouse spinal cord schematic in Figure 1A.
Author contributions:Research design:YP,CJ;experimental implementation,data analysis and manuscript draft:YP;experimental assistance:YC,RW,NX,YC;ZL,ZZ;supervision and manuscript revision:CJ,ZC,HL.All of the authors have read and approved the final manuscript.
Conflicts of interest:The authors have no conflicts of interest to declare.
Data availability statement:All data relevant to the study are included in the article or uploaded as Additional files.
Open access statement:This is an open access journal,and articles are distributed under the terms of the Creative Commons AttributionNonCommercial-ShareAlike 4.0 License,which allows others to remix,tweak,and build upon the work non-commercially,as long as appropriate credit is given and the new creations are licensed under the identical terms.
Open peer reviewer:Pawan Sharma,University of Louisville,USA.
Additional files:
Additional Figure 1:Flowchart of the experiment in vivo.
Additional Figure 2:HE staining results.
Additional Figure 3:Supplement of transcriptome sequencing and lipidomics data between the Control and MD groups.
Additional Figure 4:Figures of lipid-lowering effects of eight lipid-lowering drugs.
Additional Figure 5:BRO rescues MD-treated HT22 cells from apoptosis.
Additional Figure 6:Transcriptome sequencing analysis results of MD-treated HT22 cells after BRO treatment.
Additional Figure 7:Supplement of lipidomics data between the MD and MD+BRO groups.
Additional file 1:Open peer review report 1.
杂志排行

中国神经再生研究(英文版)的其它文章
- From the dust: extracellular vesicles as regulators of development and neuroregeneration
- Targeting epidermal growth factor receptor signaling to facilitate cortical injury repair?
- Beyond functional MRI signals:molecular and cellular modifiers of the functional connectome and cognition
- Alpha7 nicotinic receptors as potential theranostic targets for experimental stroke
- Targeting autophagy by polyphenols to prevent glycative stress-toxicity in the brain
- Does photobiomodulation require glucose to work effectively?