Power-law patterns in the Phanerozoic sedimentary records of carbon, oxygen, sulfur,and strontium isotopes
2024-01-25HaitaoShang
Haitao Shang
Institute of Ecology and Evolution, University of Oregon, Eugene, OR, 97403, USA
Abstract Power-law patterns appear in a variety of natural systems on the modern Earth; nevertheless,whether such behaviors appeared in the deep-time environment has rarely been studied.Isotopic records in sedimentary rocks, which are widely used to reconstruct the geological/geochemical conditions in paleoenvironments and the evolutionary trajectories of biogeochemical cycles, offer an opportunity to investigate power laws in ancient geological systems.In this study, I focus on the Phanerozoic sedimentary records of carbon, oxygen, sulfur, and strontium isotopes, which have well documented and extraordinarily comprehensive datasets.I perform statistical analyses on these datasets and show that the variations in the sedimentary records of the four isotopes exhibit power-law behaviors.The exponents of these power laws range between 2.2 and 2.9;this narrow interval indicates that the variations in carbon,oxygen,sulfur,and strontium isotopes likely belong to the same universality class,suggesting that these systematic power-law patterns are governed by universal, scale-free mechanisms.I then derive a general form for these power laws from a minimalistic model based on basic physical principles and geosystem-specific assumptions, which provides an interpretation for the power-law patterns from the perspective of thermodynamics.The fundamental mechanisms regulating such patterns might have been ubiquitous in paleoenvironments,implying that similar power-law behaviors may exist in the sedimentary records of other isotopes.
Keywords Power laws, Phanerozoic sedimentary records, Carbon isotope (δ13C), Oxygen isotope (δ18O),Sulfur isotope (δ34S), Strontium isotope (87Sr/86Sr)
1.Introduction
The Phanerozoic Eon witnessed a variety of spatial and temporal changes in the geological system.The fingerprints that isotopes left in sedimentary records provide a window through which to reconstruct environmental conditions on the ancient Earth and to investigate significant changes in biogeochemical cycles(Hoefs,1997;Michener and Lajtha,2007).Among the isotopes that are used as geological/geochemical proxies for paleoenvironments, the isotopes of four elements—carbon(δ13C),oxygen(δ18O),sulfur(δ34S),and strontium (87Sr/86Sr) — have rather long histories of application in geosciences and have been widely used to explore fundamental geological questions.After extensive measurements of δ13C,δ18O,δ34S,and87Sr/86Sr in a variety of geological settings in the past several decades, we have well documented datasets for these four isotopes,allowing us to investigate their evolutionary trajectories and dynamical properties over geologic time.
Carbon,oxygen,sulfur,and strontium isotopes serve as proxies for different aspects of the environmental conditions or biogeochemical cycles.Fluctuations in carbon isotope records reflect the variations in the exchange between the isotopically heavy inorganic and isotopically light organic reservoirs (Hayes and Waldbauer, 2006; Cramer and Jarvis, 2020).Oxygen isotopes, which are influenced by and covary with temperature, have recorded climate changes through geologic time(Veizer and Prokoph,2015;Grossman and Joachimski,2020).The variations in sulfur isotopes are linked to marine sulfate concentrations via microbial metabolisms, especially microbial sulfate reduction,and thus offer an avenue to study seawater sulfate changes throughout Earth history (Paytan et al., 2020;Present et al.,2020).Strontium isotopes are tied to the balance between the fluxes from the continental and mantle reservoirs and therefore are widely used to reconstruct weathering rates and tectonic events in deep time(Prokoph et al.,2008;McArthur et al.,2020).
The power law is a functional relation between two variables in which one variable changes as a power of the other.Generally, power laws are expressed as y ∝x-α,where x and y are two variables and α>0 is usually referred to as the power-law exponent.On a double logarithmic plot, they are written as log10y ∝ -α log10x, which is a straight line and implies that the underlying regularity of this relation is independent of specific scales (Schroeder, 2009; Bak, 2013).Although power laws are commonly taken as hints of fundamental mechanisms behind the observed data, the specific mechanisms of many power-law behaviors remain unknown (Schroeder, 2009; Bak, 2013).Power laws are ubiquitous in the modern Earth system(Schroeder, 2009; Bak, 2013); for example, the distribution of the size of lakes and faults(Mandelbrot,1982;Scholz and Mandelbrot, 1989), the frequency versus magnitude of earthquakes and volcanic eruptions(Scholz and Mandelbrot,1989; Mega et al., 2003), and the degradation rate constant versus age of organic matter in natural ecosystems(Middelburg,1989;Katsev and Crowe, 2015; Shang, 2023a) have been shown to exhibit power laws.Whether such behaviors existed in the deep-time geological system, however, has rarely been studied, partially due to the sparsity and limited availability of datasets on a majority of geological/geochemical quantities characterizing paleoenvironments.After all, investigating power-law patterns,which usually spans several orders of magnitude, requires large and diverse datasets that consist of data points representing enormously small and extremely large events.The δ13C,δ18O,δ34S,and87Sr/86Sr,which have extraordinarily comprehensive datasets in deep time, especially during the Phanerozoic Eon, offer an opportunity to explore power-law patterns on the ancient Earth.
Here,I investigate the variations in the Phanerozoic sedimentary records of δ13C, δ18O, δ34S, and87Sr/86Sr and show that they exhibit power-law behaviors.The exponents of these power laws vary between 2.2 and 2.9 (with a mean of 2.58 and standard deviation of 0.23);this small range of power-law exponents suggests that variations in these four isotopes likely belong to the same universality class, implying that the systematic power laws for these four isotopes may be regulated by universal and scale-free mechanisms.To explore the underlying mechanisms, I derive a general form of these power laws with some basic physical principles and geosystem-specific assumptions, which offers an interpretation for the origin of such patterns from the perspective of thermodynamics.Due to the limited availability of datasets on other isotopes,I only focus on the power-law patterns for carbon, oxygen,sulfur, and strontium isotopes in this study.However,the fundamental principles governing such behaviors should have been universal, indicating that the sedimentary records of other isotopes might also exhibited power-law patterns in deep time.
2.Material and methods
2.1.Data processing and fitting
The dataset on δ13C is from Cramer and Jarvis(2020) and Westerhold et al.(2020), the dataset on δ18O is from Veizer and Prokoph(2015)and Westerhold et al.(2020),the dataset on δ34S is from Present et al.(2020), and the dataset on87Sr/86Sr is from Prokoph et al.(2008).Power laws generally span several orders of magnitude; I perform spline interpolations to obtain data points at fine timescales(Friedman,1991;De Boor, 2001; Ruppert, 2002).Spline interpolations have been shown to be effective for fitting the sedimentary records of these four isotopes at geologic timescales (Howarth and McArthur, 1997; Kasting et al., 2006; Wu et al., 2010; Ovtcharova et al.,2015).Here I interpolate each dataset with different types of splines including the smoothing (De Boor,2001), regression (Friedman, 1991), and penalized(Ruppert,2002)splines and find that penalized splines generate the best-fitting curve (based on the residuals) for the four datasets.I calculate the data value at every 0.05 million years with the best-fitting penalized splines.
I denote the time series of an isotope (i.e., data points in an isotopic dataset) as {ξi}, where ξiis the mean of data at time point i.For each dataset, I take the difference between the data values at every two consecutive time points (i.e., ψiand ψi+1) and denote this variation at time point i as θi= ξi+1- ξi.The variations (i.e., θi’s) in the time series {ψi} are classified into three categories:decrease(D),increase(I),and change(C).Logarithms of negative values are undefined;I denote the absolute values of variations in these three categories by |D |= {|θi|:θi<0}, |I |={|θi|:θi>0},and |C |= {|θi|:θi≠0},and use data points in these three categories to investigate power laws.Obviously,|C|is the union of|D|and|I|:|C|=|D|∪|I|.I do not consider θi= 0 here not only since a zero value indicates no variation but also because the logarithm of zero is mathematically undefined.
The absolute values of variationsdefined above)in each category(i.e., |D |, |I |,and |C|) are grouped into bins.The optimal number of bins,NB,is determined using Sturges'Rule:NB=log2(ND)+1,where NDis the number of data points in a dataset,and the number of data (i.e., counts) in the k-th bin is denoted as Nk.An intriguing feature of power-law distributions is their right tails, where large values of random variables appear(Clauset et al.,2009;Alstott et al., 2014).The initial data values on the left side sometimes do not follow a power-law pattern and should not be included when fitting power laws(Clauset et al., 2009; Alstott et al., 2014).To determine where to truncate the set of counts {Nk}, one needs to identify the data point beyond which the power-law relation appears; this truncation point is henceforth denoted as Nmin.A common approach to identify Nminis establishing a power-law fit starting from each individual data point in {Nk} and then choosing the point generating the minimum value for the distance between the fit and the data (Clauset et al., 2009; Alstott et al., 2014).The power law best fitting the truncated dataset with Nminas the initial point therefore is the optimal power law for the data.
2.2.Goodness-of-fit tests
2.3.Likelihood-ratio tests
The power law is not the only distribution that is able to result in a straight line on a log—log plot;other heavy-tailed distributions, such as stretched exponential and lognormal distributions, can generate datasets with distributions that are close to power laws.To test if the best-fitting power laws fit the given datasets better than other heavy-tailed distributions,I conduct the likelihood-ratio test(Clauset et al.,2009):LR = log (LPL/LHT), where LPLis the likelihood,fitted using the above procedure,under the hypothesis of a power-law distribution; while LHTis the likelihood, fitted using maximum likelihood estimation,under the hypothesis of an alternative heavy-tailed distribution.When LR is greater than zero, the bestfitting power law performs better than the alternative heavy-tailed distribution; however, when LR is less than zero, the alternative heavy-tailed distribution outperforms the best-fitting power law.I standardize LR with the standard deviation to correct for random fluctuations (Vuong, 1989; Clauset et al.,2009) and get a p-value for justifying whether the sign of LR is statistically significant.I set the significance level for the p-value to 0.05.When the p-value is less than 0.05, I conclude that one distribution outperforms the other for the given dataset; however,when the p-value is greater than or equal to 0.05,the likelihood-ratio test is not conclusive because the sign of LR may originate from chance fluctuations.
3.Results and discussion
3.1.Power laws in Phanerozoic isotopic records
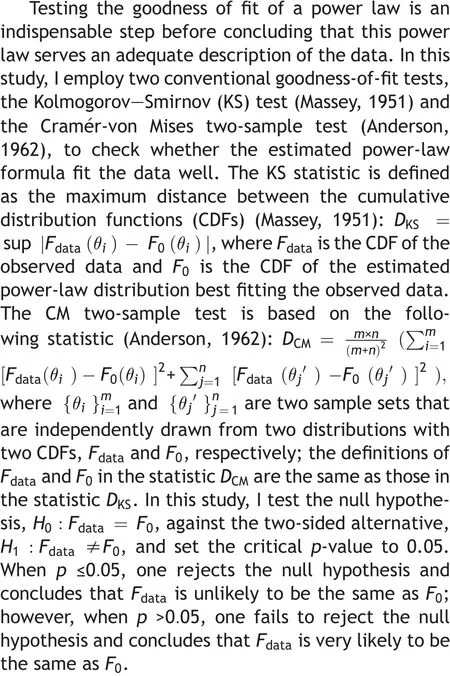
Fig.1 illustrates the variations (i.e., θi’s) in (A)δ13C, (B) δ18O, (C) δ34S, and (D)87Sr/86Sr during the Phanerozoic Eon.I classify the variations in each of the four isotopes into three categories: decrease( |D |), increase ( |I |), and change ( |C |), which are defined in Section 2.1.Fig.2 shows power-law patterns in these three categories of variations in(A—C) δ13C, (D—F) δ18O, (G—I) δ34S, and(J—L)87Sr/86Sr.The fitted mathematical expressions of these power laws and their coefficients of determination (R2’s) and root mean square errors (RMSEs)are presented in Table 1.To justify the goodness of fit of these power laws, I perform the KS and CM tests and calculate their p-values, which are denoted by pKSand pCM, respectively.The results (Table 1) show that the p-values of these tests are all much greater than the critical threshold of 0.05 (Section 2.2),suggesting that the mathematical formulas of the power laws in Table 1 fit the data well.Although a straight line on a log—log plot is a key characteristic of power-law patterns,it does not guarantee that the fitted data are from a power-law distribution because other heavy-tailed processes, such as stretched exponential and lognormal distributions, are able to generate data that have distributions similar to power laws due to random fluctuations (Clauset et al., 2009; Alstott et al., 2014).To test whether the best-fitting power laws in this study outperform other heavy-tailed distributions, I perform the likelihood-ratio test (Section 2.3).The results suggest that the best-fitting power laws presented in Table 1 and Fig.2 fit the datasets better than exponential, stretched exponential, and lognormal distributions.In the next section, I show that a general form of the power-law relations presented here(Table 1 and Fig.2)can be derived from a conceptual model with basic principles of statistical mechanics and some geosystem-specific assumptions.
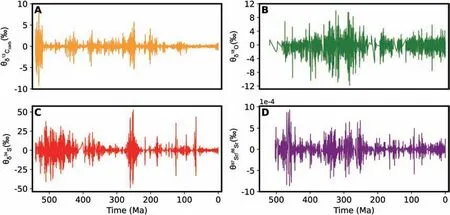
Fig.1 Time series of the variations (i.e., θi’s defined in Section 2.1) in (A) δ13C (orange), (B) δ18O (green),(C) δ34S (red), and (D) 87Sr/86Sr(purple) during the Phanerozoic Eon.
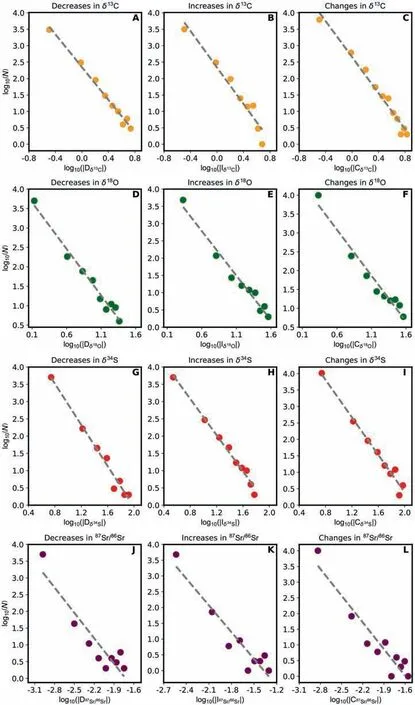
Fig.2 Power laws of the decreases(|D|),increases(|I|),and changes(|C|)in the Phanerozoic sedimentary records of(A—C)δ13C,(D—F)δ18O,(G—I) δ34S, and (J—L) 87Sr/86Sr.Orange, green, red, and purple circles represent counts (i.e., N’s) versus variations (i.e., |θi |’s defined in Section 2.1) of δ13C, δ18O, δ34S, and 87Sr/86Sr, respectively.Grey dashed lines are the least-squares fitting of data on log—log plots.The mathematical expressions of power laws,the R2’s and RMSEs of least-squares-fitting lines,and the KS and CM p-values for goodness-of-fit tests are provided in Table 1.
3.2.Derivation of the general form of power laws in isotopic records
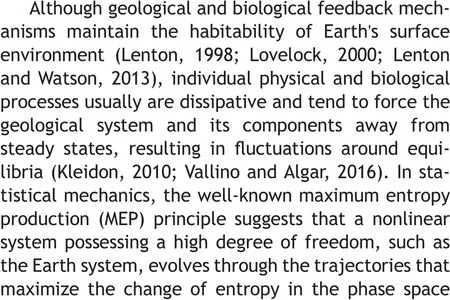
The values of δ13C, δ18O, δ34S, and87Sr/86Sr manifest different aspects of planetary-scale biogeochemical cycles; their variations thus should characterize the changes in the states of the global biogeosystem.As mentioned in Section 2.1,I denote the realizations of an isotopic value at time step i by ξi.The entropy of the biogeosystem at the state corresponding to ξiis then expressed as S (ξi) = - log p (ξi), where p (ξi) is the probability that the realization ξioccurs and S (ξi) characterizes the extent to which the system at the state corresponding to ξideviates from the equilibrium.I denote the difference between these two consecutive realizations by Θi= ξi+1-ξi,where i∊I and I is the index set of all realizations.Here, I denote the difference between ξi+1and ξiby Θiinstead of θias defined in Section 2.1 because, for simplicity, I assume that ξi<ξi+1in the following derivation so that Θi>0 holds for all i ∊I and thus log Θiis always mathematically well-defined.For the case of Θi<0, the same general form of power laws(i.e.,N(Θi)~|Θi|-α)can be obtained by replacing Θiwith its absolute value(refer to |D |, |I |,and |C|defined in Section 2.1).The case of Θi= 0 is not considered here because the logarithm of zero is not defined in mathematics (Section 2.1).
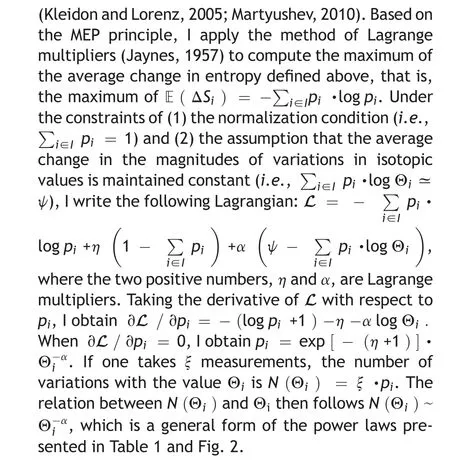
When the system switches from state ξito state ξi+1, the change in entropy is expressed as ΔSi= S(ξξi+1) -S(ξi).According to the additivity of entropy(Skilling,1989;Almeida,2003),I obtain ΔSi= S(ξi+1- ξi) = - log p (Θi).For simplicity, I henceforth write p (Θi) as pi.The average of ΔSiover all i ∊I then can be expressed as E ( ΔSi) =•log pi, where E ( • ) is the expectation value of a variable.Moreover, as a probability density, the summation of piover i ∊I satisfiesThe Gaia hypothesis suggests that the geological and biological processes on Earth's surface are intertwined,driving the biogeosystem to a stable world (Lenton,1998; Lovelock, 2000; Lenton and Watson, 2013).Under a variety of feedback mechanisms,variations in the Earth system are balanced, maintaining Earth's surface environment and its components at steady states over geologic timescales (Lenton, 1998;Lovelock, 2000; Lenton and Watson, 2013).The structures of complex systems, such as Earth's surface environment,usually lie at certain intermediate levels between perfect order and perfect disorder(Anderson,1972; Prigogine, 1980; Bak, 2013); the order of magnitude of quantities may better characterize the variability and complexity of the global biogeosystem than their precise values.I denote the order of magnitude of the variation in isotopic values at time step i by O (Θi)~log Θi.Based on the steady-state evolution of the global biogeosystem proposed by the Gaia hypothesis(Lenton,1998;Lovelock,2000;Lenton and Watson,2013),I assume that the average change in the magnitudes of variations in isotopic values is a constant:Σ i∊Ipi•log Θi≃ψ,where ψ is a constant.
3.3.Geological implications
The systematic power-law patterns appearing in the variations of carbon,oxygen,sulfur,and strontium isotopes(Table 1 and Fig.2)have two straightforward implications: (1) large variations in these isotopic records are much rarer than small ones, and (2) these variations are likely to have been regulated by scalefree mechanisms (Schroeder, 2009; Bak, 2013).In statistical mechanics,the specific values of power-law exponents(i.e.,α’s introduced in Section 1)are used as a key indicator of systems' dynamical properties.Fig.3 summarizes the exponents of power laws for the variations in carbon (orange bars), oxygen (green bars), sulfur (red bars), and strontium (purple bars)isotopes.The mean value and standard deviation of these exponents are μα≃2.58 (vertical grey dashed line in Fig.3) and σα≃0.23, respectively.The coefficient of variation (i.e., the ratio of the standard deviation to the mean)equals σα/μα≃8.91%,indicating that the deviations of these exponents are very small relative to their mean.From the perspective of nonlinear dynamics, systems having identical powerlaw exponents are in the same universality class(Kadanoff, 1990; Stanley et al., 2000).The rather small range of the exponents shown in Fig.3 implies that the variations of carbon, oxygen, sulfur, and strontium isotopes in the Phanerozoic sedimentary records may belong to the same universality class,suggesting that these power-law patterns are likely to be regulated by certain fundamental and universal mechanisms.However, like many complex systems possessing power-law patterns, the underlying mechanisms responsible for the power laws shown in this study (Table 1 and Fig.2)remain unclear.

Fig.3 Power-law exponents (α’s) for the three categories of variations (i.e., decrease |D|, increase |I|, and change |C|) in the Phanerozoic records of carbon (δ13C), oxygen (δ18O), sulfur (δ34S), and strontium (87Sr/86Sr) isotopes.Orange, green, red, and purple bars represent the power-law exponents for the variations in δ13C,δ18O,δ34S,and 87Sr/86Sr,respectively.Vertical grey dashed line shows the mean of the exponents of all power laws for the four isotopes.
In statistical mechanics, power-law patterns are commonly attributed to self-organized criticality(SOC), which refers to the phenomenon that the internal interactions of a large system self-organize it into states at which power-law behaviors appear (Bak et al., 1987, 1988).Nevertheless, power-law patterns, as an emergent property of SOC, do not necessarily originate from the latter (Hergarten, 2002;Solow, 2005; Markovi′c and Gros, 2014); whether the power laws presented here (Table 1 and Fig.2) are related to SOC remains unknown.In this work,I derive a general form of these power laws with a simple model based on some physical principles and geosystemspecific assumptions.This model, however, does not provide interpretations for the specific values of the power-law exponents;more universal and fundamental theories are expected to be suggested by future work to shed light on the geological and biological mechanisms responsible for these power-law patterns.
The extraordinarily large variations in deep-time sedimentary records of isotopes, which appear on the right tails of the power-law patterns in Fig.2,have attracted much attention in geological and geochemical studies and are considered to manifest extreme events in the deep-time biogeosystem.For instance, the Lomagundi-Jatuli event (the most protracted positive excursion of the carbon isotope in Earth history) (Grotzinger et al., 2011) and Shuram-Wonoka excursion (the deepest negative excursion of the carbon isotope in Earth history) (Husson et al.,2015) link to two significant transitions in the evolution of Earth's oxygen cycle: the Great Oxygenation Event (~2400—2300 Ma) and the Neoproterozoic Oxygenation Event(~850—540 Ma)(Lyons et al.,2014;Canfield, 2016), respectively.Another example is the prominent excursions of carbon and oxygen isotopes that simultaneously occurred at the boundary between the Paleocene and Eocene epochs (~56 Ma),also referred to as the Paleocene—Eocene Thermal Maximum event, indicating a period of abrupt and remarkable global warming (McInerney and Wing,2011; Bowen et al., 2015).These extreme events contribute to the right tails of the power laws(Fig.2)and are likely to have been triggered by the complex feedback mechanisms in Earth's biogeochemical cycles (McInerney and Wing, 2011; Shang et al., 2022;Tierney et al., 2022; Shang, 2023b).However, the power-law behaviors in other deep-time geological/geochemical datasets may remain obscure because data points manifesting extreme events might have been treated as outliers and removed in the initial stage of statistical analyses.Therefore, careful assessments of seemingly abnormal data points in geological/geochemical measurements(prior to being discarded) are crucial for revealing the dynamical patterns (such as power laws) and their underlying mechanisms in paleoenvironments.
Due to the sparsity and limited availability of datasets on other isotopes, I investigate only the power laws for carbon, oxygen, sulfur, and strontium isotopes, which have comprehensive datasets after extensive studies in the past decades.Power-law patterns, however, probably exist in other isotopes characterizing deep-time physical/chemical conditions and biogeochemical cycles,such as lithium(δ7Li)(Penniston-Dorland et al.,2017;Kalderon-Asael et al.,2021),calcium(δ44/40Ca)(Farkaˇs et al.,2007;Bl¨attler et al., 2012), and uranium (δ234U, δ235U, and δ238U)(Zhang et al.,2020;Kipp et al.,2022)isotopes.Future measurements of Phanerozoic sedimentary records of these isotopes at the global scale could examine whether power-law behaviors also appear in their variations.Moreover, the fundamental physics governing the Phanerozoic Earth system should have been the same during the Precambrian, indicating that the isotopic records and other quantities characterizing geological changes (e.g., atmospheric CO2level and surface temperature)might have exhibited power-law patterns on the Precambrian Earth as well.These power laws can be used as hints to decipher the underlying mechanisms responsible for the planetaryscale dynamics of the Earth system over geologic time.
Funding
This work received no financial support from any project or organization.
Availability of data and materials
Data supporting the findings of this study are available upon request from the author.
Authors'contributions
H.S.conceived the project, performed the research, and wrote the manuscript.The author read and approved the final version of the manuscript.
Conflicts of interest
The author declares no known competing financial interests or personal relationships that could have appeared to influence the work reported in this paper.
Acknowledgements
I thank the Associate Editor-in-Chief Prof.Santanu Banerjee for valuable suggestions and securing reviewers for the manuscript and anonymous reviewers for thoughtful and constructive comments.
杂志排行
Journal of Palaeogeography的其它文章
- The reservoir characteristics and their controlling factors of the sublacustrine fan in the Paleogene Dongying Formation, Bohai Sea,China
- A synthesis of the Cretaceous wildfire record related to atmospheric oxygen levels?
- Trace fossil evidences of an Early Miocene paleoseismic event and depositional regime change from the Kutch (Kachchh) Basin
- Interpreting siliciclastic sedimentation in the upper Paleozoic Mulargia-Escalaplano Basin(Sardinia, Italy): influence of tectonics on provenance
- Evolution of Cenozoic sedimentary architecture in Central and Southern South China Sea basins
- Stratigraphy of the Alveolina elliptica group from the Middle Eocene of Iran: Calibration with calcareous nannofossils biozones and description of Alveolina ozcani n.sp.
