Distributions of dissolved oxygen and apparent oxygen utilization in the Cosmonaut Sea and Amundsen Sea in austral summer 2021
2024-01-25GUOJiayingYANGXufengZHAOJunZHUYuanliLIDongPANJianming
GUO Jiaying, YANG Xufeng, ZHAO Jun*, ZHU Yuanli, LI Dong & PAN Jianming
Article
Distributions of dissolved oxygen and apparent oxygen utilization in the Cosmonaut Sea and Amundsen Sea in austral summer 2021
GUO Jiaying1,2, YANG Xufeng1,2, ZHAO Jun1,2*, ZHU Yuanli1,2, LI Dong1,2& PAN Jianming1,2
1Key Laboratory of Marine Ecosystem Dynamics, Ministry of Natural Resources, Hangzhou 310012, China;2Second Institute of Oceanography, Ministry of Natural Resources, Hangzhou 310012, China
Dissolved oxygen (DO) and apparent oxygen utilization (AOU) are crucial parameters for investigating marine ecosystem evolution and the marine environment. In this study, DO and AOU data were obtained and their spatial distribution characteristics were explored in the Cosmonaut Sea and Amundsen Sea in austral summer 2021. The standard deviation range of DO parallel samples was < 0.1–3.7 μmol·L–1, which met the accuracy requirements of the survey method. The DO concentration decreased sharply with water depth in the photic zone and increased slowly to the bottom. AOU in the surface layer of the two seas was significantly negatively correlated with chlorophyll(<0.01), and AOU was significantly lower in the south Cosmonaut Sea than in the north Cosmonaut Sea and Amundsen Sea (<0.01). In austral summer, AOU was as low as < 130 μmol·L–1in the nearshore Cosmonaut Sea with thicker Antarctic Surface Water down to ca. 500 m. In early winter, AOU was lower than 50 μmol·L–1in the north Amundsen Sea in subsurface water (75–150 m). The unmodified Circumpolar Deep Water with high AOU (> 160 μmol·L–1) could surge up to ca. 150–200 m in both seas, with stronger intrusion in the Amundsen Sea. The AOU in bottom water was significantlylower (<0.01) in the Cosmonaut Sea (118.9±11.8 μmol·L–1) than the Amundsen Sea (141.7±7.4 μmol·L–1), indicating the stable existence of fresh oxygen-rich Antarctic Bottom Water in the Cosmonaut Sea.
dissolved oxygen, apparent oxygen utilization, Antarctic, Cosmonaut Sea, Amundsen Sea
1 Introduction
The concentration of dissolved oxygen (DO) in seawater is a crucial biogenic element parameter, and its relative saturation or consumption level is indicated by apparent oxygen utilization (AOU). DO is a fundamental driving factor for marine ecosystems (Gilly et al., 2013). A decrease in DO content may hinder biological reproduction and growth (Vaquer-Sunyer and Duarte, 2008) and can even result in the mass mortality of marine organisms, such as fish and crustaceans (Grantham et al., 2004). AOU can provide insights into the impact of marine biological activity and water mass mixing on DO distribution. With global warming, the AOU of global oceans has increased, and the DO content has decreased by 2% between 1960 and 2009 (Schmidtko et al., 2017). A model study predicted that the global ocean’s DO content will decrease by another 1%–7% in the next century (Keeling et al., 2010). Therefore, continuous researches on the temporal and spatial changes in oceanic DO content and AOU is a fundamental requirement for gaining a deeper understanding of global marine ecosystems and their changes.
The Southern Ocean is a highly vulnerable region to global change, where alterations in temperature, salinity, biological processes, and oceanic circulation can significantly impact the spatial distribution of DO. Studies have demonstrated that the melting of sea ice can intensify the stratification effect on the upper layers of high-latitude oceans, leading to a decrease in internal DO content, also known as ocean deoxygenation (Keeling et al., 2010). Over the past 5 decades, the Southern Ocean has experienced 152 ± 47 Tmol·(10 a)–1reduction in DO, accounting for 16% of the global decline in DO (Schmidtko et al., 2017). The DO in the ocean comes from the exchange of air-sea interfaces and also from the photosynthesis of marine phytoplankton (Rintoul and da Silva, 2019). The Antarctic marginal seas, such as the Cosmonaut Sea and Amundsen Sea, are the primary regions of seasonal phytoplankton blooms in the Southern Ocean. The continuous release of iron from icebergs, sea ice, and sediments can support long-term phytoplankton blooms and generate oxygen (Tagliabue et al., 2009; Raiswell et al., 2016; Monien et al., 2017). Oceanic circulation also affects the distribution of DO. For example, the formation of Antarctic Bottom Water (AABW) involves the cooling and freezing of surface seawater and salt precipitation. This process transports water with high DO from the surface to the bottom of the Antarctic seas (Olbers et al., 2004), playing a crucial role in oxygen transport in the deep ocean globally (Jacobs et al., 1970; Lazier et al., 2002).
In the context of global warming and climate change, the melting of Antarctic glaciers is a significant concern (Shepherd et al., 2018). While there are significant differences between the East and West Antarctic, the loss rate of West Antarctic ice sheet has nearly tripled in the past 15 years, while the amount of East Antarctic ice sheet increases slightly (The IMBIE team, 2018). These changes may affect the distribution of DO and AOU. For example, in the Amundsen Sea (West Antarctic) with the fastest melting rate of the ice shelf due to the strong invasion of the warm Circumpolar Deep Water (CDW) (Shepherd et al., 2004; Walker et al., 2007; Arneborg et al., 2012), the DO monitored in the coastal region ranged from 400 to 700 μmol·L–1(Biddle et al., 2017), and higher in the surface layer of polynya (619.4 μmol·L–1) and lower in the sea ice zone and ice shelf zone (437.5 and 463.1 μmol·L–1, respectively), probably due to higher primary production (Xing et al., 2020) and lower temperature (Wang et al., 2022). While in the Cosmonaut Sea (East Antarctic) with much less ice shelf melting, AOU south of 60°S showed a downward trend between 1965 and 2008 due to a decrease in horizontal advection in the North Atlantic Deep Water (Iida et al., 2013). Basically, few studies focused on the DO and AOU and their long-term trends in the Cosmonaut Sea and Amundsen Sea, and more researches are required.
In this study, we presented the distribution characteristics of DO and AOU in the Cosmonaut Sea and Amundsen Sea in austral summer 2021, based on field data collected during the 37th Chinese National Antarctic Research Expedition (CHINARE-37). We focused on the impact of biological (e.g., surface primary production) and physical (e.g., water masses, fronts and currents) factors on the distribution of DO and AOU across the full water depth. This study would provide a data basis for understanding the long-term trend of DO in the Southern Ocean and its impact on the marine ecosystem.
2 Materials and methods
2.1 Characteristics of water masses, fronts and currents
The Cosmonaut Sea, situating in the western part of Enderby Land in the Indian sector, is adjacent to the Cooperation Sea to the east and the Lisser–Larsen Sea to the west. It has a longitude range of 30°E–60°E. The Amundsen Sea, locating on the edge of the Marie Byrd Land in the Pacific sector, is situated between the Ross Sea and the Bellinsgausen Sea, with a longitude range of 98°W–126°W (Figure 1). The distribution of DO and AOU is influenced by physical oceanographic factors such as currents, fronts and water masses. The Antarctic Slope Current (ASC), Antarctic Circumpolar Current (ACC), Southern Boundary (SB) of ACC, Weddell Gyre (WG), and CDW are the major physical factors that play a crucial role in this region (Figure 1). ASC is a strong nearshore current (maximum 30 cm·s–1) that flows westward and can cause an increase in nearshore chlorophyll(Chl) concentration (Meijers et al., 2010). The Front of ASC (ASF) can isolate warm subtropical water (e.g., CDW) from Antarctica (Martinson, 2012). The ACC carries DO from the west to the east, which promotes the elimination of oxygen differences in water masses between basins (Rintoul and da Silva, 2019). The SB extends southeast in the Cosmonaut Sea, and the presence of WG makes the seasonal mixing layer on the west side of the Cosmonaut Sea shallower and fresher than on the east side (Williams et al., 2010). The upwelling of CDW with consumed DO is one of the main water masses shallower than the 250 m layer (Orsi et al., 1995; Testa and Kemp, 2011). The DO concentration in ice meltwater can decrease by mixing with CDW (Jenkins, 1999).
2.2 Sampling and measurement of DO
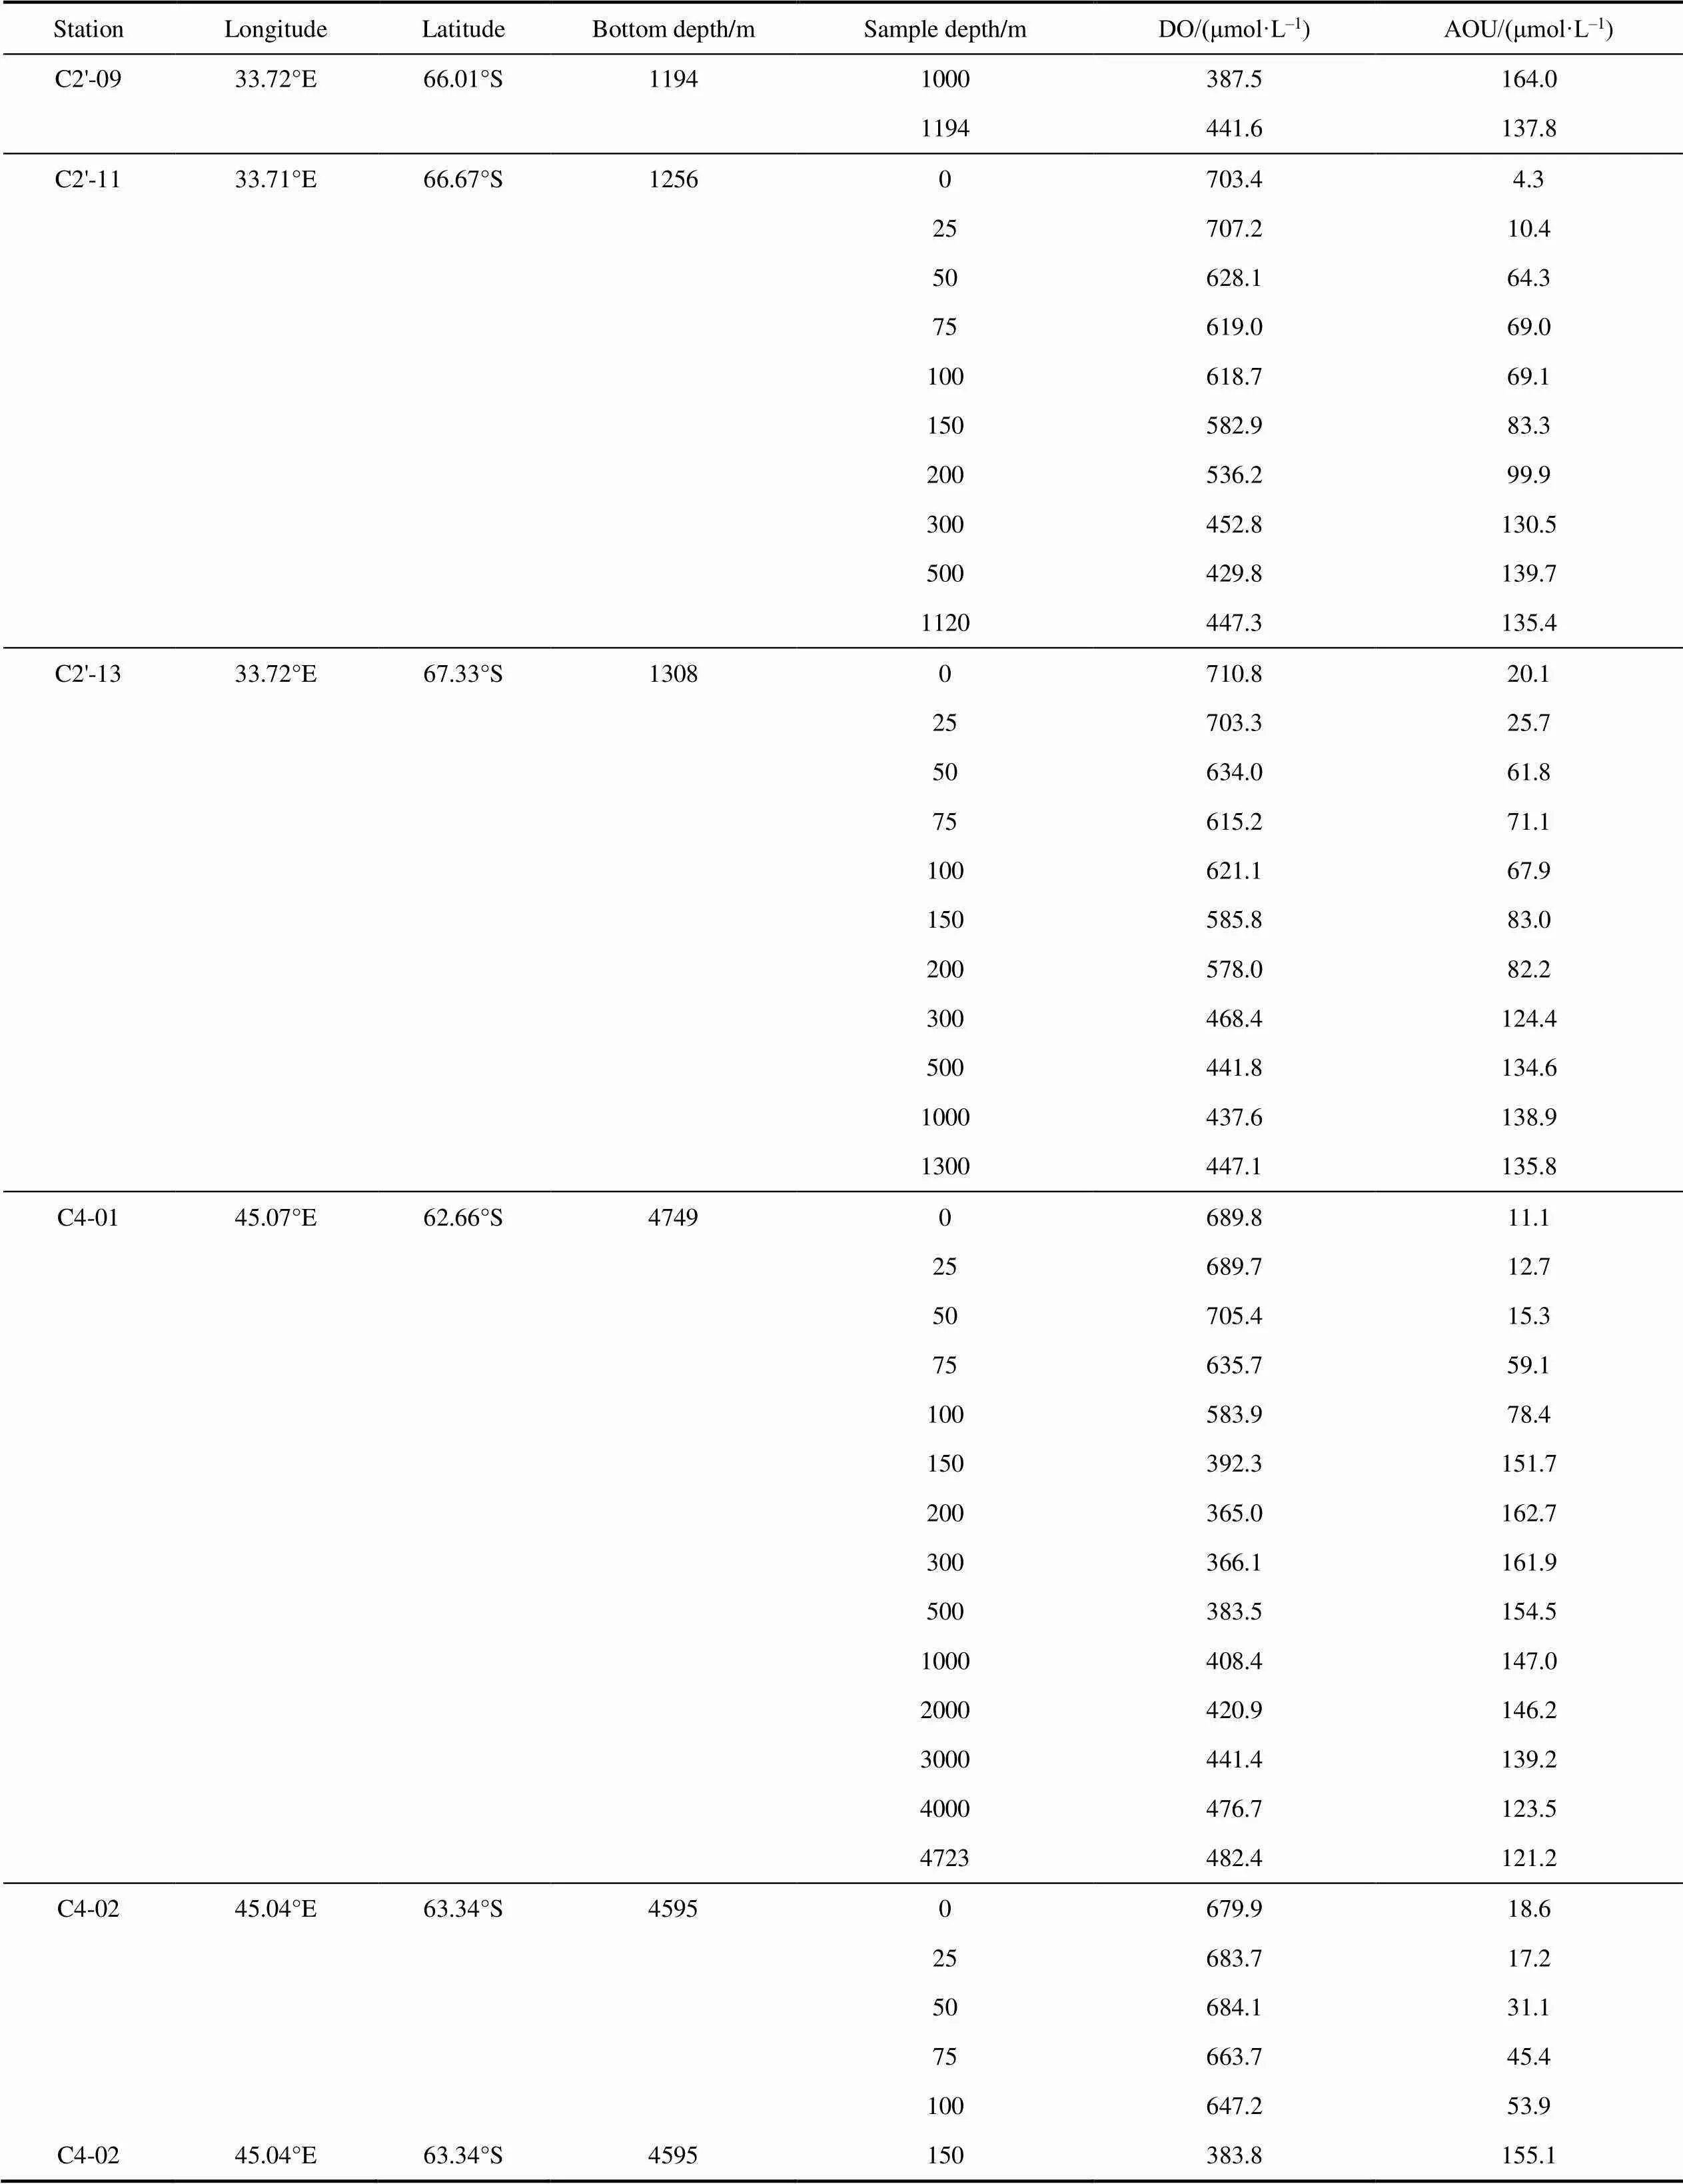
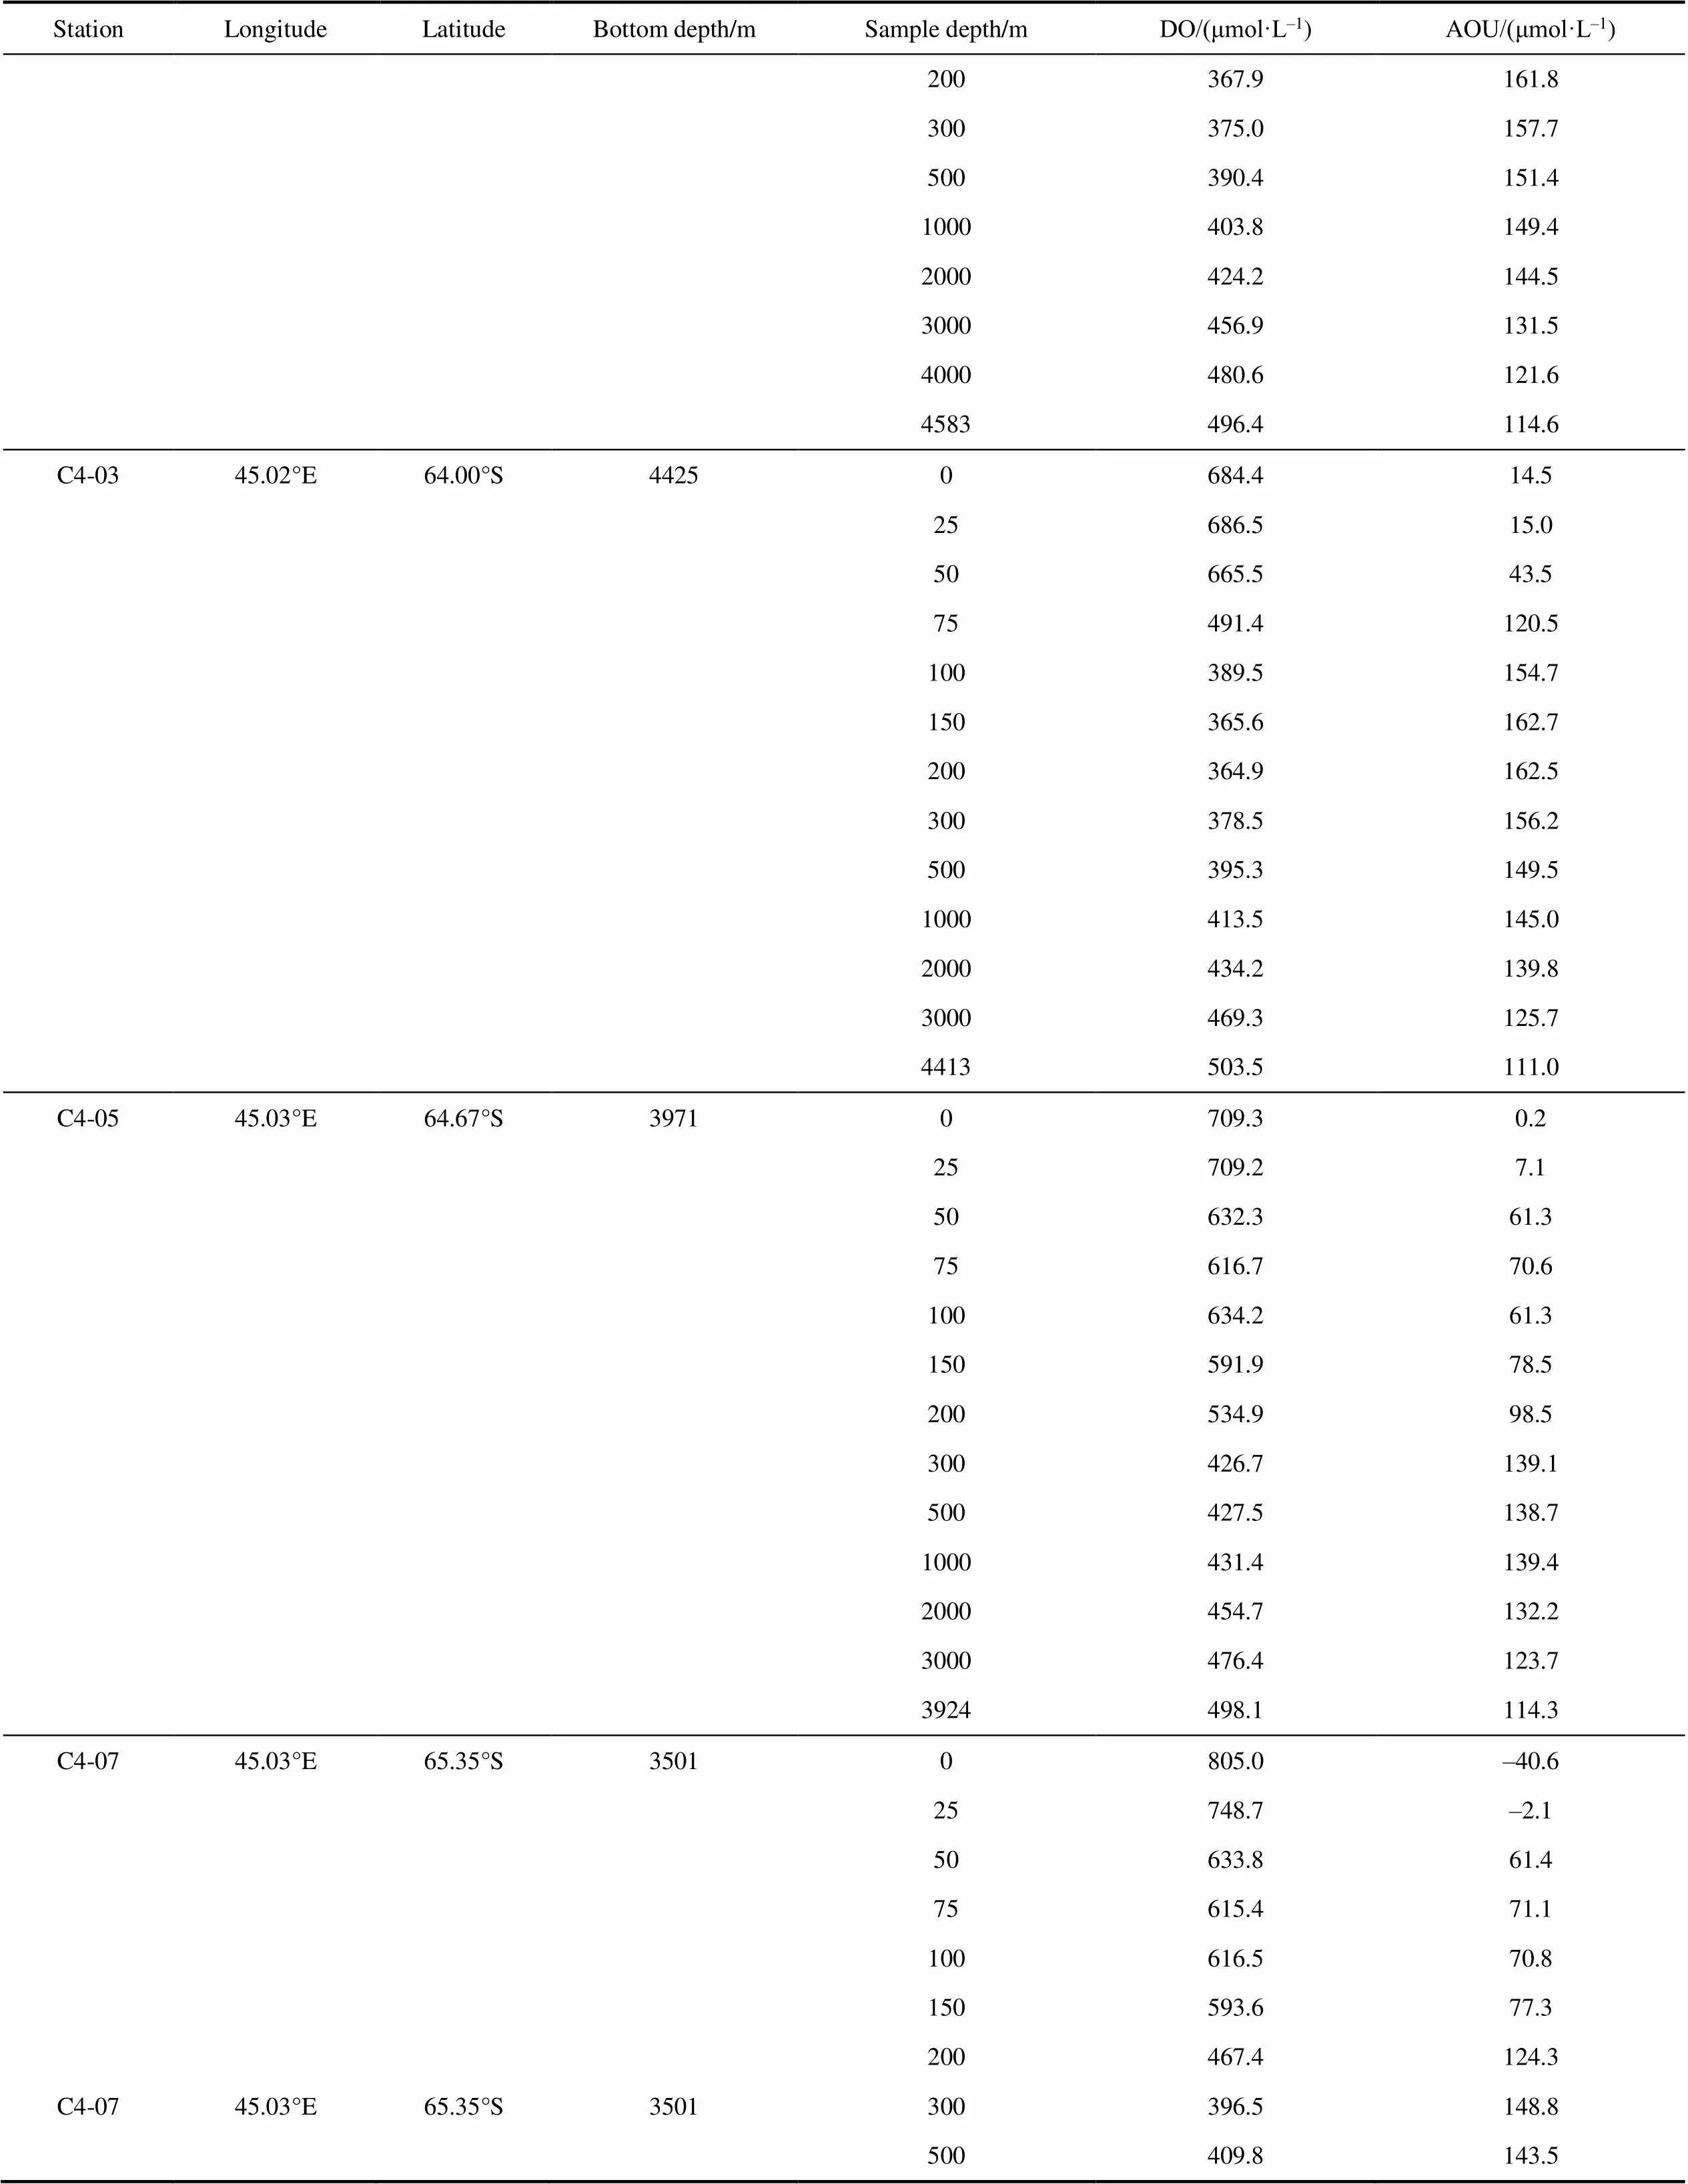
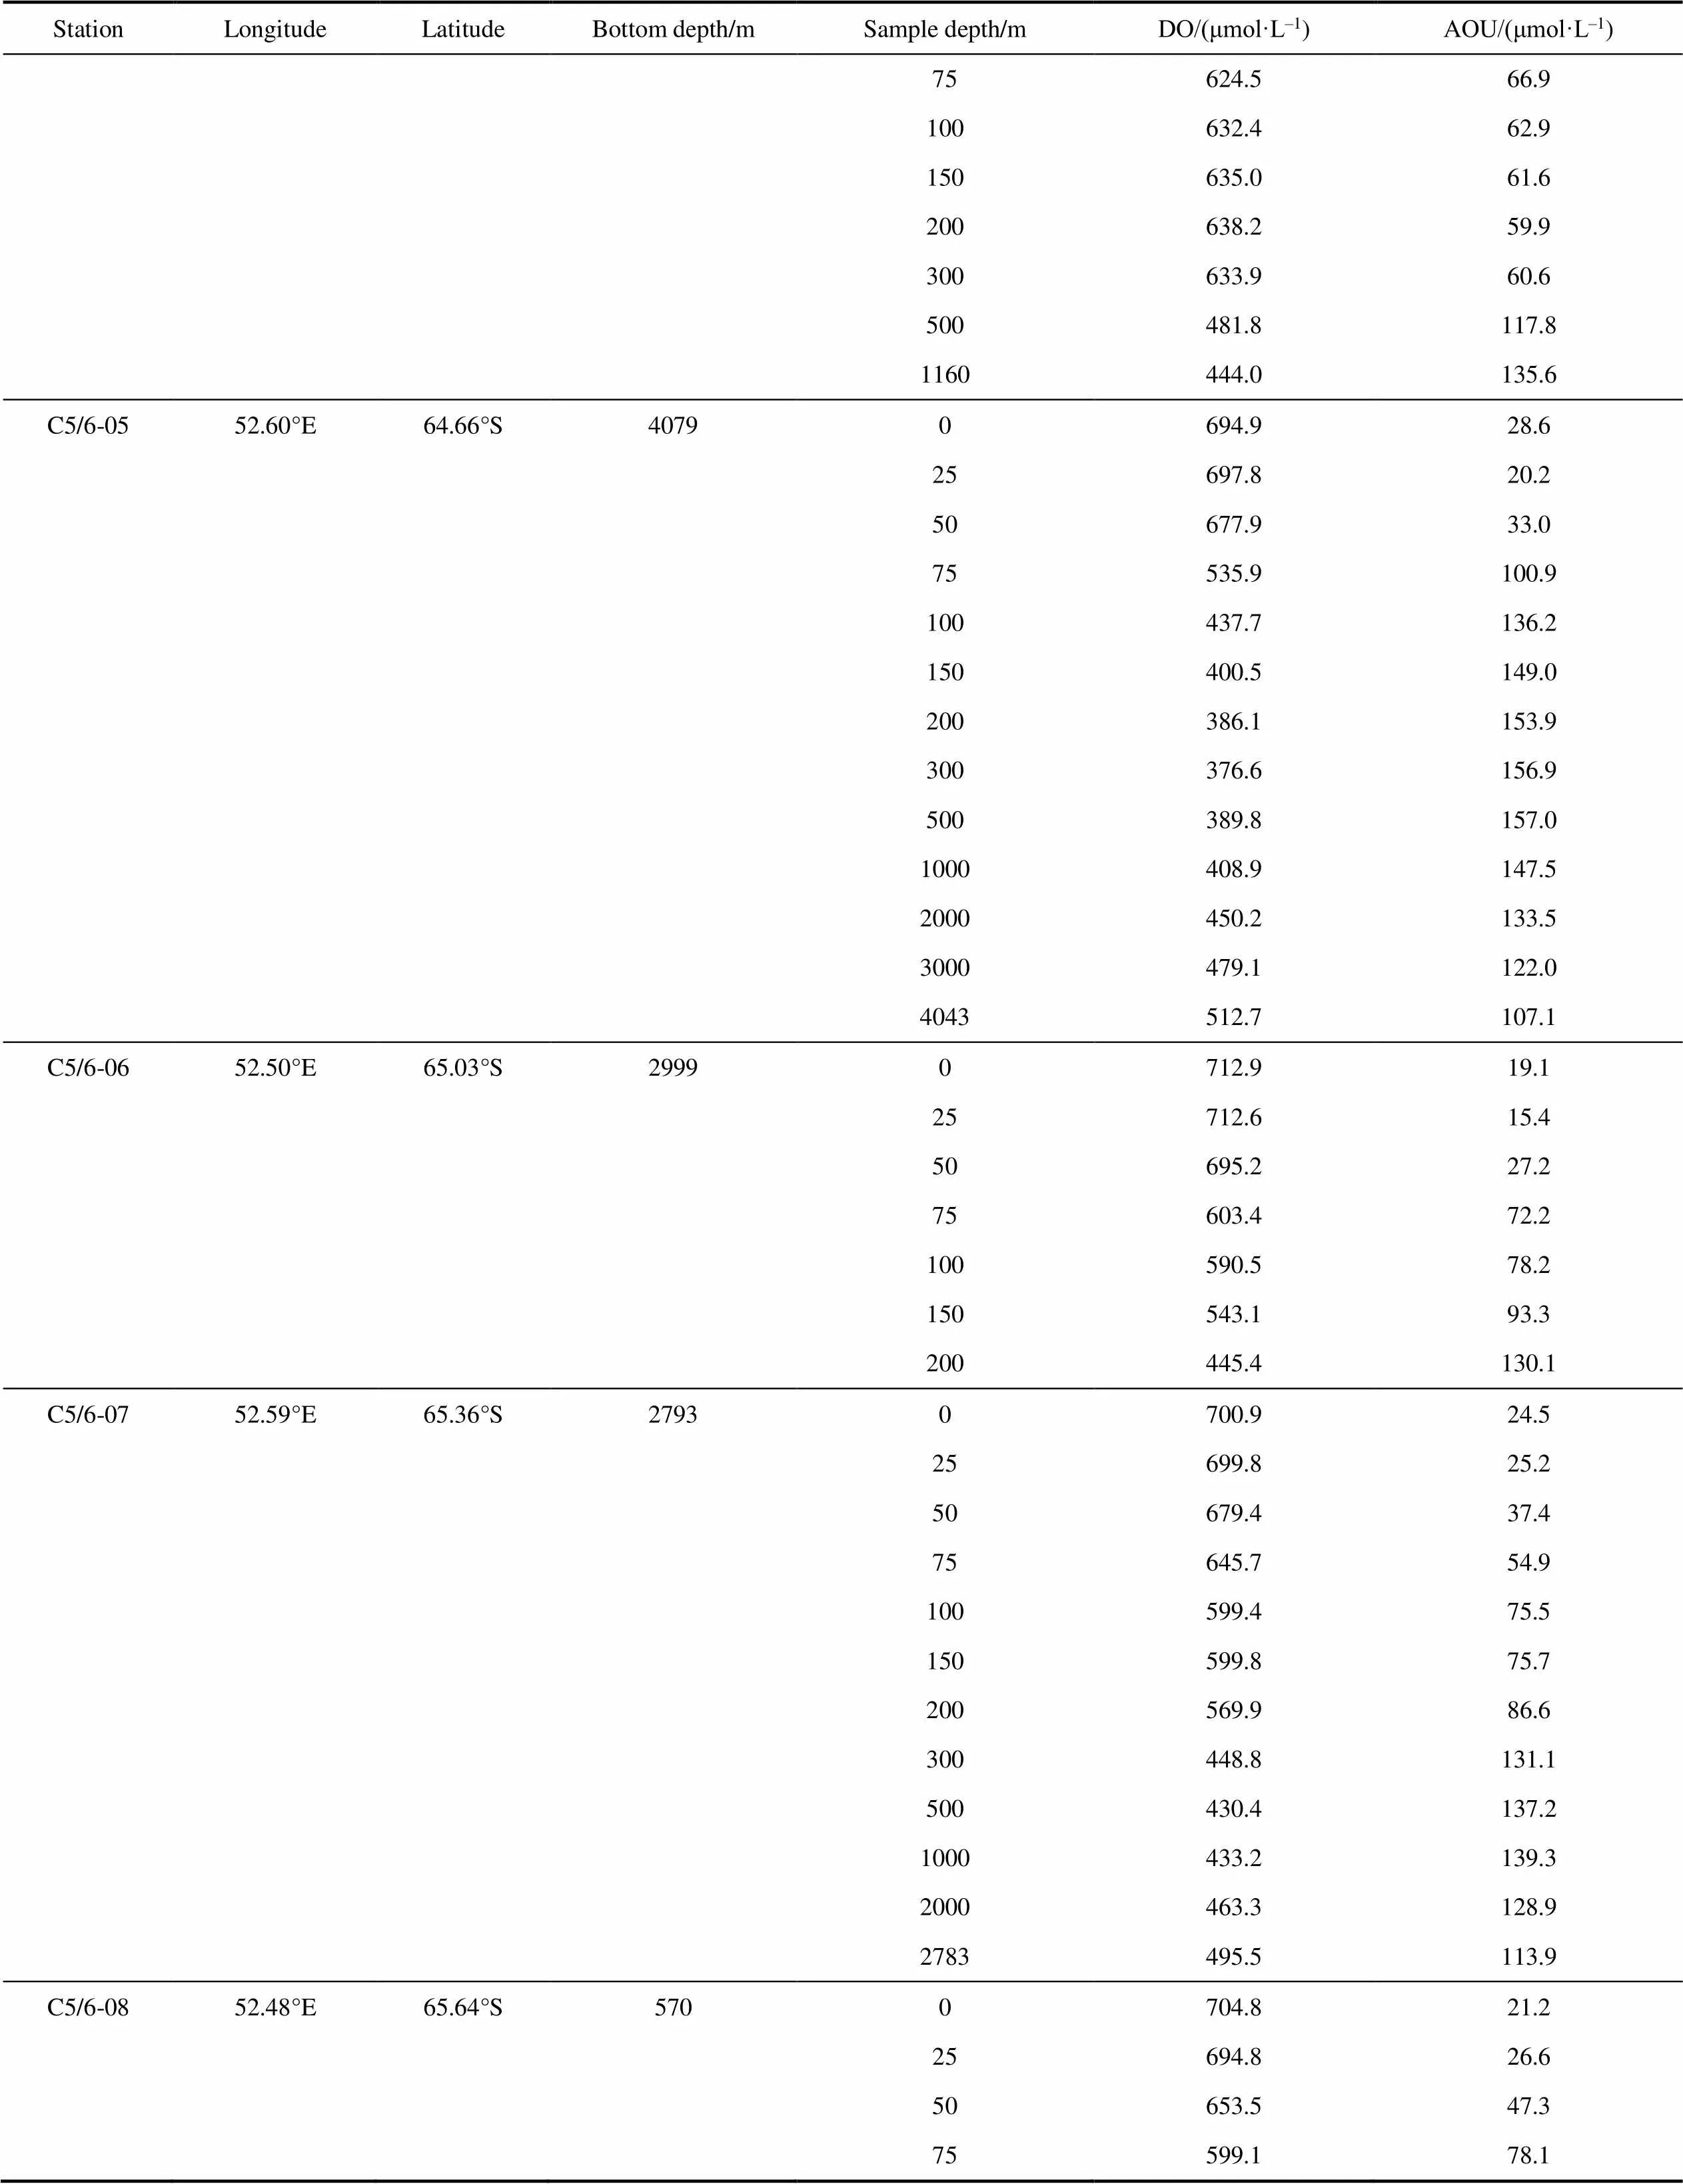
The DO in seawater was field determined using samples collected during the CHINARE-37. A total of 34 stations were established on 6 transects in the Cosmonaut Sea between 5 and 26 January, 2021. And 18 stations were set up on 5 transects in the Amundsen Sea from 14 to 29 March, 2021. A total of 36 parallel samples were collected at various depths from the standard layers such as the surface layer (ca. 2–3 m, shown as 5 m when displaying depth in logarithmic form), 25 m, 50 m, 75 m, 100 m, 150 m, 200 m, 300 m, 500 m, 1000 m, 2000 m, 3000 m, 4000 m, and the bottom layer (Table 1, Table S1 and Table S2).
Figure 1 The sampling stations for DO and Chlconcentrations in the Antarctic Cosmonaut Sea and Amundsen Sea during austral summer 2021. The main circulations in the Cosmonaut Sea include SB (purple dashed line) of ACC, WG (green solid line) and ASC (blue solid line) (Williams et al., 2010; Huang et al., 2022). The main circulations in the Amundsen Sea include ASC (blue solid line) and SB (purple dashed line) (Alderkamp et al., 2012; Nakayama et al., 2018).
After obtaining water samples using a CTD (conductivity-temperature-depth) rosette, they were transferred into brown bottles having a volume of approximately 120 mL (measured accurately to 0.1 mL in advance). The water samples were slowly injected into the bottle using a latex tube, and it overflowed 1/2 of the bottle volume without any bubbles inside the bottle. Subsequently, 1.0 mL of 2.4 mol·L–1MnCl2solution and 1.0 mL of 1.8 mol·L–1alkaline KI solution (in 5.4mol·L–1NaOH) were added to the bottle using a quantitative dispenser in sequence. The bottle caps were immediately stoppered after adding the reagents, and the bottles were slowly flipped up and down. In the process, the O2reacted with Mn2+and OH–to produce a brown precipitate of high-valence manganese (MnO(OH)2), which was used for subsequent analysis.
The measurements were completed within 24 h using the iodometric titration method as outlined in “Specifications for Oceanographic Survey – Part 4: Survey of Chemical Parameters in Sea Water” (GB/T 12763.4—2007) (General Administration of Quality Supervision, Inspection and Quarantine of the People’s Republic of China and Standardization Administration of China, 2007) with the calibrated Mettler Toledo T5 automatic potentiometric titration titrator. One mL of 1/3 (v/v) H2SO4was added to dissolve the precipitate and oxidize I–to I2when the precipitate settled to the brown glass bottle bottom. The I2and corresponding DO content was measured by sodium thiosulfate (Na2S2O3) titration. The Na2S2O3solution (ca. 1×10⁴μmol·L–1, calibrated with a KIO3standard solution) was added to the sample by the automatic potentiometric titrator until the end-point of titration. The DO concentration was calculated based on the consumed volume of Na2S2O3solution. The standard deviations should be <±2.8 and <±4.0 μmol·L–1for seawater standard samples with DO content <160 and >550 μmol·L–1, respectively. The DO measurement accuracy is 0.6μmol·L–1.
The formula for calculating the DO concentration (as O atom) is:
where,is the volume (mL) of the KIO3standard solution,1is the volume (mL) of the brown bottle,2is the total volume (mL) of MnCl2and KIO3-NaOH solutions,nis the volume (mL) of Na2S2O3solution consumed during titration,andis the volume correction coefficient of Na2S2O3solution.
2.3 Calculation of AOU
The formula for calculating AOU (as O2molecule) is:

where,andwere determined and recorded using a pre-calibrated Sea-Bird SBE-9/11 plus CTD system (SeaBird, USA).
2.4 Sampling and measurement of Chl a
Water samples for Chlanalysis were collected using a CTD rosette from the surface layer, 25 m, 50 m, 75 m, 100 m, 150 m and 200 m. Ca. 200 mL water samples were filtered, extracted in 90% acetone, and analyzed fluorometrically on a 10AU Turner Designs fluorometer as described in Welschmeyer (1994). Surface Chlwas used to analyze the relationship with AOU.
2.5 Statistical analysis
Pearson correlation analysis was used between AOU and Chl. The independent-test was used to compare the difference in average values of AOU and Chlin different sea regions. Two-tailed tests of significance were performed using SPSS 25 software (IBM, USA) to identify significant relationships between the measured parameters.
3 Results
3.1 Parallel sample analyses
The Cosmonaut Sea and Amundsen Sea were investigated with regard to their DO and AOU. Results showed that DO ranged from 346.9 to 805.0 μmol·L–1and 353.5 to 728.0 μmol·L–1for Cosmonaut Sea and Amundsen Sea,respectivelly, while AOU ranged from –40.6 to 169.3 μmol·L–1and 8.2 to 165.9 μmol·L–1, respectively (Table S1 and Table S2). The study areas were found to be generally oxygen-rich. Moreover, the standard deviation of DO parallel samples ranged from <0.1 to 3.7 μmol·L–1(Table 1), indicating good parallelism and experimental accuracy, which met the requirements of survey specification (GB/T 12763.4—2007).

Table 1 Measured, average concentration, and standard deviation of DO in the samples from the 36 parallel sample stations

Continued
3.2 Spatial distribution of DO and AOU in the Cosmonaut Sea
The horizontal distribution of DO and AOU in the Cosmonaut Sea was shown in Figure 2 (and Figures S1 and S2). The surface layer, 200 m layer and bottom layer exhibited DO ranges of 679.8–805.0 μmol·L–1(715.7± 31.3 μmol·L–1on average), 349.6–638.2 μmol·L–1(462.6± 100.6 μmol·L–1on average), and 434.4–537.3 μmol·L–1(485.5±26.4 μmol·L–1on average), respectively. The corresponding AOU in these layers ranged from –40.6 to 28.6 μmol·L–1(7.0±18.3 μmol·L–1on average), 59.8 to 168.5 μmol·L–1(126.1±37.4 μmol·L–1on average), and 94.9 to 140.5 μmol·L–1(118.9±11.8 μmol·L–1on average). In the southwest Cosmonaut Sea (transect C2', stations C4-07 to C4-12), the surface Chl(1.87±0.84 mg·m–3) was significantly higher (< 0.05) than the northeast (0.50± 0.43 mg·m–3) (Figure S3), and AOU was significantly lower (< 0.05) in the southwest Cosmonaut Sea (–14.6± 18.6 μmol·L–1) than the northeast (16.0±7.4 μmol·L–1). In the 200 m layer, AOU was also significantly lower (< 0.05) in the south (99.3±27.4 μmol·L–1) than the north (160.1±11.0 μmol·L–1) (Stations C4-01 to C4-03, C5-01 to C5-03, C5/6-05, and transects C6 and C7). In the bottom layer, there was no spacial difference on AOU horizontal distribution.
The vertical distribution of DO and AOU in the transects C2', C4, C5 and C7 of the Cosmonaut Sea was shown in Figure 3. The DO in the photic zone showed a fast decrease with increasing depth in all transects and reached its lowest point at a depth of 200–500 m before slowly increasing to the bottom. The DO spacial distribution of transects C4 and C7 in our study was quite similar to Legs 3 and 7 in Meijers et al. (2010). For example, the water masses with DO values lower than 400 μmol·L–1can upwell to 150 m, the water masses with DO values higher than 490 μmol·L–1are popularly present at the bottom layer. These results indicate the insignificant change in DO pattern of the Cosmonaut Sea in January during the past 15 years. AOU demonstrated an opposite trend to DO. Basically, AOU was lower than 30 μmol·L–1in the upper 25 m. In the 50–300 m, AOU increased slower with water depth in the higher latitude coastal region, but sharper in the lower latitude open ocean region. For instance, AOU was ca. 60 μmol·L–1in 300 m layer of coastal stations C4-12 and C5-07; while was over 160 μmol·L–1in open ocean stations C4-01 and C5-01. Then, AOU reached lower than 130 μmol·L–1in the bottom layer over 3000 m.
3.3 Spatial distribution of DO and AOU in the Amundsen Sea
The horizontal distribution of DO and AOU in the Amundsen Sea was shown in Figure 4 (and Figures S4 and S5). The surface layer, 200 m layer and bottom layer exhibited DO ranges of 667.9–722.0 μmol·L–1(701.0±14.5 μmol·L–1on average), 353.5–552.6 μmol·L–1(400.4±46.0 μmol·L–1on average), and 377.7–44.6 μmol·L–1(424.4±20.7 μmol·L–1on average), respectively. The corresponding AOU distributions ranged from 15.8 to 29.5 μmol·L–1(22.3±4.4 μmol·L–1on average), 75.4 to 165.9 μmol·L–1(146.2±21.8 μmol·L–1on average), and 133.9 to 159.7 μmol·L–1(141.7±7.4 μmol·L–1on average), respectively. In the surface and bottom layers, there was no spacial difference on AOU horizontal distribution, while in the 200 m layer, AOU was higher (< 0.01) in south (150.3±13.1 μmol·L–1) than that in north (75.3 μmol·L–1) (i.e., station A3-12). The surface AOU in the Amundsen Sea was significantly higher (< 0.05) than the northeast and southwest Cosmonaut Sea. In the 200 m layer, AOU in the Amundsen Sea was comparable (> 0.05) to the north Cosmonaut Sea, but significantly higher (< 0.05) than the south Cosmonaut Sea. The bottom AOU in the Amundsen Sea was significantly higher (< 0.01) than the Cosmonaut Sea.
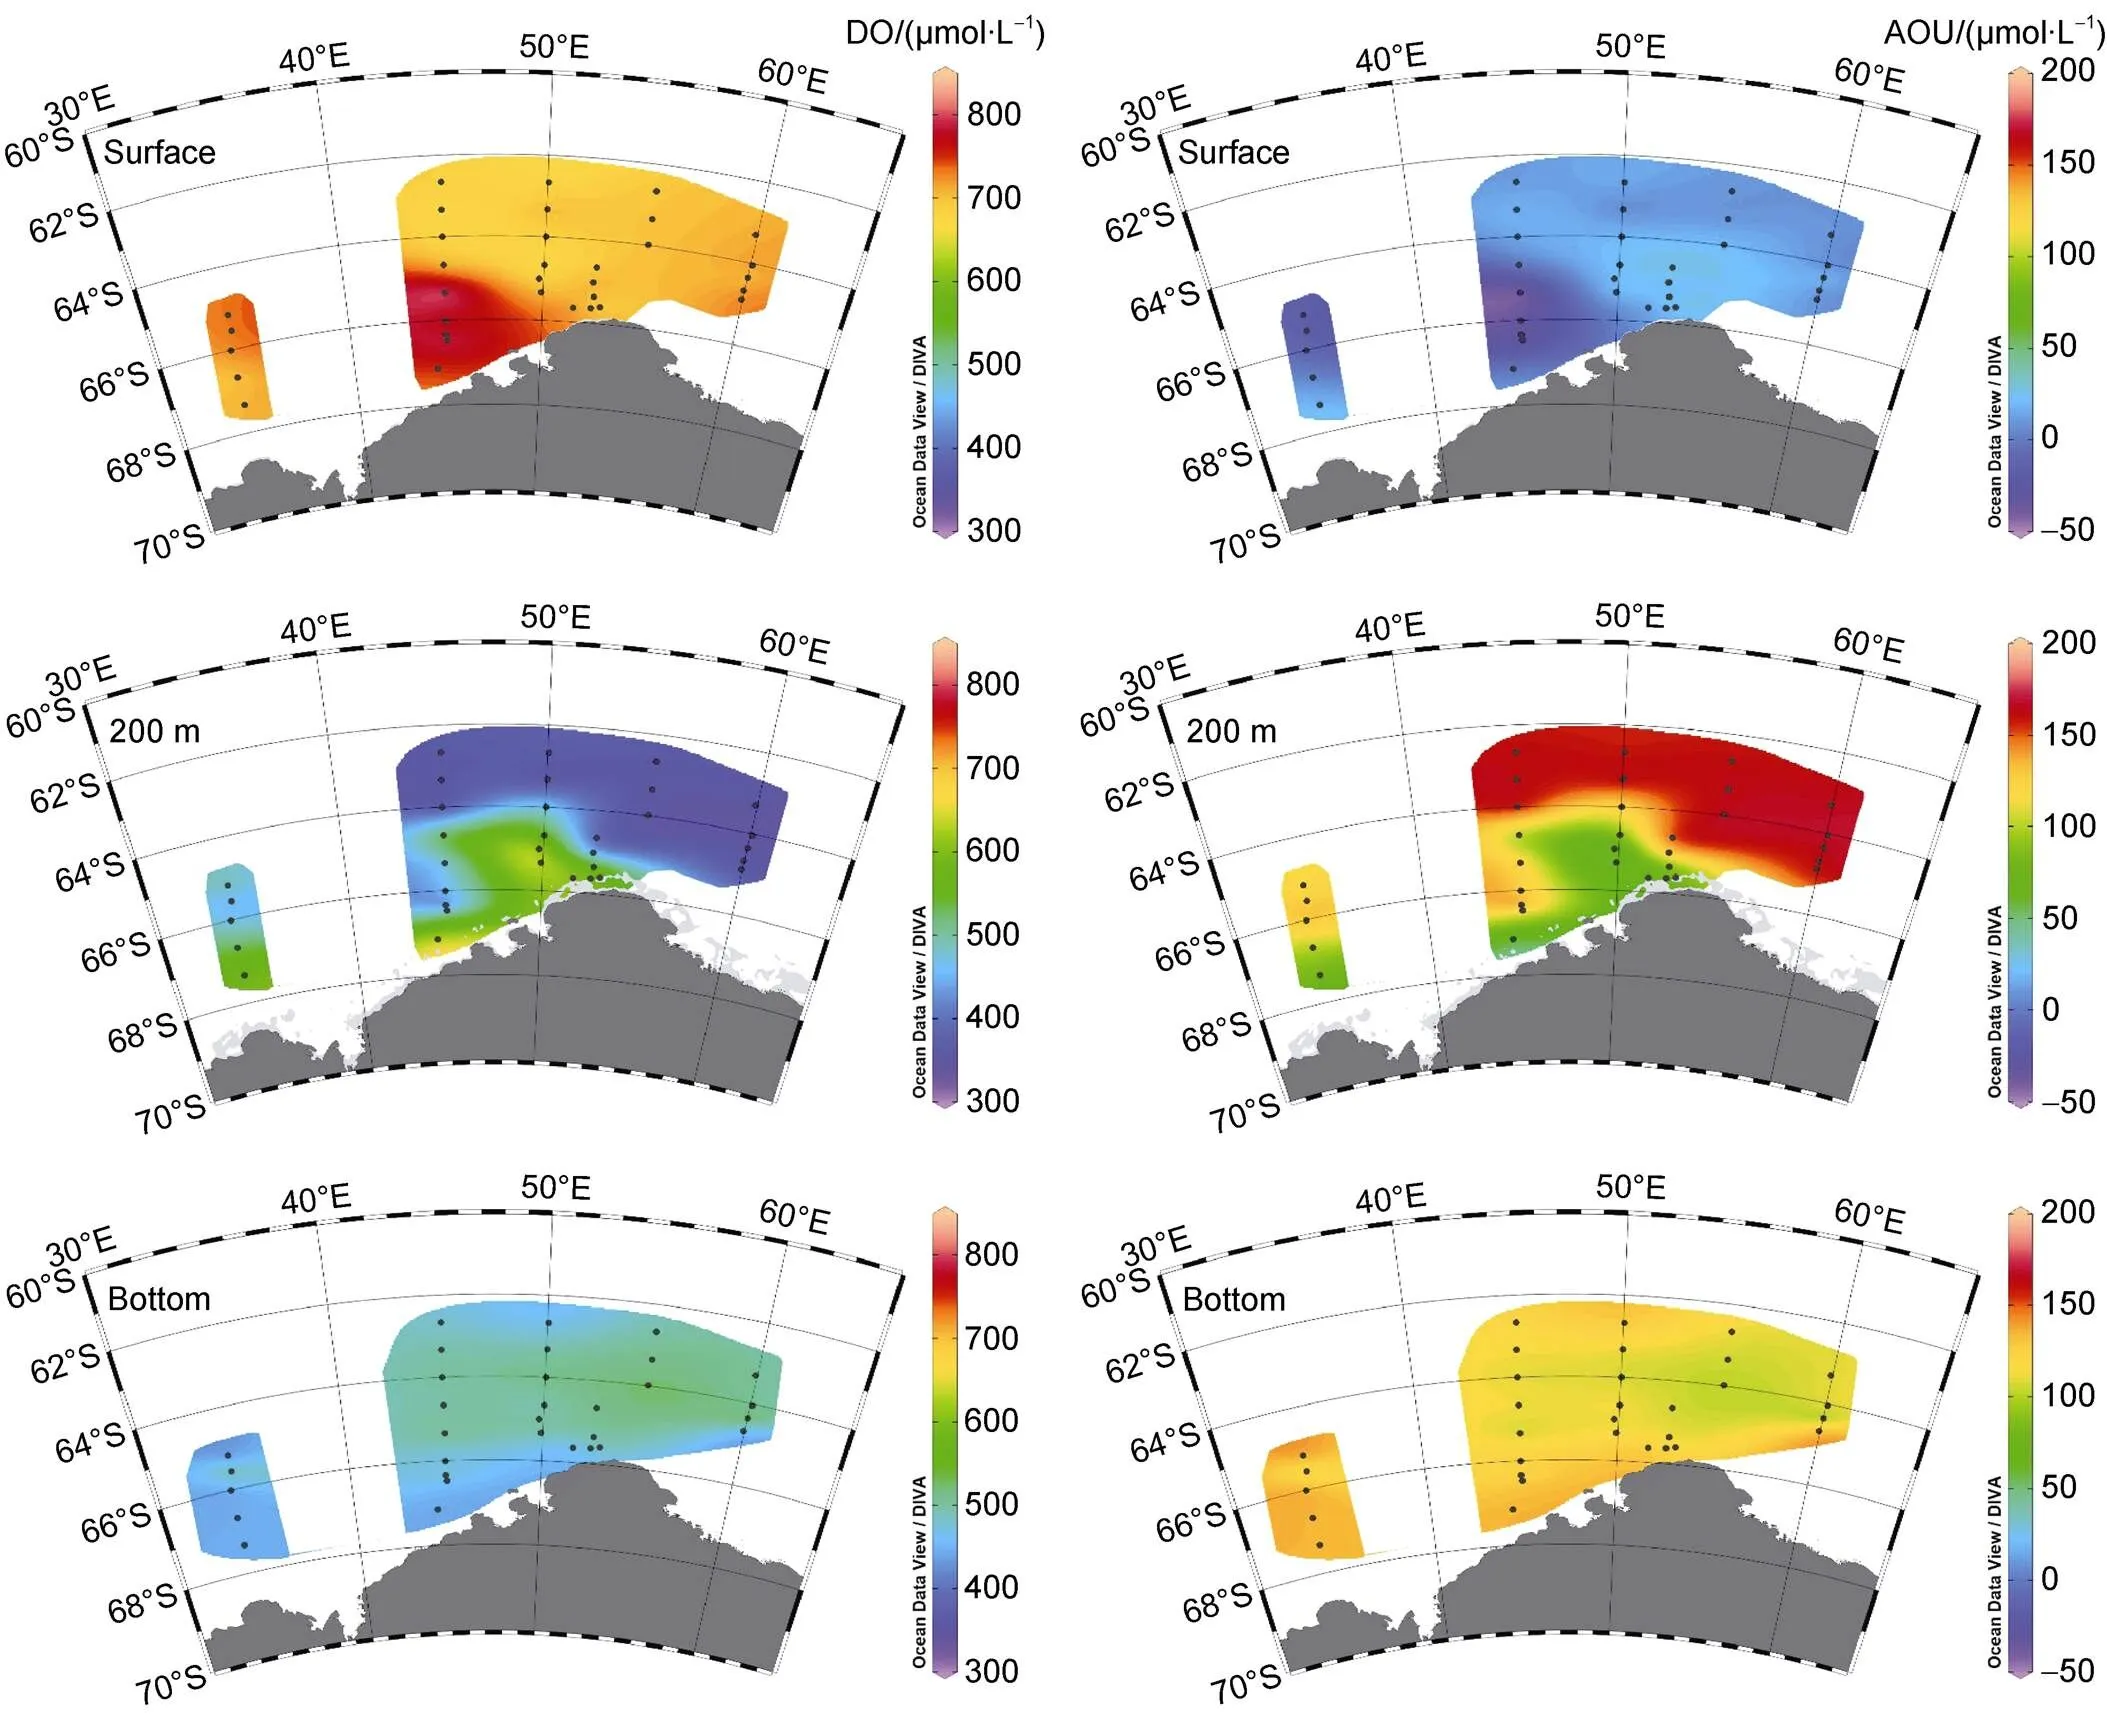
Figure 2 Horizontal distributions of DO andAOU in the surface layer, 200 m layer and bottom layer of the Cosmonaut Sea.
The vertical distribution of DO and AOU in transects A3 and A10 of the Amundsen Sea was shown in Figure 5.The DO in the photic zone decreased significantly with increasing depth, with the lowest DO observed between 200 and 1000 m. Then DO increased slightly with further depth. There was a relatively consistent trend of DO and AOU from nearshore to open ocean, without significant latitudinal differences. AOU increased from lower than 30 μmol·L–1in the upper 25 m to over 160 μmol·L–1in the 200–500 m, and then decreased slowly to higher than 130 μmol·L–1in the bottom layer over 3000 m. Comparing with the Cosmonaut Sea, we found that low (< 50 μmol·L–1) AOU waters can reach 150 m water depth in the north stations of transects A3 and A4 in the Amundsen Sea, and high (> 160 μmol·L–1) AOU waters can invade to the continental shelf of transect A10. Previous study showed that the CDW can reach ice shelves adjacent to the Amundsen Sea Polynya (Xing et al., 2020). In the upper (0–200 m) open ocean north of Amundsen Sea, there was no significant difference between our results and Wang et al. (2022), indicating the stable status of DO in March.
Figure 3 Vertical distributions of DO and AOU along transects C2', C4, C5 and C7 in the Cosmonaut Sea. Note: depth was displayed in logarithmic form.
4 Discussion
4.1 The effect of primary production on surface AOU distribution
There were significant regional differences in surface AOU between the two seas. As mentioned above, AOU of the southwest Cosmonaut Sea was significantly lower than the northeast Cosmonaut Sea and Amundsen Sea. There was a significant negative correlation between surface AOU and Chlin the the study area (< 0.01,= –0.64,= 51, Figure 6). This indicates that austral summer phytoplankton bloom in coastal region release a large amount of oxygen, leading to the supersaturation of DO (i.e., AOU < 0). The domination of Chlon AOU in surface water may be common. A previous study showed that the AOU in Prydz Bay was lower in the high Chlarea (Han, 2018). In addition, in the Pearl River Estuary, algae growth increased the DO content in the water column, and Chlwas positively correlated with DO (Liu et al., 2002). In Lake Qiandaohu, the concentration of Chlwas positively correlated with DO and related to phytoplankton production (Yin et al., 2014).
The difference in average AOU between the northwest Cosmonaut Sea and the Amundsen Sea was much smaller by comparing with the southwest Cosmonaut Sea, indicating the regional and seasonal homogeneity of AOU in the open Southern Ocean. Even the average was comparable, the difference was significant (< 0.01), which need further study to explore the controlling factors. It should be noted that Chlin the 25 m layer (2.30± 1.80 mg·m–3) of the southwest Cosmonaut Sea was slightly higher than the surface (1.37±0.94 mg·m–3), while AOU did show the same pattern in the 25 m layer (Figures S2 and S3). This could be due to the increasing microbial consumption on DO and/or insufficient supplement of DO though sea–air exchange. With water depth increasing to 200 m, Chldecreased dramatically to < 0.3 mg·m–3, while AOU varied from < 30 μmol·L–1to > 160 μmol·L–1, indicating that AOU is controlled by other factors rather than Chl.
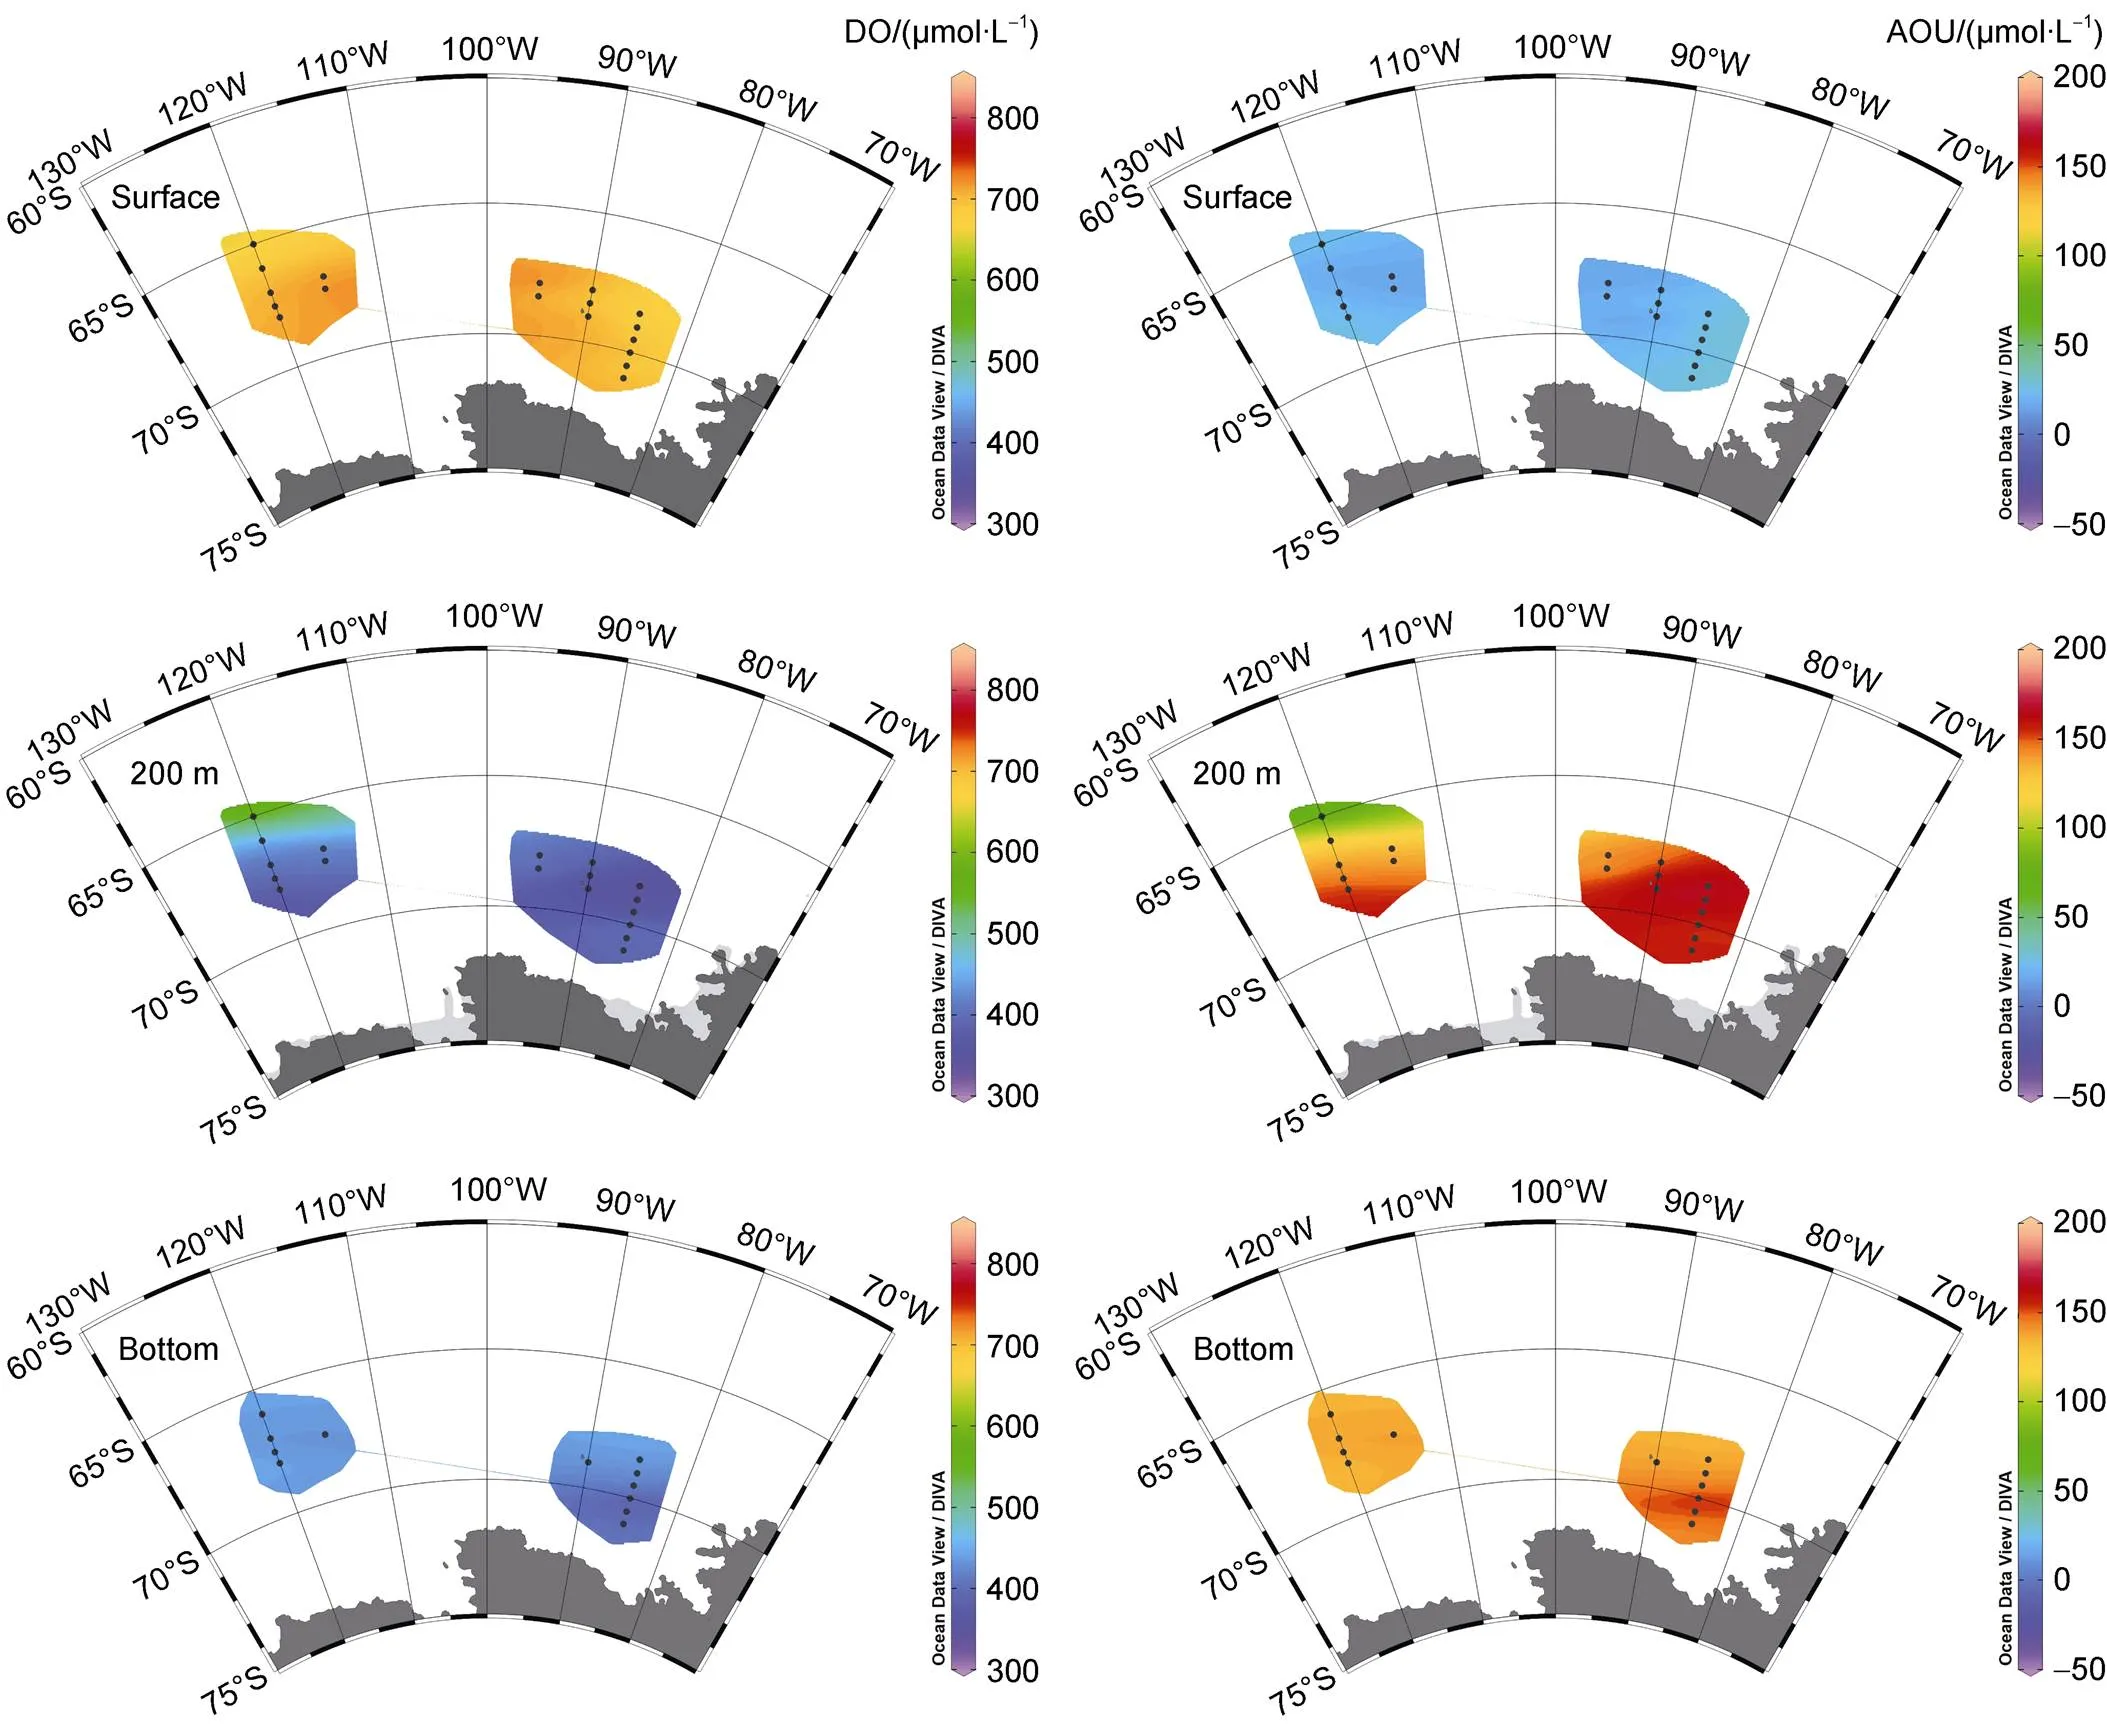
Figure 4 Horizontal distributions of DO andAOU in the surface layer, 200 m layer and bottom layer of the Amundsen Sea.
4.2 The influence of water masses on AOU distribution
Water masses can influence the distribution of AOU in the Cosmonaut Sea and Amundsen Sea. Based on the potential temperature data obtained during this cruise and referring to Meijers et al. (2010) and Williams et al. (2010), we identified the water masses of the two seas during the survey period: Antarctic Surface Water (AASW), CDW, modified CDW (mCDW), Warm Deep Water (WDW), and AABW. And the fronts: SB, ASF and southern Antarctic Circumpolar Current front (sACCf) (see Figure S6 for the detailed information of water masses and fronts). Correspondingly, we combined AOU data with these water masses and fronts, and discovered some seasonal or regional similarities and/or differences between the studied seas.
In surface water (0–25 m), AOU < 0 was common in the Cosmonaut Sea, while in the Amundsen Sea, AOU was generally > 10 μmol·L–1(Figure 7). This is closely related to the presence of the summer mixed layer (SML) with higher temperatures in AASW. For example, there was a significant SML in the transects C2' and C4 of the Cosmonaut Sea in austral summer, while there was no SML in the Amundsen Sea in early winter. On the one hand, higher water temperatures are beneficial for the growth of phytoplankton and more DO releasing (as discussed in section 4.1). This result was similar to the spatial distribution of nitrogen and phosphorus on the surface of the Cosmonaut Sea (Huang et al., 2022). On the other hand, SML can increase sea–air exchange and increase DO supply. Both factors can reduce AOU. In subsurface water (75– 150 m), AOU value was lower in the north Amundsen Sea in early winter (such as < 50 μmol·L–1in transect A3) than the south Amundsen Sea and the entire Cosmonaut Sea, possibly due to the deeper winter mixing layer (as can be seen from potential temperature data) in the open ocean during winter, and the un-upwelling of CDW.
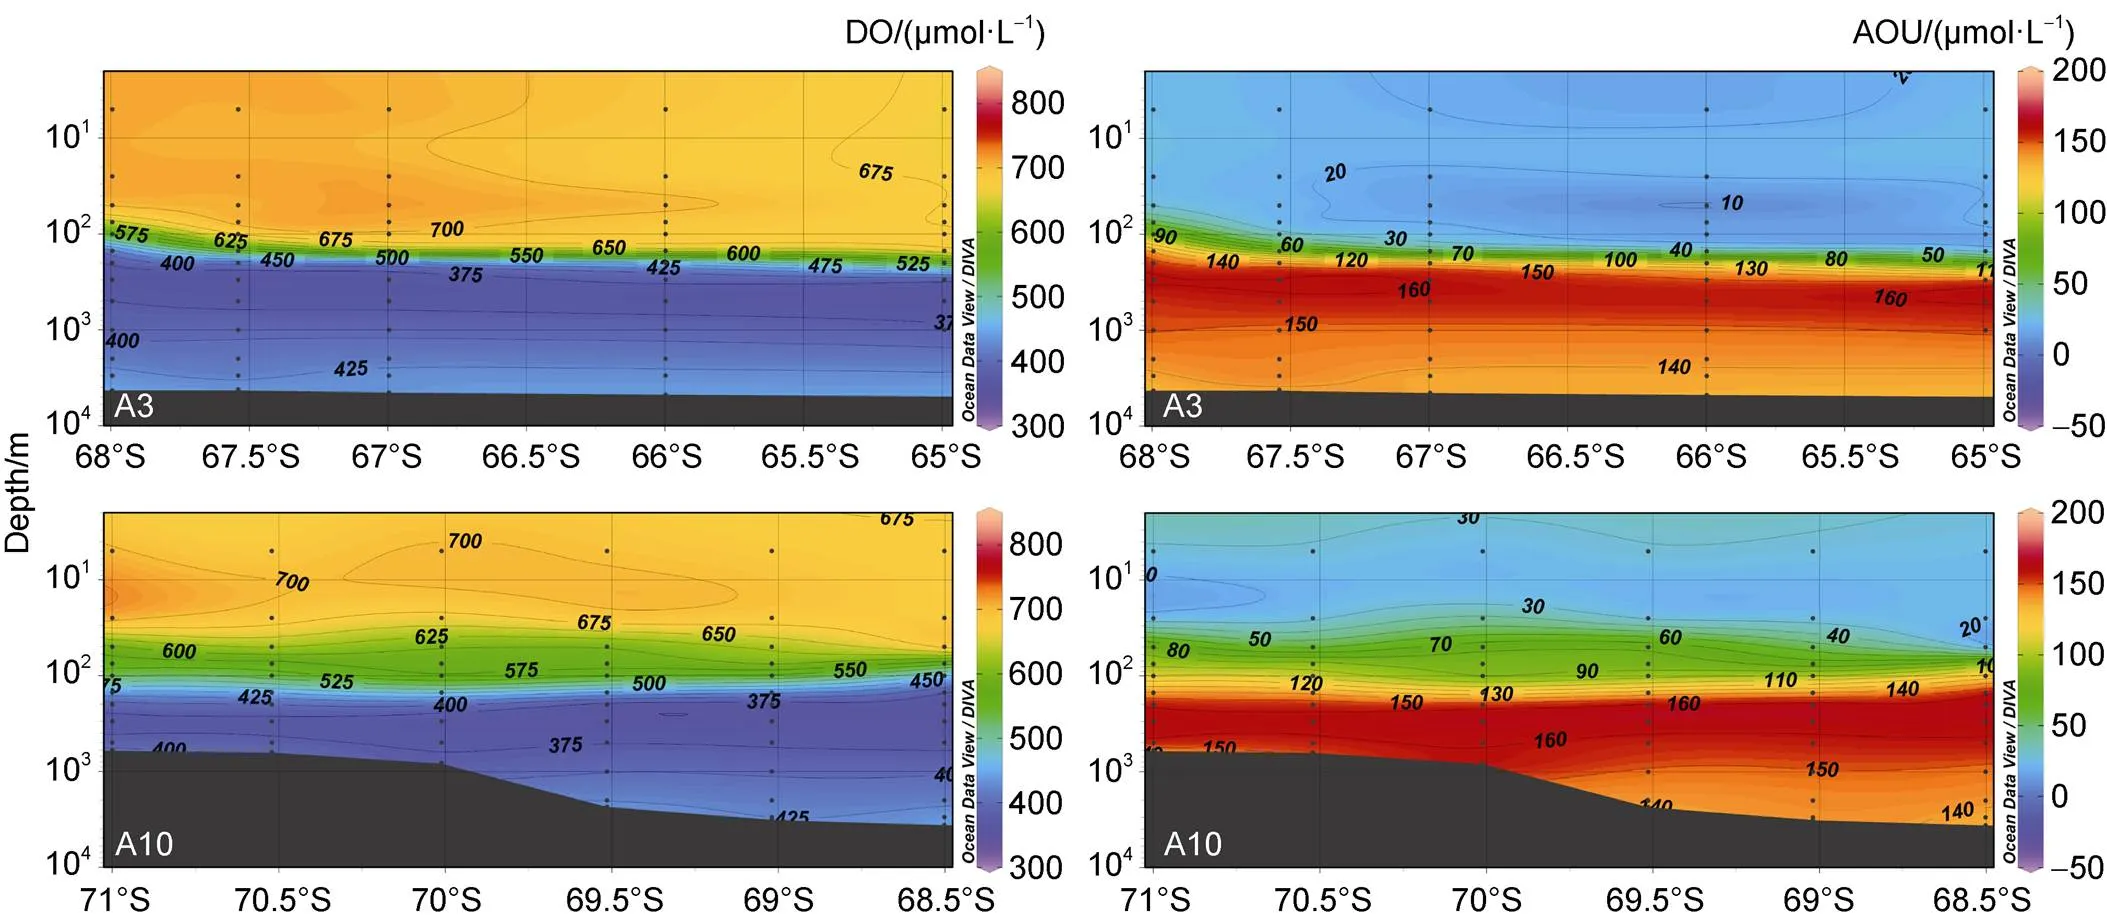
Figure 5 Vertical distributions of DO and AOU along transects A3 and A10 in the Amundsen Sea. Note: depth was displayed in logarithmic form.
Figure 6 Correlation analysis between Chland AOU in surface layer of the Cosmonaut Sea and Amundsen Sea. Note: Southwest Cosmonaut Sea includes 10 stations of transect C2' and stations C4-07 to C4-12.
In water depths of 150–500 m, there were significant latitude and seasonal differences in properties of water masses, and AOU also exhibited different characteristics. In the higher latitude nearshore Cosmonaut Sea in austral summer, the winter residual water layer (with a potential temperature as low as < –1.6 ℃) in AASW was thicker (as shown in transects C4 and C5), and the ASF could reach down to ca. 500 m (Figure S6). This may be the area where high-density shelf water sinking to the continental slope and leading to the formation of AABW. Accordingly, the AOU value here was as low as < 130 μmol·L–1(Figure 7). While in the lower latitude pelagic Cosmonaut Sea in austral summer, CDW (with potential temperature > 1.5 ℃) could flow southward to about 64°S and a depth of 150 m (such as transects C4 and C5) (Figure S6), and the AOU here could reach as high as > 160 μmol·L–1(Figure 7). The continuous upwelling of CDW regardless of season may be one important reason of the formation of polynya in winter (Comiso and Gorden, 1996; Wei et al., 2022). mCDW (potential temperature < 1.5 ℃) can continue to invade higher latitude regions (Figure S6), and correspondingly, AOU also showed a decreasing trend (such as transects C4 and C5) (Figure 7). In transects C2' and C4 of the west Cosmonaut Sea, the presence of WDW controlled by WG was indicated by potential temperatures > 0.6 ℃ (Figure S6), where AOU was relative high (> 140 μmol·L–1) (Figure 7). In transect C7 of the east Cosmonaut Sea, the presence of sACCf could be identified by potential temperatures > 1.8 ℃ (Figure S6), but there was no significant difference in the AOU between the north and south of sACCf.
In the depth of 150–500 m of the higher latitude nearshore Amundsen Sea (such as transect A10) in early winter, there was a relatively thin AASW, and ASF was shallower than 200 m (Figure S6). The AOU here was approximately 130 μmol·L–1(Figure 7). But the CDW (potential temperature > 1.5 ℃) could flow southward to about 70°S and a depth of 200 m (Figure S6), and its AOU could reach up to > 160 μmol·L–1(Figure 7). The AOU of mCDW (potential temperature < 1.5 ℃) invading the entire wide continental shelf was also as high as >160 μmol·L–1(Figures 7 and S6), which was not significantly different from CDW. This characteristic is different from the Cosmonaut Sea, where AOU of mCDW was lower than that of the CDW, and further research is needed to reveal this difference. Correspondingly, the lower latitude pelagic Amundsen Sea (such as transect A3) in winter was occupied by warm water and showed a trend of CDW upwelling at about 68°S (Figure S6). Its AOU was relatively high (> 150 μmol·L–1), and had the same distribution trend as the potential temperature (Figure S6).
In the bottom layer with water depth over 3000 m, AABW (potential temperature < 0 ℃) is present in the Cosmonaut Sea (Figure S6), and its AOU can be as low as < 130 μmol·L–1(Figure 7). This result is consistent with Meijers et al. (2010), where the bottom DO concentration on the nearshore side was > 510 μmol·L–1. The similar conditions have been found in the Ross Sea, which is one of the places where AABW is generated, and water masses with high DO would sink along the continental slope (Budillon et al., 2011). However, AABW is basically absent in the Amundsen Sea (bottom layer potential temperature > 0 ℃) (Ohshima et al., 2013; Lee et al., 2017; Solodoch et al., 2022) (Figure S6), with AOU > 130 μmol·L–1(Figure 7).
In summary, AOU at different water depths is controlled by water masses, and combining with physical oceanographic parameters such as potential temperature, AOU can indicate the characteristics of and changes in water masses.

Figure 7 Profile view of AOU of the Cosmonaut Sea (a) and Amundsen Sea (b).
5 Summary
Our research examined the spatial distribution of DO and AOU in the Cosmonaut Sea and Amundsen Sea during the CHINARE-37 in austral summer 2021. The sample analyses gave good quality data, and the standard deviation for DO concentrations found in duplicate samples (= 2) were better than required. In the surface layer of the Cosmonaut Sea and Amundsen Sea, AOU exhibited a significant negative correlation with Chl, suggesting that the phytoplankton bloom promotes an increase in DO. In the 200 m layer, the highest AOU was observed in both seas due to the intrusion of CDW, except for the coastal region of Cosmonaut Sea where CDW was hindered by the presence of the thicker AASW and narrow continental shelf. In the bottom layer, the AOU was significantly lower (< 0.01) in the Cosmonaut Sea than the Amundsen Sea, indicating the presence of oxygen-rich AABW in the Cosmonaut Sea. Our study shows that AOU has the potential to be an indicator of the characteristics of water masses.
The authors wish to thank the CHINARE-37 team members and the crew of R/Vfor helping collect water samples and temperature and salinity data. The study was financially supported by the National Polar Special Program “Impact and Response of Antarctic Seas to Climate Change” (Grant nos. IRASCC 01-01-02A, IRASCC 02-02), the National Key Research and Development Program of China (Grant no. 2022YFE0136500) and the National Natural Science Foundation of China (Grant no. 41976228). We also thank reviewer Dr. Yongming Sun, two anonymous reviewers and Associate Editor Dr. Jiuxin Shi for constructive comments that helped us improve the manuscript.
Alderkamp A-C, Mills M M, van Dijken G L, et al. 2012. Iron from melting glaciers fuels phytoplankton blooms in the Amundsen Sea (Southern Ocean): phytoplankton characteristics and productivity. Deep Sea Res Part II Top Stud Oceanogr, 71-76: 32-48, doi:10.1016/j.dsr2.2012.03.005.
Arneborg L, Wåhlin A K, Björk G, et al. 2012. Persistent inflow of warm water onto the central Amundsen shelf. Nat Geosci, 5(12): 876-880, doi:10.1038/ngeo1644.
Biddle L C, Heywood K J, Kaiser J, et al. 2017. Glacial meltwater identification in the Amundsen Sea. J Phys Oceanogr, 47(4): 933-954, doi:10.1175/jpo-d-16-0221.1.
Budillon G, Castagno P, Aliani S, et al. 2011. Thermohaline variability and Antarctic bottom water formation at the Ross Sea shelf break. Deep Sea Res Part I Oceanogr Res Pap, 58(10): 1002-1018, doi:10.1016/j.dsr.2011.07.002.
Comiso J C, Gordon A L. 1996. Cosmonaut polynya in the Southern Ocean: Structure and variability. J Geophys Res Oceans, 101(C8), 18297-18313, doi:10.1029/96JC01500.
General Administration of Quality Supervision, Inspection and Quarantine of the People’s Republic of China and Standardization Administration of China. 2007. Specifications for the oceanographic survey – Part 4: Survey of chemical parameters in sea water, GB/T 12763.4―2007 (in Chinese).
Gilly W F, Beman J M, Litvin S Y, et al. 2013. Oceanographic and biological effects of shoaling of the oxygen minimum zone. Annu Rev Mar Sci, 5(1): 393-420, doi:10.1146/annurev-marine-120710-100849.
Grantham B A, Chan F, Nielsen K J, et al. 2004. Upwelling-driven nearshore hypoxia signals ecosystem and oceanographic changes in the northeast Pacific. Nature, 429(6993): 749-754, doi:10.1038/ nature02605.
Han Z. 2018. “Biological Pump” and its response to changes in sea ice in the Prydz Bay, East Antarctica. Beijing: China University of Geosciences (in Chinese with English abstract).
Huang W, Yang X, Zhao J, et al. 2022. Dissolved nutrient distributions in the Antarctic Cosmonaut Sea in austral summer 2021. Adv Polar Sci, 33(3): 267-290, doi:10.13679/j.advps.2022.0099.
Iida T, Odate T, Fukuchi M. 2013. Long-term trends of nutrients and apparent oxygen utilization South of the polar front in Southern Ocean intermediate water from 1965 to 2008. PLoS One, 8(8): e71766, doi:10.1371/journal.pone.0071766.
Jacobs S S, Amos A F, Bruchhausen P M. 1970. Ross Sea oceanography and Antarctic bottom water formation. Deep Sea Res Oceanogr Abstr, 17(6): 935-962, doi:10.1016/0011-7471(70)90046-x.
Jenkins A. 1999. The impact of melting ice on ocean waters. J Phys Oceanogr, 29(9): 2370-2381, doi:10.1175/1520-0485(1999)029<2370: tiomio>2.0.co;2.
Keeling R F, Körtzinger A, Gruber N. 2010. Ocean deoxygenation in a warming world. Annu Rev Mar Sci, 2(1): 199-229, doi:10.1146/ annurev.marine.010908.163855.
Lazier J, Hendry R, Clarke A, et al. 2002. Convection and restratification in the Labrador Sea, 1990–2000. Deep Sea Res Part I Oceanogr Res Pap, 49(10): 1819-1835, doi:10.1016/S0967-0637(02)00064-X.
Lee S, Hwang J, Ducklow H W, et al. 2017. Evidence of minimal carbon sequestration in the productive Amundsen Sea polynya. Geophys Res Lett, 44(15): 7892-7899, doi:10.1002/2017gl074646.
Liu Y, Li S, Wu H, et al. 2002. Monitoring and analysis of phytoplankton and the key water quality parameters in the Four Pearl River Openings and the nearby beach waters, PR China. Environ Monit China, 18(2): 26-29,doi:10.19316/j.issn.1002-6002.2002.02.008 (in Chinese with English abstract).
Martinson D G. 2012. Antarctic circumpolar current’s role in the Antarctic ice system: An overview. Palaeogeogr Palaeocl, 335: 71-74, doi:10.1016/j.palaeo.2011.04.007.
Meijers A J S, Klocker A, Bindoff N L, et al. 2010. The circulation and water masses of the Antarctic shelf and continental slope between 30 and 80°E. Deep Sea Res Part II Top Stud Oceanogr, 57 (9/10): 723-737, doi:10.1016/j.dsr2.2009.04.019.
Monien D, Monien P, Brünjes R, et al. 2017. Meltwater as a source of potentially bioavailable iron to Antarctica waters. Antarct Sci, 29(3): 277-291, doi:10.1017/s095410201600064x.
Nakayama Y, Menemenlis D, Zhang H, et al. 2018. Origin of Circumpolar Deep Water intruding onto the Amundsen and Bellingshausen Sea continental shelves. Nat Commun, 9(1): 3403, doi:10.1038/s41467- 018-05813-1.
Ohshima K I, Fukamachi Y, Williams G D, et al. 2013. Antarctic Bottom Water production by intense sea-ice formation in the Cape Darnley polynya. Nat Geosci, 6(3): 235-240, doi:10.1038/ngeo1738.
Olbers D, Borowski D, Völker C, et al. 2004. The dynamical balance, transport and circulation of the Antarctic Circumpolar Current. Antarct Sci, 16(4): 439-470, doi:10.1017/S0954102004002251.
Orsi A H, Whitworth T, Nowlin W D. 1995. On the meridional extent and fronts of the Antarctic Circumpolar Current. Deep Sea Res Part I Oceanogr Res Pap, 42(5): 641-673, doi:10.1016/0967-0637(95)00021-W.
Raiswell R, Hawkings J R, Benning L G, et al. 2016. Potentially bioavailable iron delivery by iceberg-hosted sediments and atmospheric dust to the polar oceans. Biogeosciences, 13(13): 3887-3900, doi:10.5194/bg-13-3887-2016.
Rintoul S R, da Silva C E. 2019. Antarctic circumpolar current//Cochran J K, Bokuniewicz H J, Yager P L. Encyclopedia of ocean sciences, 3rd edn. Cambridge, MA: Academic Press, 248-261, doi:10.1016/ b978-0-12-409548-9.11298-9.
Schmidtko S, Stramma L, Visbeck M. 2017. Decline in global oceanic oxygen content during the past five decades. Nature, 542(7641): 335-339, doi:10.1038/nature21399.
Shepherd A, Wingham D, Rignot E. 2004. Warm ocean is eroding West Antarctic Ice Sheet. Geophys Res Lett, 31: L23402, doi:10.1029/ 2004GL021106.
Shepherd A, Fricker H A, Farrell S L. 2018. Trends and connections across the Antarctic cryosphere. Nature, 558(7709): 223-232, doi:10.1038/s41586-018-0171-6.
Solodoch A, Stewart A L, Hogg A M, et al. 2022. How does Antarctic bottom water cross the Southern Ocean? Geophys Res Lett, 49: e2021GL097211, doi:10.1029/2021GL097211.
Tagliabue A, Bopp L, Aumont O. 2009. Evaluating the importance of atmospheric and sedimentary iron sources to Southern Ocean biogeochemistry. Geophys Res Lett, 36(13): L13601, doi:10.1029/ 2009gl038914.
Testa J M, Kemp W M. 2011. Oxygen – dynamics and biogeochemical consequences//Wolanski E, McLusky D S. Treatise on estuarine and coastal science. Waltham: Academic Press, 163-199, doi:10.1016/ b978-0-12-374711-2.00505-2.
The IMBIE team. 2018. Mass balance of the Antarctic Ice Sheet from 1992 to 2017. Nature, 558(7709): 219-222, doi:10.1038/s41586-018-0179-y.
Vaquer-Sunyer R, Duarte C M. 2008. Thresholds of hypoxia for marine biodiversity. Proc Natl Acad Sci USA, 105(40): 15452-15457, doi:10.1073/pnas.0803833105.
Walker D P, Brandon M A, Jenkins A, et al. 2007. Oceanic heat transport onto the Amundsen Sea shelf through a submarine glacial trough. Geophys Res Lett, 34(2): L02602, doi:10.1029/2006gl028154.
Wang B, Fan L F, Zheng M F, et al. 2022. Carbon and iron uptake by phytoplankton in the Amundsen Sea, Antarctica. Biology, 11(12): 1760, doi:10.3390/biology11121760.
Wei Z, Zhang Z, Wang X, et al. 2022. The thermodynamic and dynamic control of the sensible heat polynya in the western Cosmonaut Sea. Deep Sea Res Part II Top Stud Oceanogr, 195: 105000, doi:10.1016/j. dsr2.2021.105000.
Welschmeyer N A. 1994. Fluorometric analysis of chlorophyllin the presence of chlorophylland pheopigments. Limnol Oceanogr, 39(8): 1985-1992, doi:10.4319/lo.1994.39.8.1985.
Williams G D, Nicol S, Aoki S, et al. 2010. Surface oceanography of BROKE-West, along the Antarctic margin of the south-west Indian Ocean (30–80°E). Deep Sea Res Part II Top Stud Oceanogr, 57(9/10): 738-757, doi:10.1016/j.dsr2.2009.04.020.
Xing S, Hou X L, Shi K L, et al. 2020. Circulation of Circumpolar Deep Water and marine environment traced by127I and129I speciation in the Amundsen Sea Polynya, Antarctica. J Environ Radioactiv, 225: 106424, doi:10.1016/j.jenvrad.2020.106424.
Yin Y, Wu Z, Liu M, et al. 2014. Dynamic distributions of dissolved oxygen in Lake Qiandaohu and its environmental influence factors. Environ Sci, 35(7): 2539-2546. doi: 10.13227/j.hjkx.2014.07.015 (in Chinese with English abstract).
Text S1 Operational quality supervision
The whole polar field operation and sample analysis follow the operational quality supervision, including human, machine, sample, method, and environment, as described in Huang et al. (2022). In brief, the “human” means all executors on sampling and analyzing of DO have received professional train for this project; “machine” means all instruments for sampling and analyzing of DO have been verified and calibrated during the investigation, and all measuring instruments are traceable to their sources using comparison and relevant documents; “sample” means all related processes, including sampling, storage, and transportation of DO, are strictly carried out by relevant provisions; “method” means corresponding rules and regulations are followed during the whole process on sampling and analyzing of DO, including laboratory management regulations, equipment operating procedures, and investigation operation standards and norms; and “environment” means the environment for sampling, analysis and storage of DO are clean and in order.
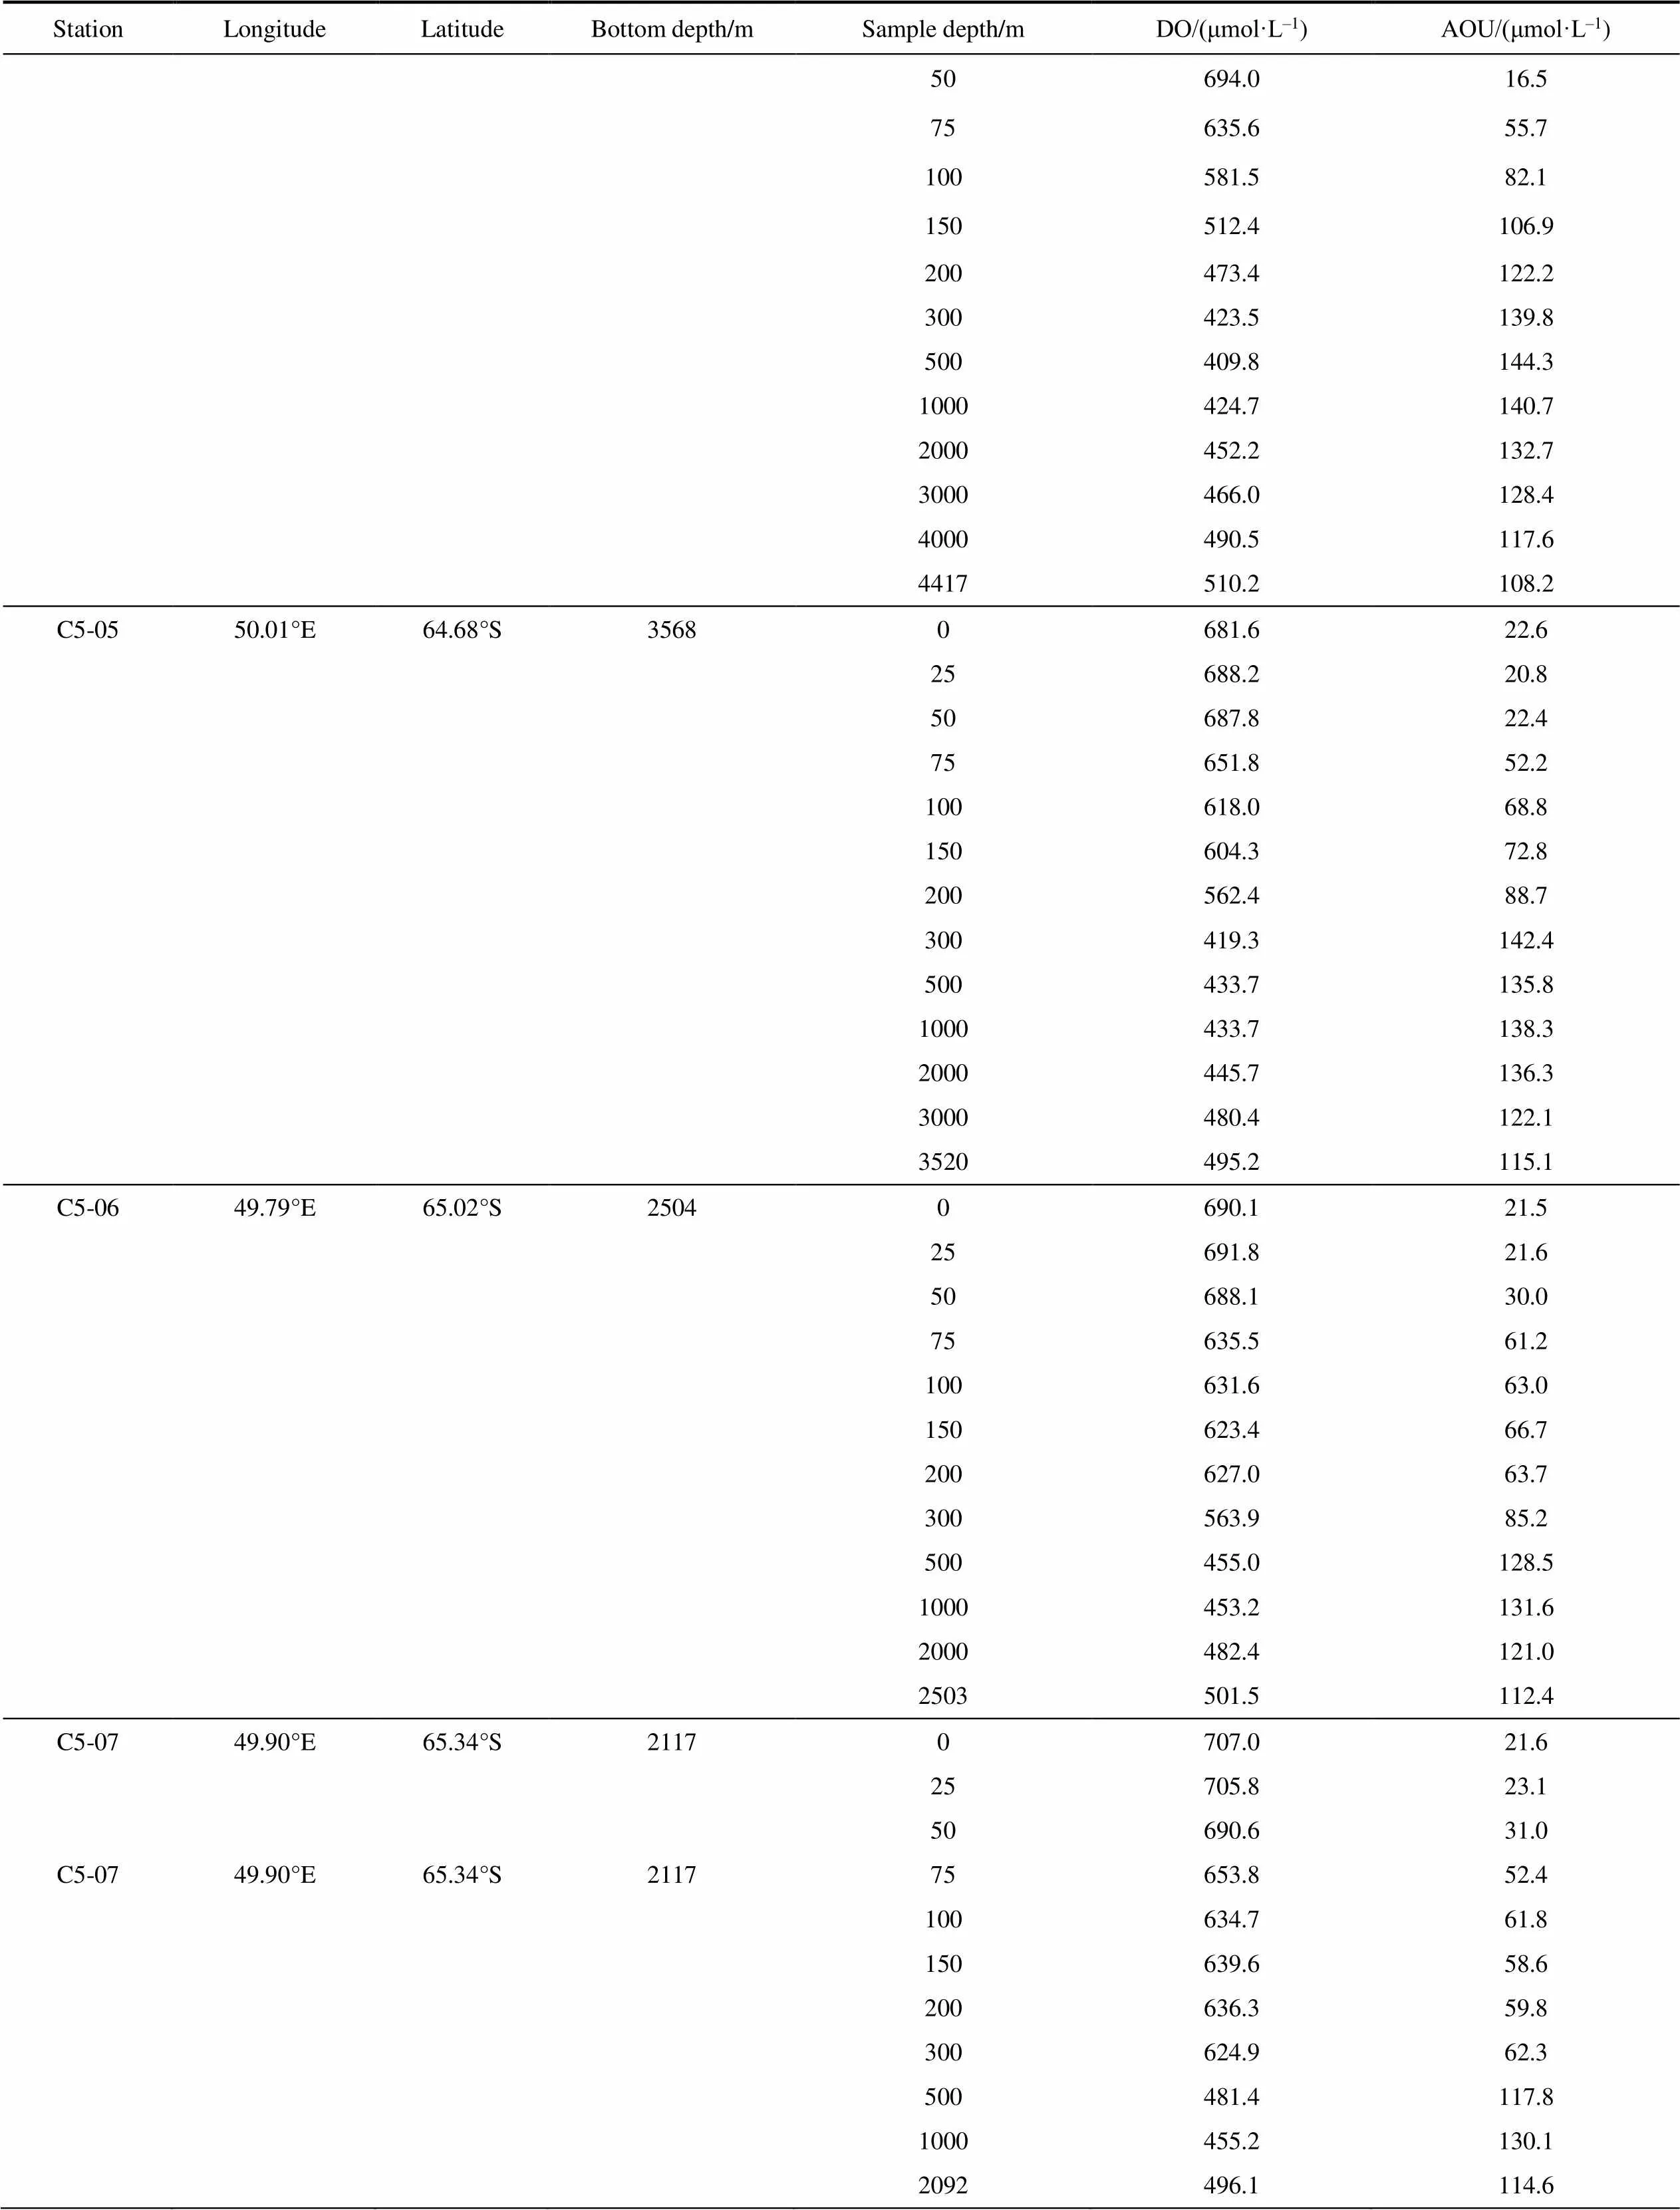
Table S1 The concentrations of DO and AOU in the Cosmonaut Sea of the whole water depth

StationLongitudeLatitudeBottom depth/mSample depth/mDO/(μmol·L–1)AOU/(μmol·L–1) C2'-0634.01°E65.17°S15880735.3–15.4 25732.6–10.5 50655.448.1 75623.166.9 100609.373.0 150540.998.4 200490.9116.5 300434.7137.0 500426.1140.1 1000421.1144.6 1578434.4140.5 C2'-0833.98°E65.56°S32760735.0–15.6 25732.7–3.7 50637.458.8 75613.471.6 100599.877.5 150544.096.5 200453.0129.7 300420.8141.1 500416.3142.6 1000424.1141.7 2000456.0131.0 3264494.6114.8 C2'-0933.72°E66.01°S11940728.0–10.1 25789.5–30.9 50651.552.0 75622.867.2 100616.969.8 150606.972.8 200468.6130.7 300431.0142.1 500401.0154.8
Continued
Continued

Continued
Continued

Continued
Continued

Continued

Continued

Continued
Note: Parallel samples (see Table 1 for detailed information) were presented with mean values.
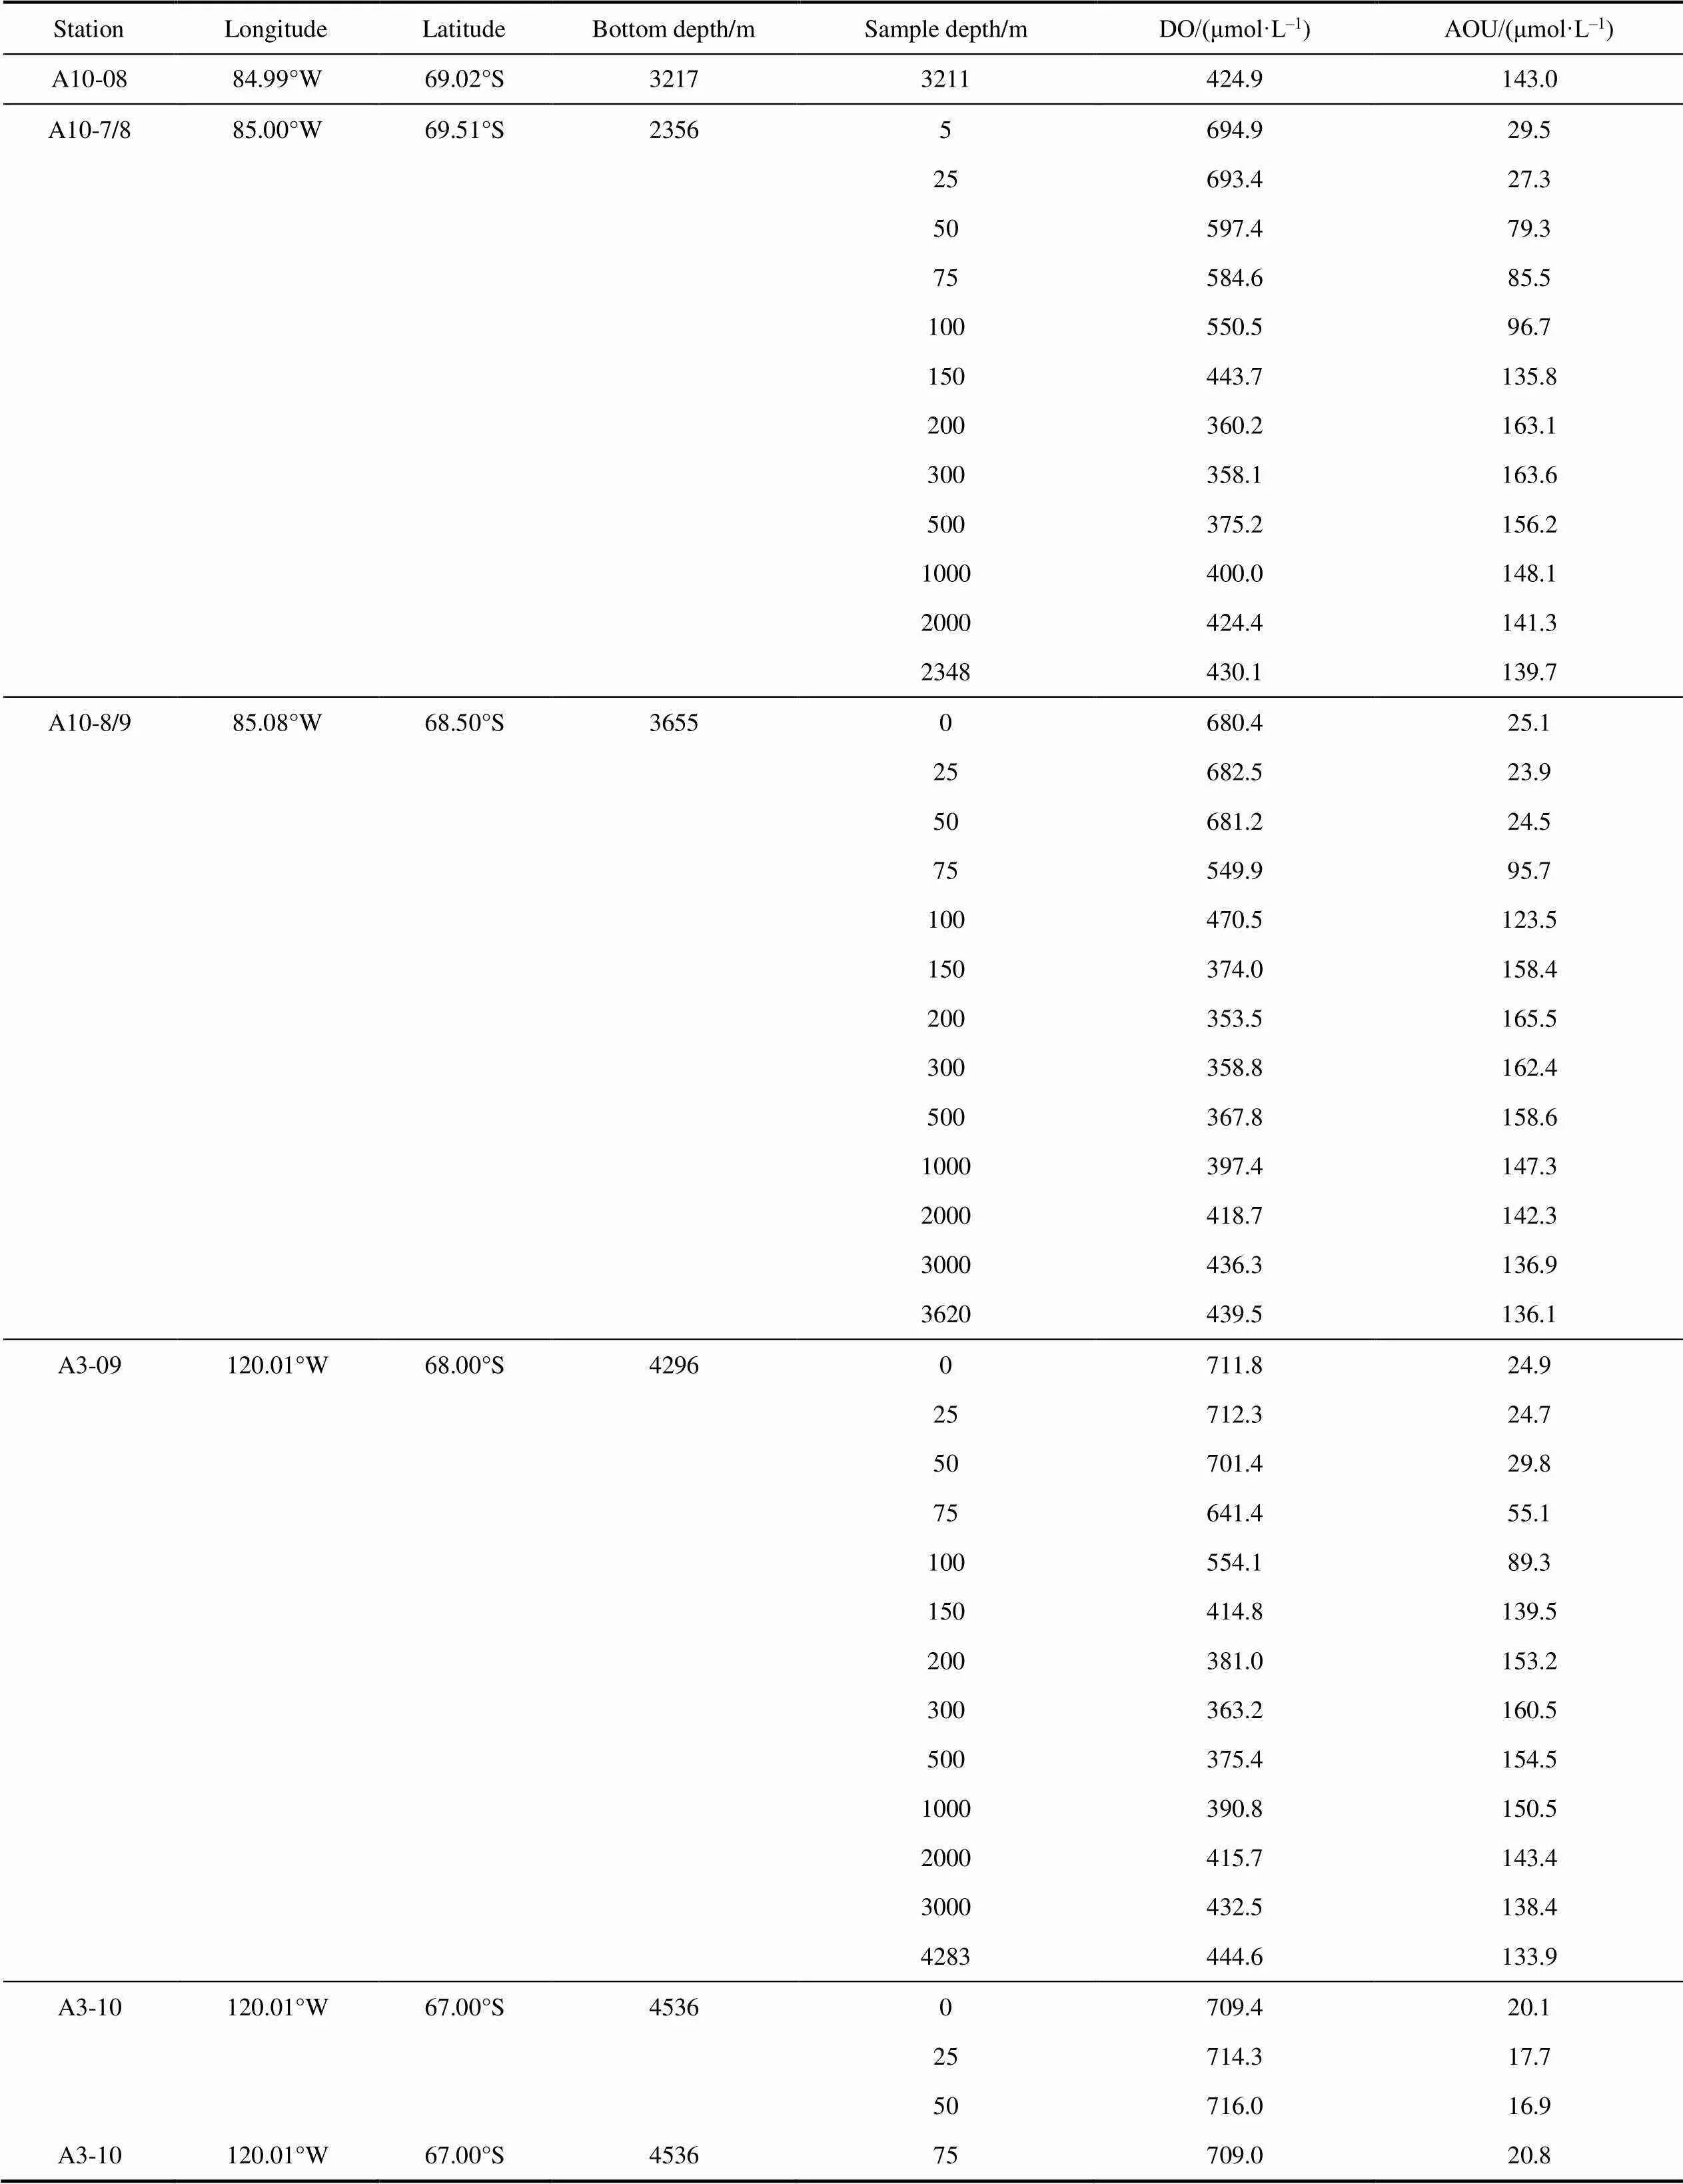
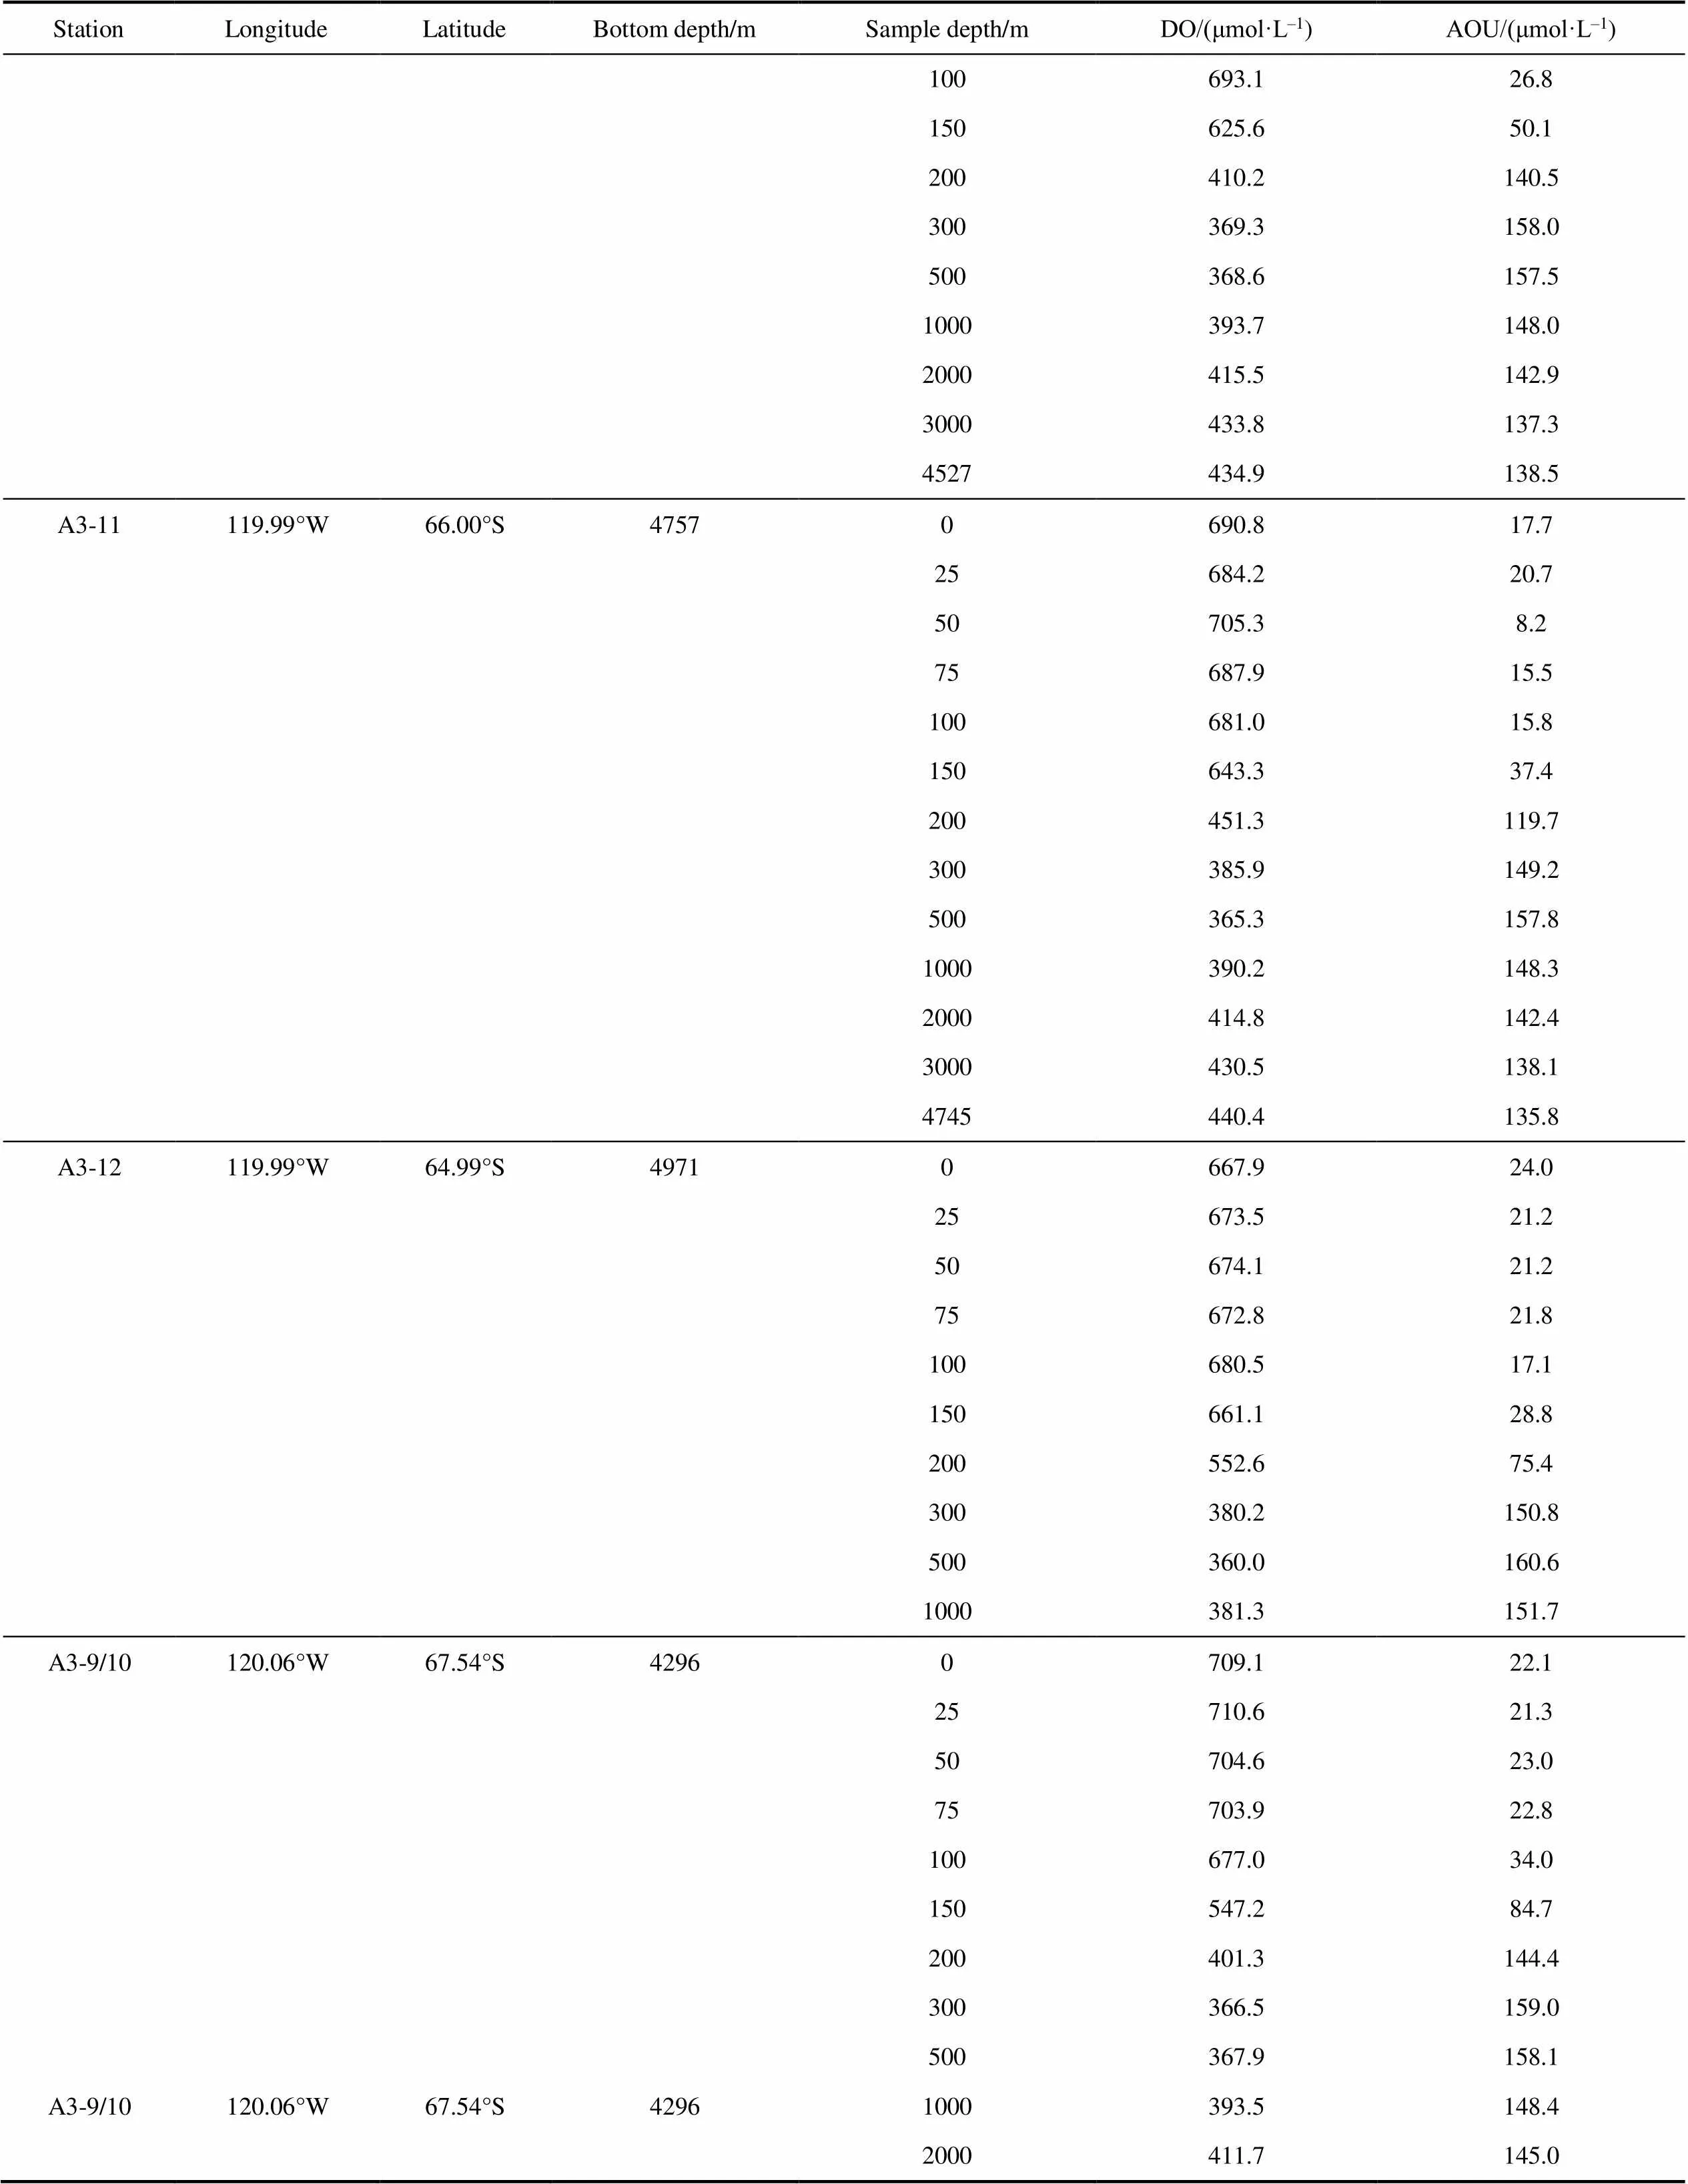
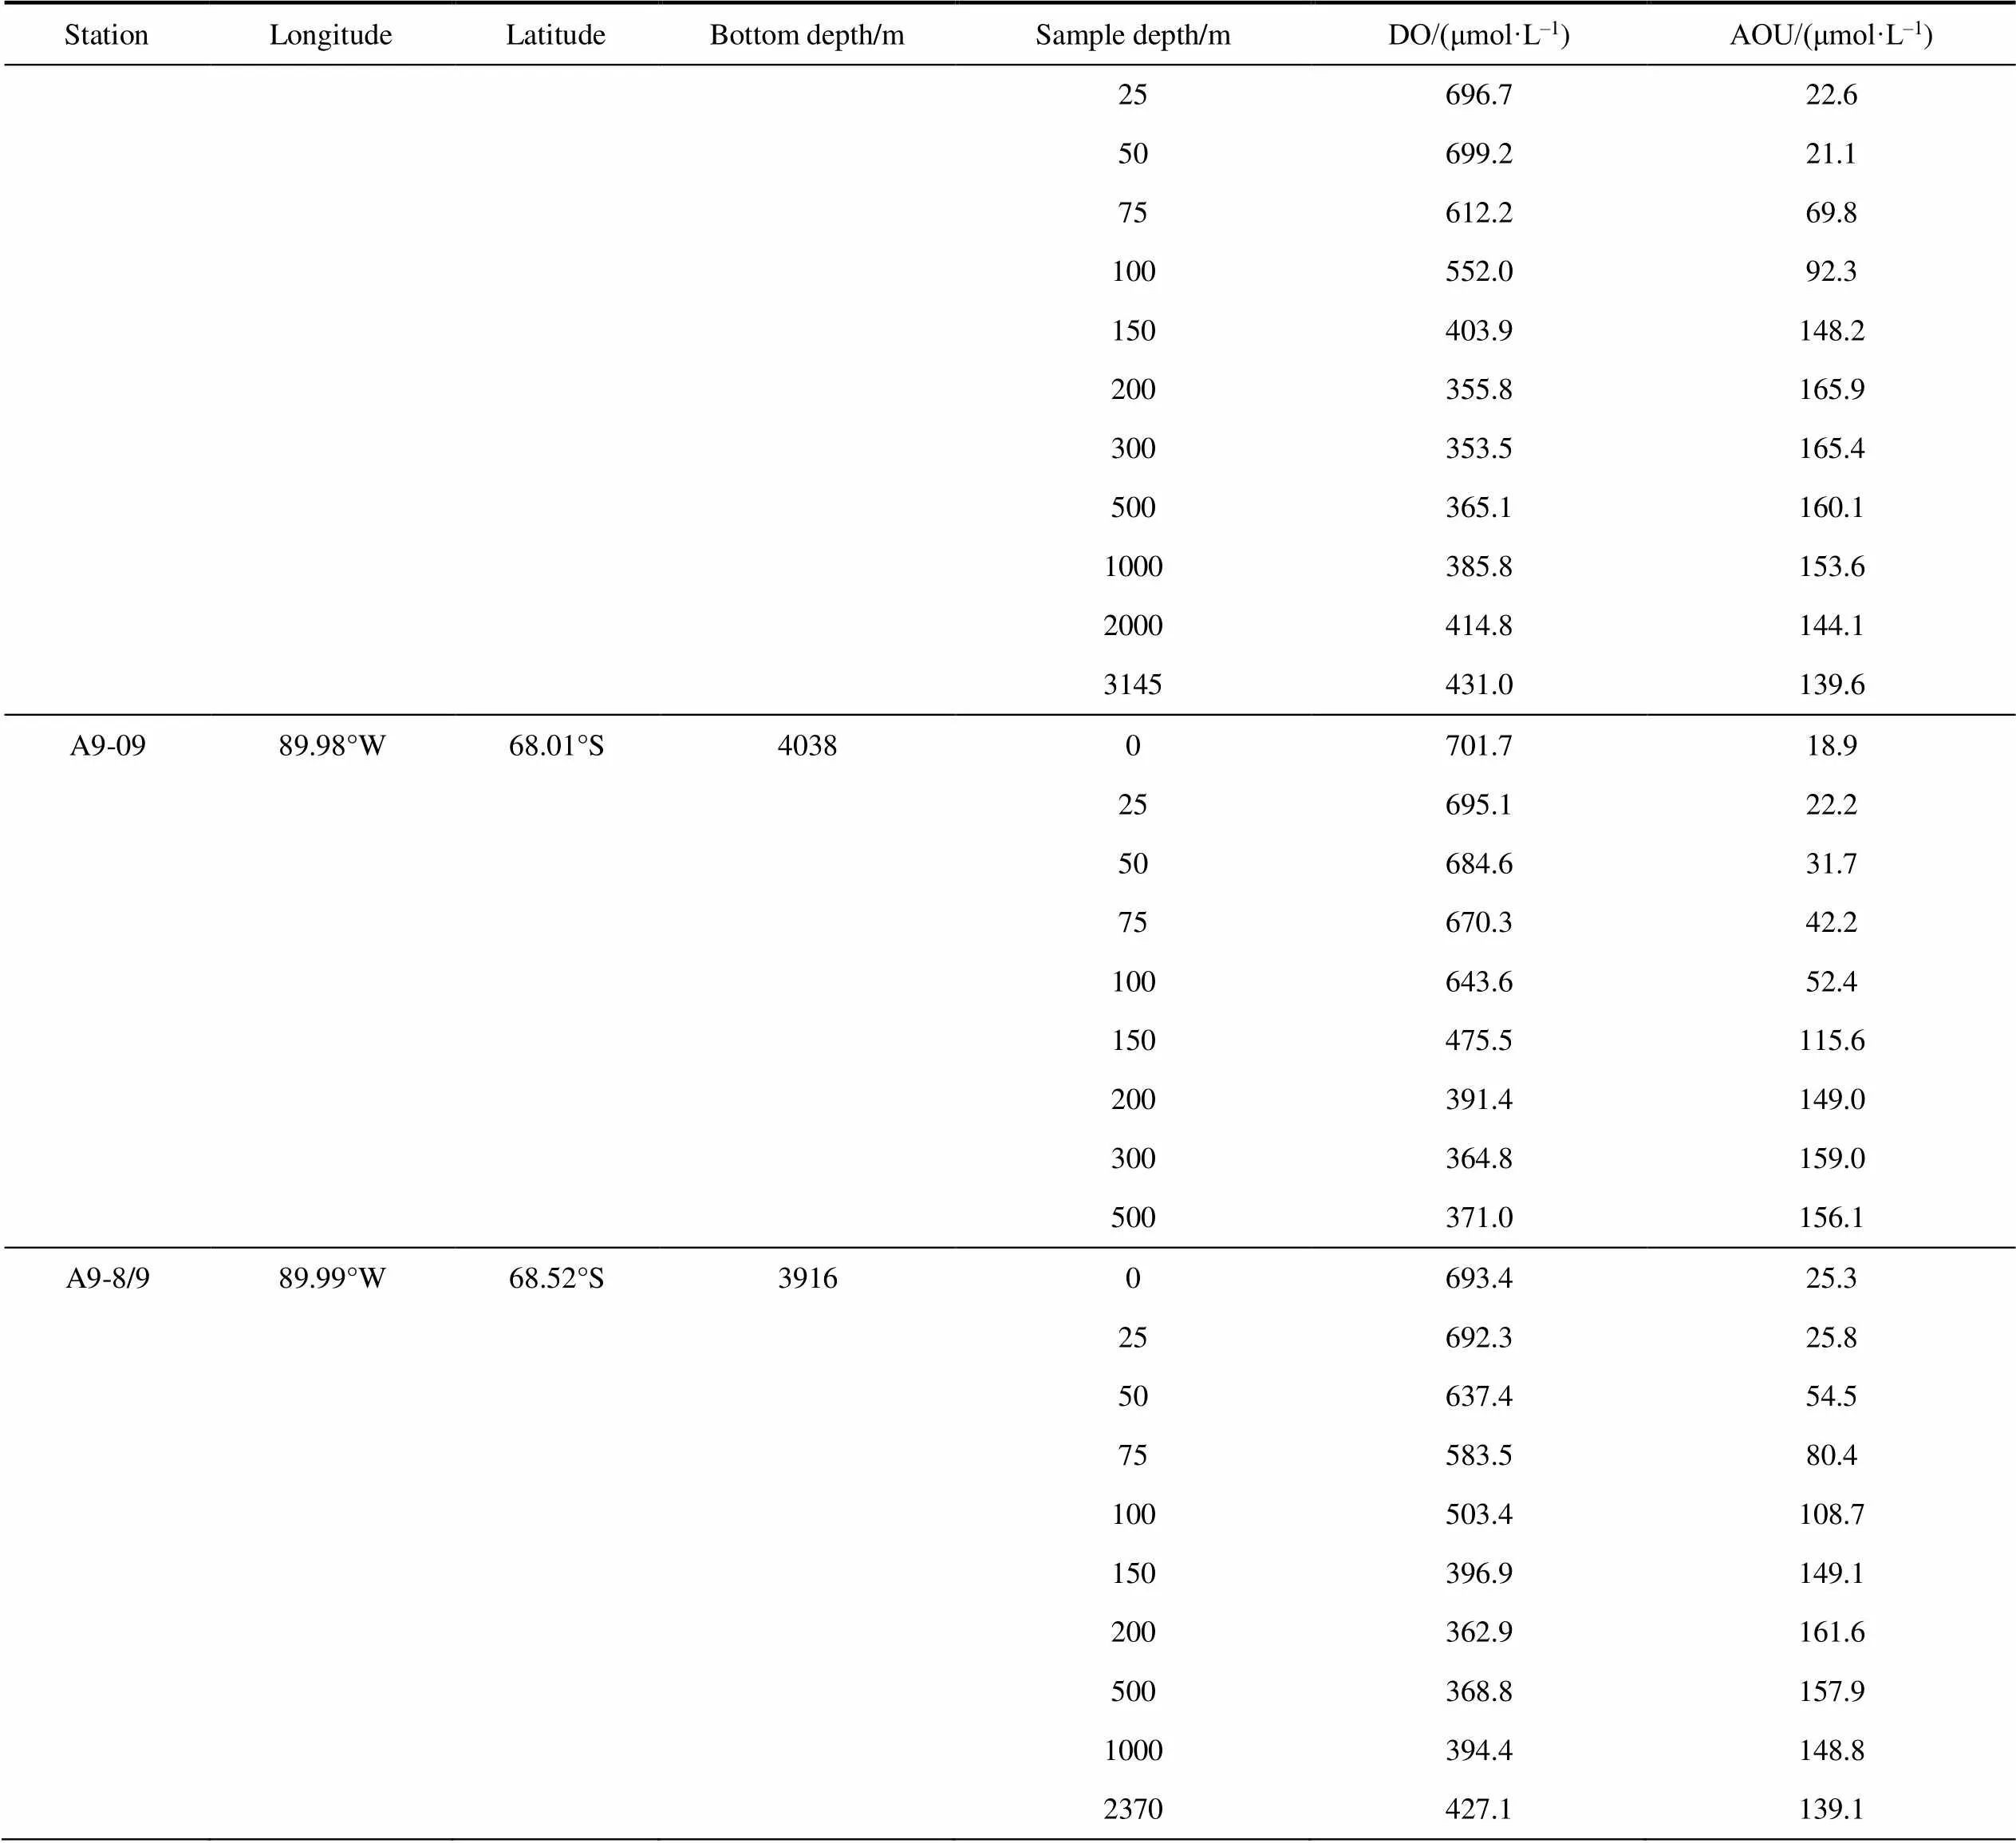
Table S2 The concentrations of DO and AOU in the Amundsen Sea of the whole water depth
Continued
Continued

Continued
Continued
Note: Parallel samples (see Table 1 for detailed information) were presented with mean values.
Figure S1 Horizontal distributions of DO in the Cosmonaut Sea of the whole water depth.
Figure S2 Horizontal distributions of AOU in the Cosmonaut Sea of the whole water depth.

Figure S3 Horizontal distributions of Chlin the Cosmonaut Sea (a) and Amundsen sea (b) of the upper ocean.
Figure S4 Horizontal distributions of DO in the Amundsen Sea of the whole water depth.
Figure S5 Horizontal distributions of AOU in the Amundsen Sea of the whole water depth.
Figure S6 Vertical distributions of potential temperature for the whole water depth along transects C2', C4, C5 and C7 in the Cosmonaut Sea and transects A3 and A10 in the Amundsen Sea. Major water masses and fronts are labelled as defined in Williams et al. (2010): AASW: Antarctic Surface Water; WDW: Warm Deep Water; CDW: Circumpolar Deep Water; mCDW: modified Circumpolar Deep Water; AABW: Antarctic Bottom Water; SB: Southern Boundary of Antarctic Circumpolar Current; sACCf: the southern Antarctic Circumpolar Current front. Note: depth was displayed in logarithmic form.
: Guo J Y, Yang X F, Zhao J, et al. Distributions of dissolved oxygen and apparent oxygen utilization in the Cosmonaut Sea and Amundsen Sea in austral summer 2021. Adv Polar Sci, 2023, 34(4): 272-303,doi: 10.12429/j.advps.2023.0007
10.12429/j.advps.2023.0007
5 June 2023;
13 December 2023;
30 December 2023
, ORCID: 0000-0001-6592-3365, E-mail:jzhao@sio.org.cn
杂志排行
Advances in Polar Science的其它文章
- Space physics and astronomy research from Chinese polar stations:current and future directions
- Variations and relations between chlorophyll concentrations and physical-ecological processes near the West Antarctic Peninsula
- Chemical composition of natural waters at Broknes Peninsula,Larsemann Hills,Antarctica
- Evaluation of meteorological predictions by the WRF model at Barrow,Alaska and Summit,Greenland in the Arctic in April 2019
- Current state of research on microplastics in the marine-atmosphere environment of the Arctic region
- Carbon isotope ratios of n-alkanoic acids:new organic proxies for paleo-productivity in Antarctic ponds