Chemical composition of natural waters at Broknes Peninsula,Larsemann Hills,Antarctica
2024-01-25SergeyKAKAREKATamaraKUKHARCHYKYuryGIGINYAKPeterKURMAN
Sergey KAKAREKA, Tamara KUKHARCHYK, Yury GIGINYAK & Peter KURMAN
Article
Chemical composition of natural waters at Broknes Peninsula,Larsemann Hills,Antarctica
Sergey KAKAREKA1*, Tamara KUKHARCHYK1, Yury GIGINYAK2& Peter KURMAN3
1Institute for Nature Management, National Academy of Sciences of Belarus, Laboratory of Transboundary Pollution, Minsk 220076, Belarus;2Scientific and Practical Center for Bioresources, National Academy of Sciences of Belarus, Minsk 220072, Belarus;3Institute of Bioorganic Chemistry, National Academy of Sciences of Belarus,Laboratory of Physical and Chemical Methods, Minsk 220141, Belarus
The article contributes to the study of the content of major and trace elements in various types of natural waters of the Broknes Peninsula, Larsemann Hills, Antarctica collected in January–February 2014 and 2020 during the 7th and 12th Belarusian Antarctic Expeditions. Samples of old (13 samples) and newly fallen snow (5), lakes (23) and groundwater (8) were analyzed. The content of 25 major and trace elements was determined using ICP-MS method, main anions was determined by titrimetric and turbidimetric methods. Good similarity chemical composition of snow, groundwater and lake waters in spite of differences in the content of major ions and trace elements has been obtained. The influence of marine salts on natural waters are analyzed, and their accumulation in lake waters especially in the endorheic small and shallow lakes in spite of ultra-oligotrophic atmospheric precipitates are shown. The spatial heterogeneity of groundwater and temporal and spatial heterogeneity of lake waters have been demonstrated. The results are important for understanding the variabilities of major and trace elements content in snow, groundwater and lake waters, and their relationship, as well as for identifying trends in their change, taking into account anthropogenic loads in the region and climate change.
Antarctica, snow, groundwater, lake, major element,trace element
1 Introduction
Antarctica is a continent mostly covered by ice. Ice-free oases occupying an extremely small area in the coastal region are of particular interest for studying the chemical composition of natural waters and the factors of their formation (Matsumoto et al., 1992; Nędzarek et al., 2015; Zelano et al., 2017; Asthana et al., 2019). Unlike other natural zones of the Earth, there is no liquid precipitation, and the solid precipitation that falls is very unevenly distributed. These features, combined with predominantly low air temperatures, the presence of permafrost, high solar activity in short summers, strong wind and other factors form specific conditions for the chemical and physical weathering of rocks and the leaching of chemical elements. Significant variability of the content of chemical elements in lakes and temporary water bodies have been shown for different oases up to now (Torii et al., 1988; Fedorova, 2003; Quesada et al., 2006; Hodgson, 2012; Verleyen et al., 2012; Kakareka et al., 2019). The chemical composition of snow as well as streams and groundwater is influenced by various geographical and climatic factors (Bertler et al., 2005; Lyons et al., 2005; Hofstee et al., 2006; Welch et al., 2010; Dixon et al., 2013; Krogulec et al., 2018). Remaining the cleanest continent, Antarctica has also attracted attention in recent decades due to the increase of anthropogenic loads and their negative consequences for aquatic systems and other components of the environment (Bargagli, 2008).
Larsemann Hills is the second largest and southernmost coastal oasis in the Prydz Bay region of East Antarctica. It was firstly charted in February 1935 by Thorshavn Klarius Mikkelsen, the captain of the whaling ship, but human activities have been started since the end of 1980s. To date, four scientific stations are operating in the oasis: Law-Racoviţă-Negoiţă (opened as the Australian Law Base in 1986; transferred to Romania in 2006), the Russian Progress Station (opened in 1988), the Chinese Zhongshan Station (opened in 1989), Indian Bharati Station (opened in 2012). An airstrip operates about 10 km south from Progress Station on the northern slope of the ice dome.
Larsemann Hills is characterized by a large number of lakes of various genesis and properties (Gillieson et al., 1990). Studies of their hydrochemical composition were started during the Australian National Antarctic Research Expedition (ANARE) in 1987, when 74 lakes were initially surveyed, including 20 lakes, located on the Broknes Peninsula. The obtained data on pH values, electrical conductivity, total amount of dissolved salts and basic ions were presented by Gillieson et al. (1990). In 1996 and 1997 a number of lakes on the Mirror Peninsula and Broknes Peninsula were studied by Gasparon and Burges (2000) and Gasparon et al. (2002).
Subsequently, the Stornes and Grovnes peninsulas and a number of islands were involved in the study in connection with Indian station construction (NCAOR, 2010; Asthana et al., 2013; Tiwari and Singh, 2014; Bharti and Niyogi, 2015; Bharti et al., 2016; Tiwari, 2017). The ionic composition of lakes and content of microelements were analyzed. During the 34th Indian Scientific Expedition from 2014 to 2015, lakes on the Broknes and Grovnes peninsulas were surveyed in order to assess their coliform bacteria (Bhardwaj and Jindal, 2022), as well as the physic-chemical properties and the content of a number of heavy metals (Bhardwaj et al., 2023). In the paper Asthana et al. (2019) considered the weathering of rocks as a factor affecting the hydrochemistry of lakes. Biogeochemical cycles of microelements were the subject of studies by Nuruzzama et al. (2021).
A number of lakes in Larsemann Hills were studied in the framework of Russian Antarctic expeditions, including assessment of their stability on an example of lakes Stepped and Progress (Nigamatzyanova and Fedorova, 2015) and factors of the hydrological regime formation (Shevnina and Kourzeneva, 2017; Boronina et al., 2019; Kuznetsova et al., 2021; Shevnina et al., 2021).
As for the study of snow, there are much fewer publications; they were carried out mainly in the western part of the oasis. Thus, in 2007, the ionic composition and content of trace elements in surface snow, collected along the 20 km transect from the Grovnes Peninsula in a southwestern direction, were studied (Thamban et al., 2010; Thamban and Thakur, 2013). In 2009–2010 the ionic composition of a very limited number of samples of the newly fallen snow (3 samples) and surface snow (5 samples) were analysed (Budhavant et al., 2014). At the same time, samples of surface snow were taken along the 127 km transect, and the first of them was collected at a distance of 27 km from the coast. Data on snow composition for the Broknes Peninsula were not found.
Wet valleys with waterlogged soils are typical landscapes for Larsemann Hills (Mergelov, 2014; Nikitin and Semenov, 2020). According to Mergelov (2014), in the valleys, the lower soil horizons from a depth of 40 cm are in the maximum water saturated state, and their moisture content (21%–30%) are close to the total moisture capacity of coarse sandy substrates. Groundwater as the source of lakes nutrition in Larsemann Hills is mentioned by Kuznetsova et al. (2021). But no data regarding the content of major and trace elements in groundwater of Larsemann Hills have been found. Only content of nutrients in subsurface flows of natural and human impacted lake catchments on Broknes Peninsula has been studied by Kaup and Burgess (2002). Quesada et al (2006) mentioned about increased salinity groundwater in the Larsemann Hills. By our data (Kukharchyk et al., 2022), the level of groundwater in the wet valleys varies from 10 to 90 cm. Therefore, like in others areas in Antarctic, investigation of groundwater on Broknes Peninsula is important from point of view its chemical composition formation and geochemical processes in the landscapes.
The purpose of this study is to analyze the content of major and trace elements in snow and groundwater in relation to lake waters for the subsequent interpretation of the variabilities of their chemical composition and identification of sources of their nutrition.
2 Methods and objects
2.1 Study area and sampling
The studies were carried out in the eastern part of Broknes Peninsula (69°30′S and 76°20′E) in January– February 2014 and 2020 during the 7th and 12th Belarusian Antarctic Expeditions and included sampling of snow from snowfields, newly fallen snow, groundwater and lake waters.
Old snow was taken from the surface of snowfields with a stainless steel scoop to a depth of 10–15 cm. Newly fallen snow was taken to the entire depth, which ranged from 2 to 5 cm.
Sampling from lakes was carried out from a shore by immersing the bottle into the lake. According to Gasparon et al. (2002), distribution of the main chemical characteristics of lakes over depth is quite uniform due to the open surface in summer and mixing of the water mass by wind. Therefore, surface samples can be considered representative for the whole lake. The following lakes have been tested: Boulder, Progress, Discussion, Sarah Tarn, Reid, Scandrett/ Nella Lake, Sibthorpe and Stepped/Heart Lake. The fragments of some investigated lakes and their catchments are presented at Figure 1.
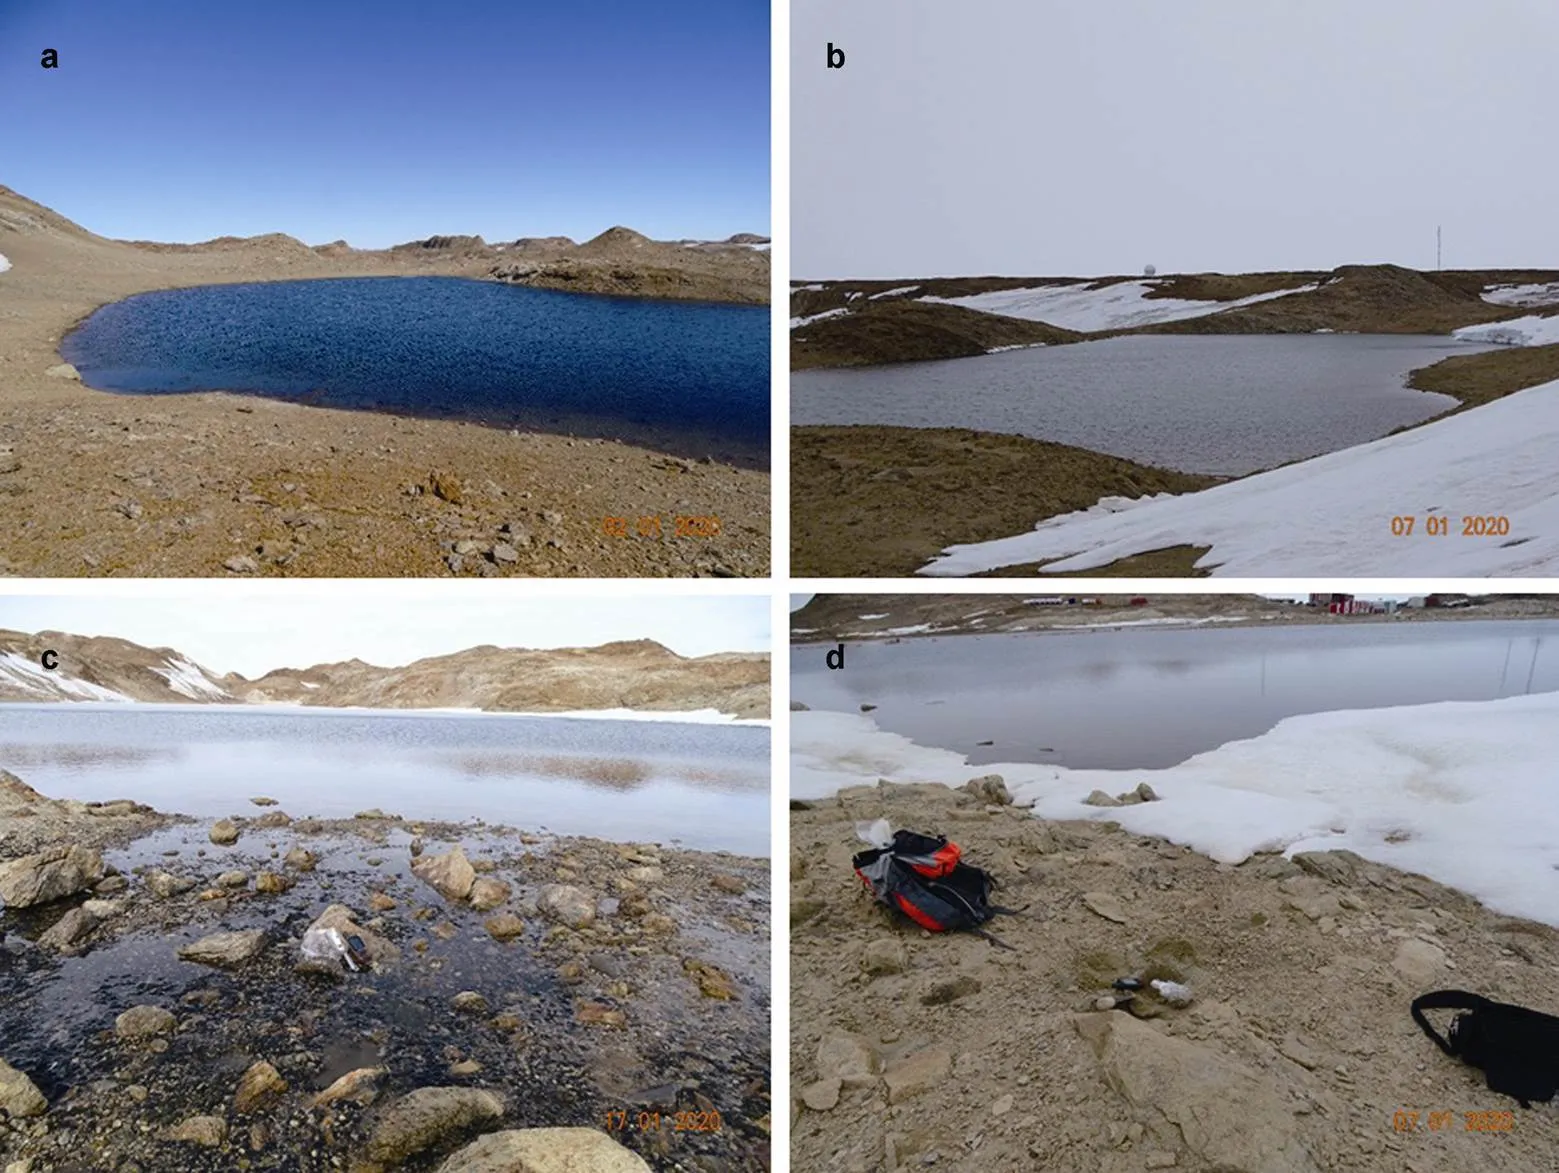
Figure 1 View of some lakes of Broknes Peninsula and their catchments in January 2020. a, Sarah Tarn Lake; b, Lake Reid; c, Lake Scandrett; d, Stepped Lake.
Soil pits for groundwater collection were laid in the bottom of two wet valleys. The first valley (Valley I) (69°23.291′S; 76°22.344′E; 15 m a.s.l.) represent the catchment of Lake Scandrett (Figure 2a). Meltwater from the snowfields forms surface and underground streams (Kukharchyk et al., 2022). A geochemical profile with 180 m length was laid down from the lower part of the slope and till the Lake Scandrett. It was passing near the stream splitting into several flows. Five soil pits with the depth 20–60 cm were laid in the bottom of the valley. Groundwater appeared at the depth from 10 to 40 cm. The second valley (Valley II) (69°23.143'S; 76°23.338'E; 35 m a.s.l.) is located between small hills 1 km south of Progress station. A temporary stream at the bottom is lost in the soil (Figure 2b). Snowfields are partly preserved on the eastern leeward slope. The road from the station to the runway runs along the footslope. A geochemical profile 120 m length was laid down and 3 soil shallow pits with the depth 20 cm were excavated. The level of subsurface meltwater was about 10 cm.
All samples were taken into low density polyethylene bottles (0.1 L and 0.5 L), which were pre-washed in the Laboratory of Transboundary Pollution in Minsk, Belarus. After sampling, the lid was wrapped with parafilm to seal the container. Samples were frozen and stored in a freezer until their delivery to Belarus.
In total, 13 samples of snow, 5 samples of newly fallen snow, 23 samples of surface waters from 8 lakes, and 8 samples of groundwater were collected on Broknes Peninsula.The sampling scheme is shown in Figure 3.
2.2 Chemical and analytical methods
The content of major and trace elements (Na, Mg, Ca, K, Fe, Al, Ag, As, Ba, Be, Cd, Co, Cr, Cu, Mn, Mo, Ni, Pb, Sb, Se, Th, Tl, U, V and Zn), major anions (HCO3−, Cl−and SO42−) as well as pH and electrical conductivity has been measured.
An Agilent 7500cx ICP-MS inductively coupled plasma mass spectrometer with a helium collision cell, which eliminates possible interference, was used. All samples were filtered through a 0.45 µm syringe filters before pipetting. The aliquots (5 mL) of samples were pipetted into high density polyethylene tubes for the rack of the integrated autosampler of the Agilent 7500cx ICP-MS system and 0.2 mL of ultrapure-grade nitric acid (69%) were added to each aliquot. The analytical procedure was started in 1 h.
A standard solution (environmental calibration standard, Agilent 5183-4688) 1000 mg·L−1each of Fe, K, Ca, Na, Mg, and 10 mg·L−1each of Ag, Al, As, Ba, Be, Cd, Co, Cr, Cu, Mn, Mo, Ni, Pb, Sb, Se, Tl, V, Zn, Th and U in 10% HNO3was applied for instrumental calibration. The calibration blanks, which were always lower than the detection limit, were prepared in order to control analytical accuracy.
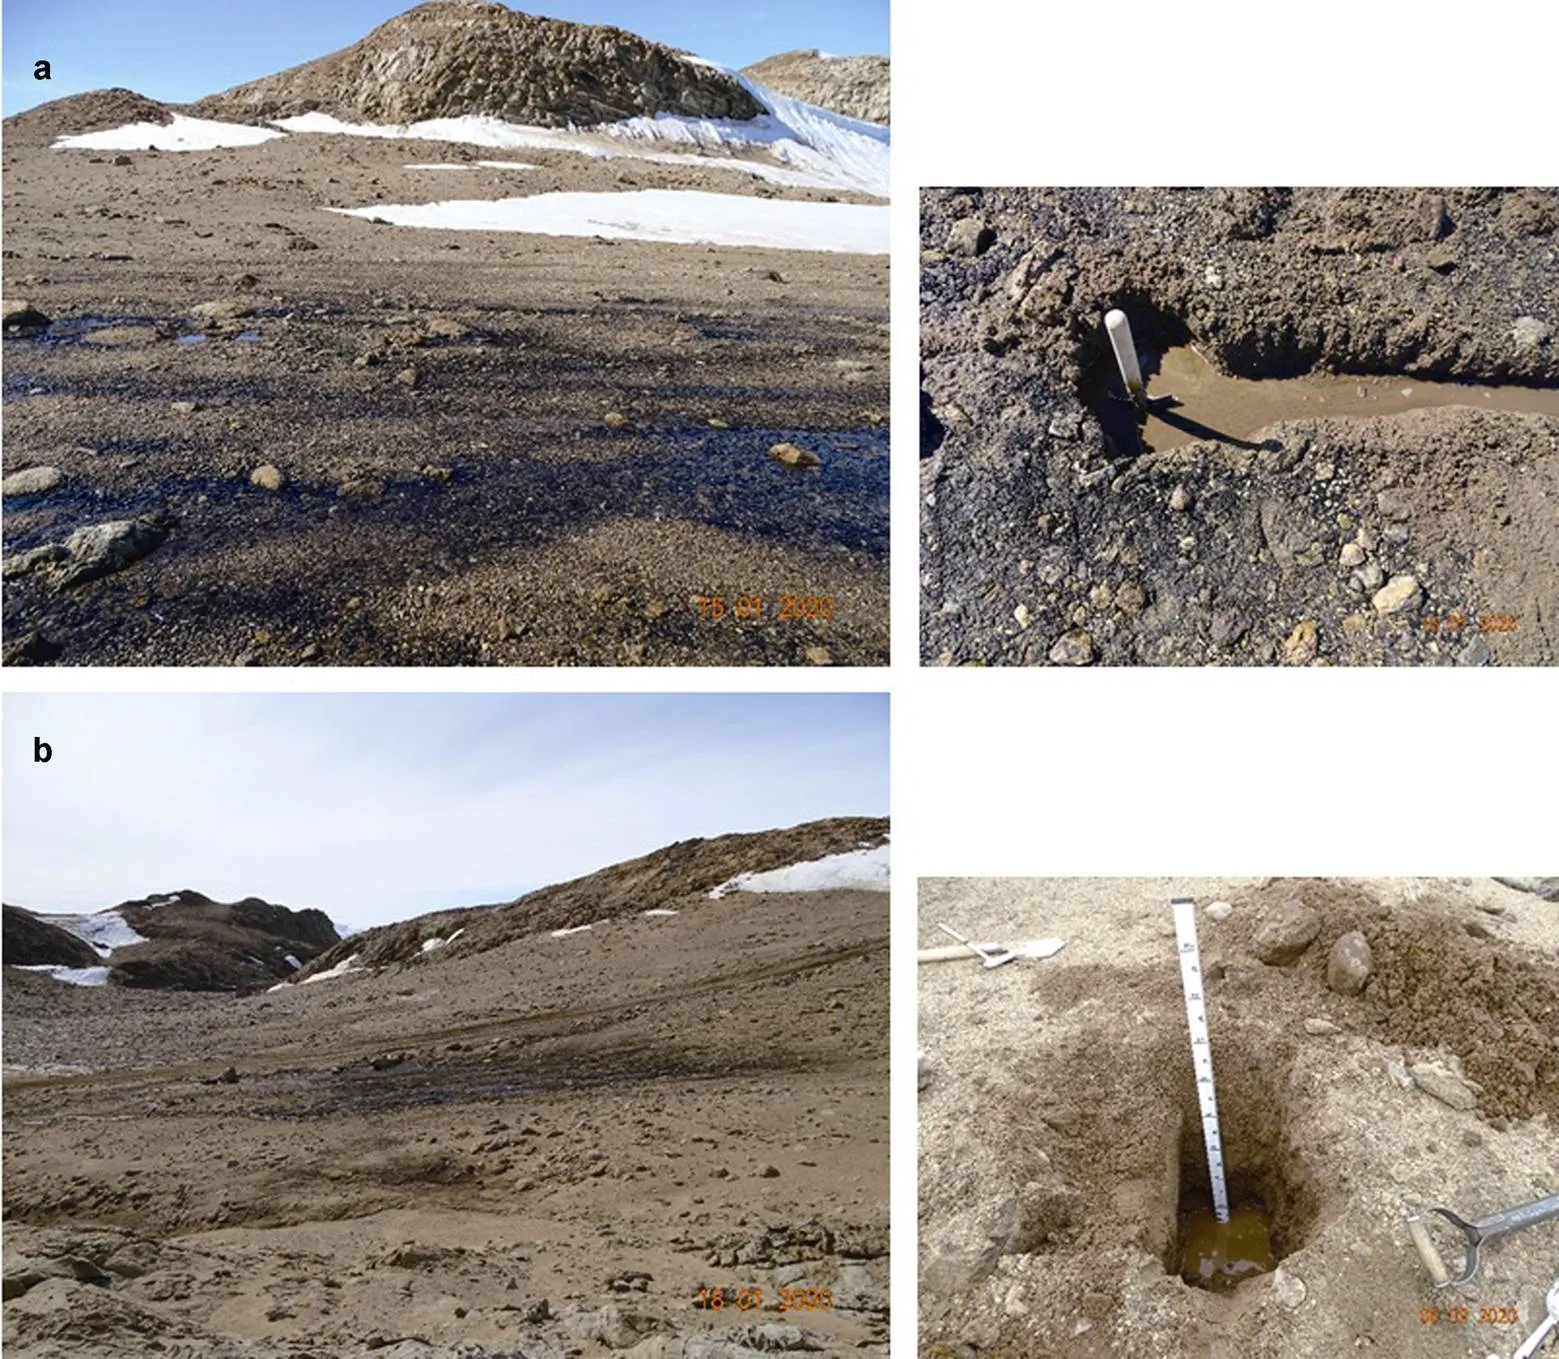
Figure 2 View of wet valleys (left) and soil pits (right) for groundwater sampling from Broknes Peninsula. a, Valley I; b, Valley II.
Figure 3 Location of snow, lake waters and groundwater sampling points at Broknes Peninsula.
The field blank was prepared in the laboratory but without the field sampling step: during the sampling of snow and water, an acid-cleaned polyethylene bottle was handled in the same manner as other bottles, but it was not filled with snow or water. Instead, it was frozen and preserved following the same procedure as the samples. During samples preparation the bottle was filled with 100 mL of ultrapure water, closed again, gently shaken and was allowed to stand for 30 min. This field blank was also analyzed similar to the samples.Detection limits were estimated as three times the standard deviations of the blank (Kakareka et al., 2022).
Quality control was evaluated by duplicate analysis of Blank Laboratory Control and Laboratory Control Sample Water as well as Matrix Spike and Matrix Spike Duplicate. For recovery rates evaluation the following known concentrations of Environmental Calibration Standard (Agilent 5183-4688) has been used: 20 mg·L−1for Na, Ma, K, Ca and Fe and 200 µg·L−1for others elements. Mean recovery rates were the following: Na, K, Ma, Ca and Fe in the range 104%–115%; Al in 105%, As and Cu in 109%, Fe, V, Cr, Mn, Co and Se in 107%, Ni and Zn in 110%, Mo in 100%, Cd in 96%, Ba in 94%, Ag and Sb in 87%, Tl, Pb, Th and U in 75%. The precision of the measurements, expressed in relative standard deviation, were found in the range from less than 1% to 5%.
The content of chlorides was determined by the titrimetric method with silver nitrate, the content of bicarbonate ions was determined titrimetrically using sodium tetraborate, and sulfates were measured turbidimetrically. The pH values were measured by the pH meter, and electrical conductivity was measured by a conductivity meter.
2.3 Statistical methods
Statistical methods for analysis of data on main ions and trace elements content in snow, groundwater and fresh water were applied; mean content, standard error as well as variability were calculated. Coefficients of correlation between main ions and trace elements content were calculated.
To assess the importance of the contribution of dust of crustal origin and others sources, including anthropogenic, to the accumulation of major and trace elements in the snow, groundwater and lakes crustal enrichment factors (EFc) were calculated. Only the data for 2020 have been taken into account. EFc are defined as the ratio of the concentrations of a given element to the concentration of reference element normalized to the same concentration ratio characteristic of the upper continental crust (UCC). The average element concentrations in UCC have been taken from Rudnick and Gao (2003). Mn has been chosen because it is a good indicator of crustal dust (Planchon et al. 2002; Grotti et al., 2011) and it was used in Thamban and Thakur (2013) for EFc assessment for Larsemann Hills. As in the above mentioned works, in case of EFc values were less than 10, crustal dust as a primary source for elements was considered.
3 Results and discussion
3.1 Content and variability of major and trace elements in different types of water
According to the results obtained, Na dominates in all types of natural waters of Broknes Peninsula (Table 1). In snow and groundwater, which are sources of lake nutrition, the arrangement of major elements in descending order is similar: Na>Mg>K>Ca. The measured values of Na in samples of old snow are in the range 0.50–15.45 mg∙L−1, although in most cases its content does not exceed 4 mg∙L−1. The content of Mg, K and Ca varies within 0.02–1.77, 0.07–0.98 and 0.01–0.70 mg∙L−1, respectively with almost the same average values. Among trace elements, Zn (mean value is 33.08 µg∙L−1) and Al (13.2 µg∙L−1) are dominated, followed by Mn (1.99 µg∙L−1) and Ba (1.87 µg∙L−1). The content of Ni and Ag is below the detection limit value. The coefficients of variation of elements in surface snow, with the exception of Zn, As, Cd, exceed 100%. The highest values (334%, 251% and 216%) are specific for Sb, Co and Mn, respectively. The mean value of electrical conductivity in snow waters is 11.0 µS∙cm−1and the range is 2.2– 29.8 µS∙cm−1. In most cases, snow waters are slightly acidic: the average pH value is 5.86. The mean contents of chlorides, sulfates and bicarbonates are 3.28, 0.4 and 1.27 mg∙L−1, respectively.
In the newly fallen snow, the content of Na varies from 5.1 to 59.6 mg∙L−1(mean value is 27.7 mg∙L−1), Mg ranges from 0.22 to 6.71 mg∙L−1(2.94 mg∙L−1), K ranges from 0.84 to 2.8 mg∙L−1(2.10 mg∙L−1), Ca ranges from 0.56 to 1.75 mg∙L−1(1.11 mg∙L−1). Fe (60 μg∙L−1), Zn (43.6 μg∙L−1) and Al (18.7 μg∙L−1) predominate among trace elements. The content of Ag and Cr is below the detection limit. It has been established that the coefficients of variation for the most elements for newly fallen snow are much lower than 100%. Sb and Ba are the exceptions with values of 221% and 194%, respectively.
Groundwater is characterized by a high content of Fe (average is 570 µg∙L−1with a range from 35 to 3655 µg∙L−1) and Al (average is 546 µg∙L−1, range from 15.3 to 3567 µg∙L−1), as well as an elevated content of other trace elements: Mn (average is 15.14 μg∙L−1), Ni (2.65 μg∙L−1), V (1.53 μg∙L−1) and Cr (average is 1.43 µg∙L−1). Coefficients of variation for these elements are high (more than 150%). On the contrary, the coefficients of variation for major elements in groundwater are quite low and estimated at 54%–57%. The content of Na varies from 19.5 to 139 mg∙L−1(average is 73.7 mg∙L−1), Mg varies from 1.42 to 13.6 mg∙L−1(7.64 mg∙L−1), K varies from 1.05 to 6.72 mg∙L−1(3.73 mg∙L−1) and Ca varies from 0.39 to 4.32 mg∙L−1(average is 2.48 mg∙L−1). The value of electrical conductivity in groundwater is 436 µS∙cm−1(range is 199–778 µS∙cm−1). According to the content of hydrogen ions, waters are classified as slightly acidic (average pH is 5.74, range is 5.49–6.17). Chlorides are dominated among the major anions (mean content is 124.9 mg∙L−1), sulfates are at the second place (mean value is 18.9 mg∙L−1).
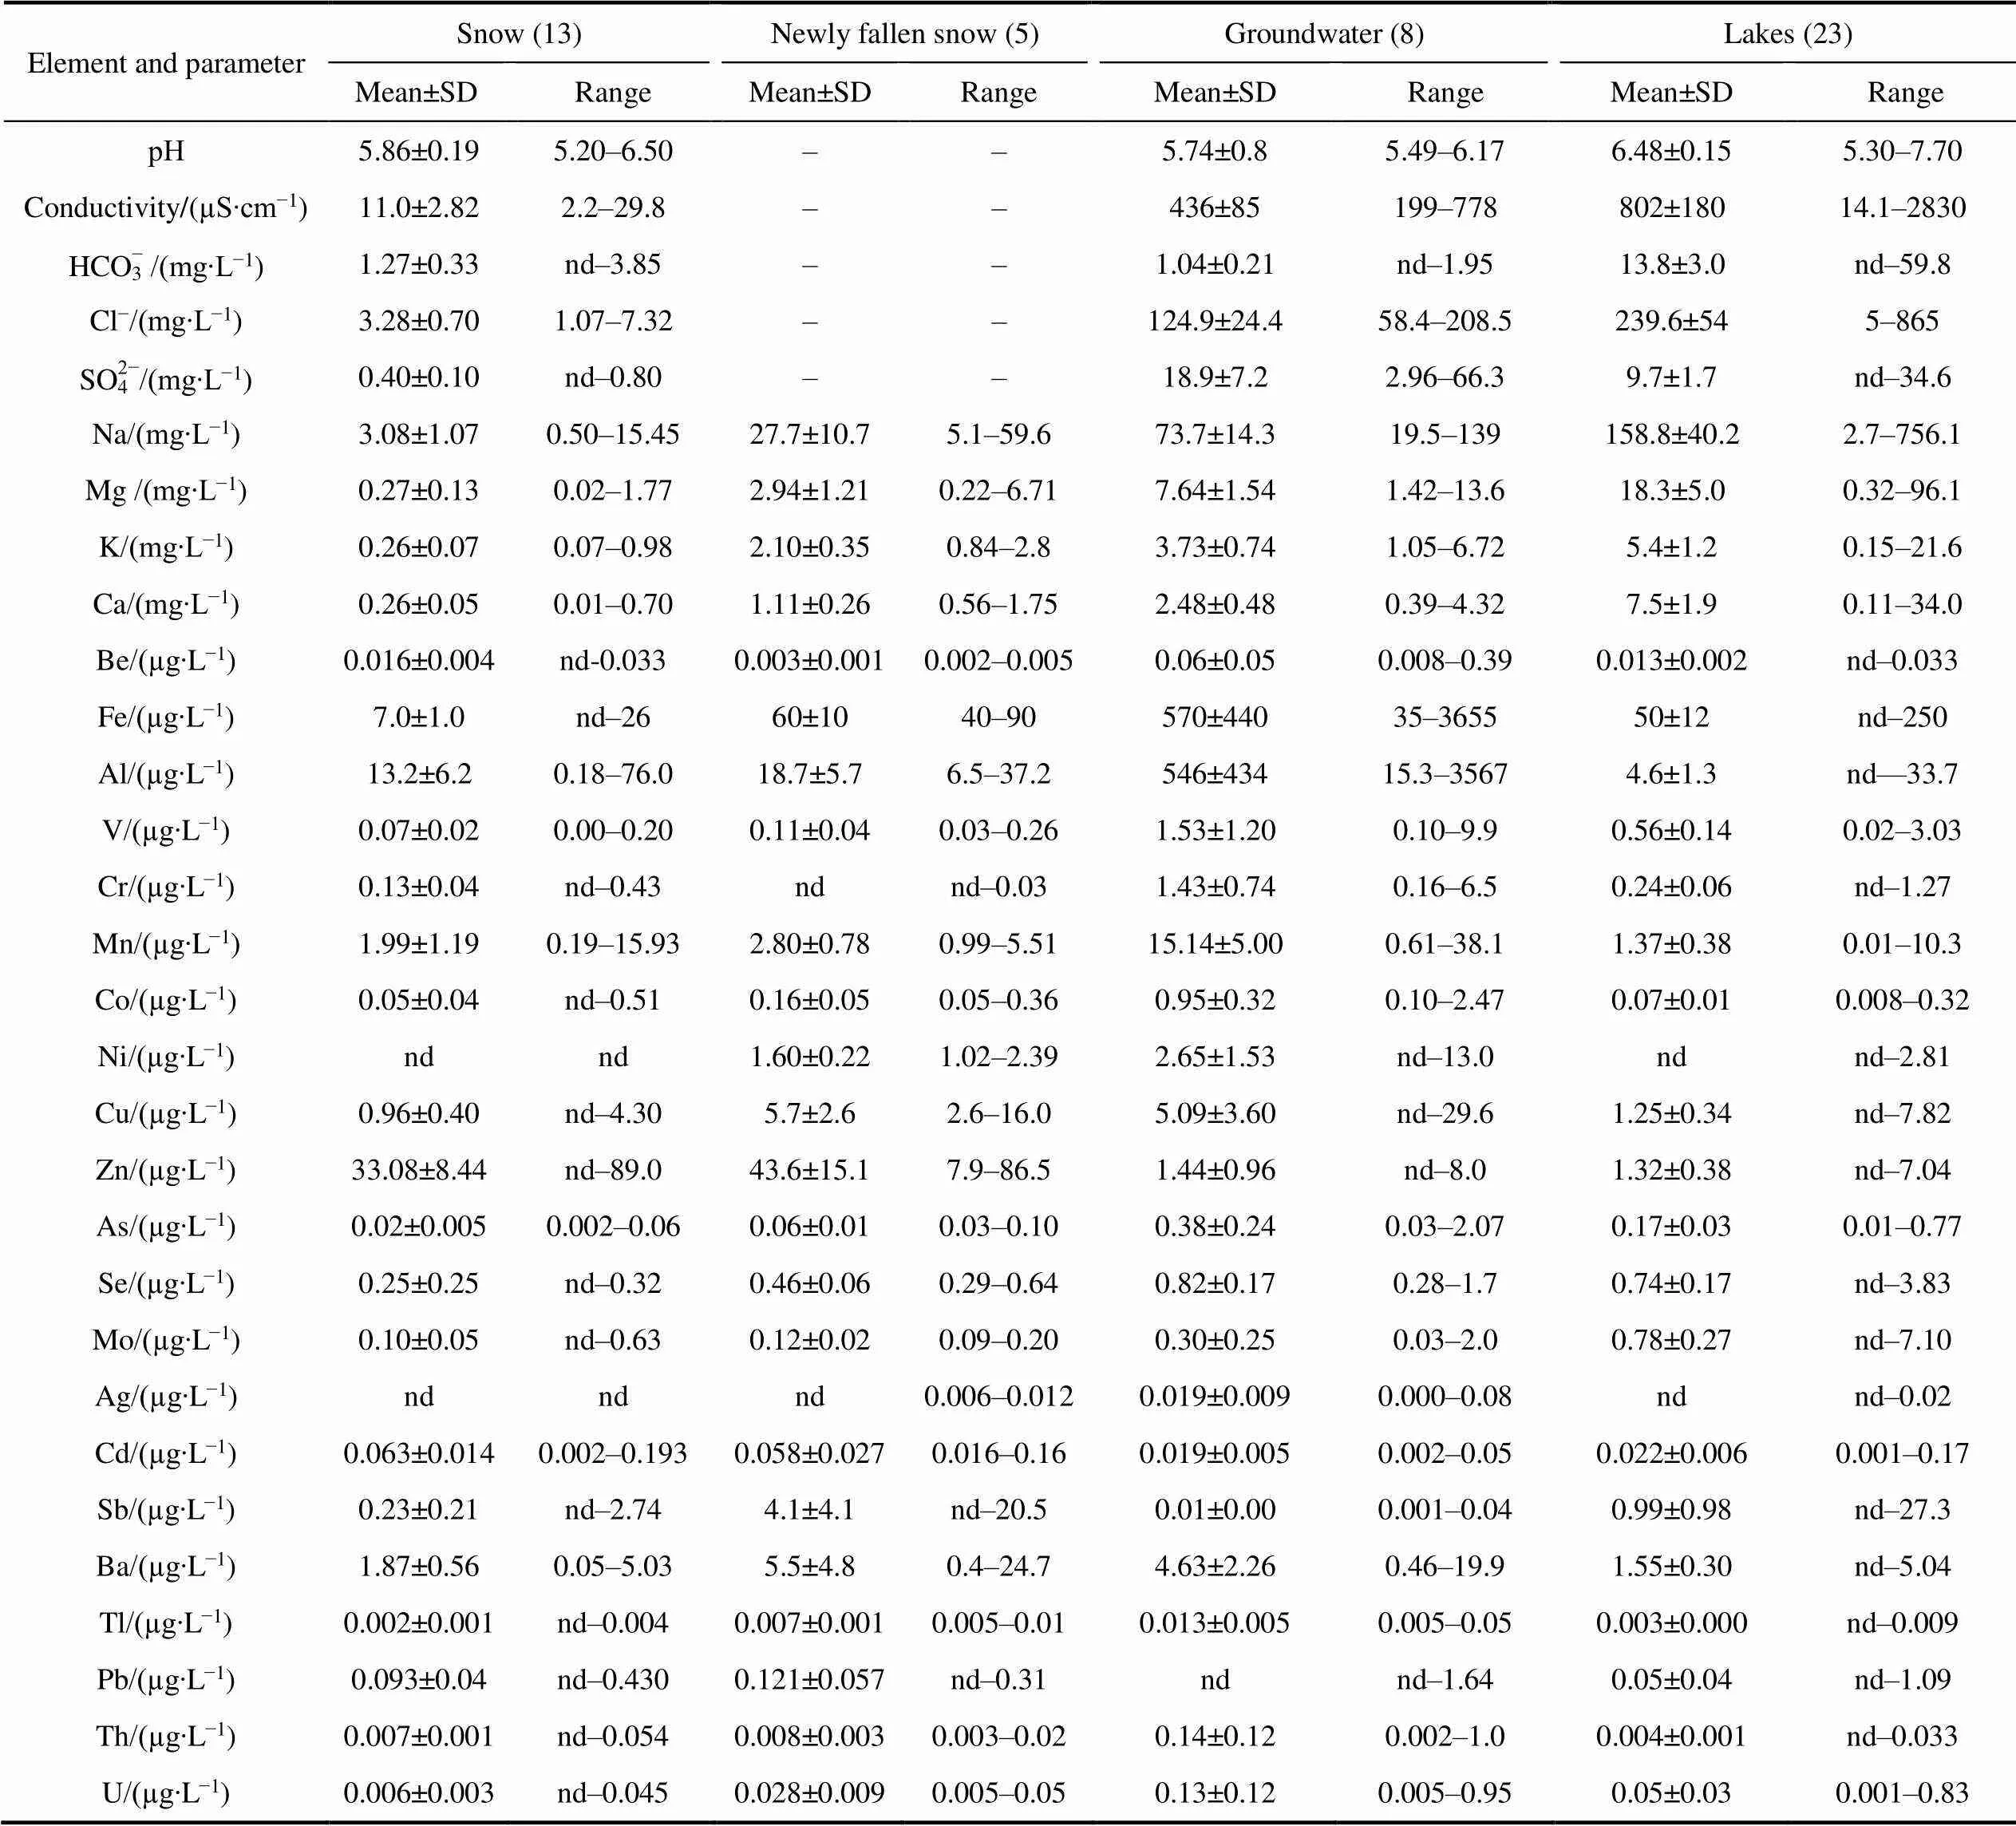
Table 1 The content of major ions and trace elements in natural waters from Broknes Peninsula, Larsemann Hills
Notes: The number of samples in brackets; “nd” means below the detection limit; “–”means not measured.
The widest range of major ions and trace element content was found in the lake waters of the peninsula, which confirms the previously obtained data on their diversity (Gillieson et al., 1990; Gasparon and Burgess, 2000). For example, Na content varies from 2.7 to 756.1 mg∙L−1, Mg varies from 0.32 to 96.1 mg∙L−1, Ca varies from 0.11 to 34.0 mg∙L−1, K varies from 0.15 to 21.6 mg∙L−1, Fe varies from below the detection limit to 250 µg∙L−1, Al varies from below detection limit to 33.7 µg∙L−1. The ranked major elements for all lakes are as follows: Na>Mg>Ca>K. In terms of pH, all examined lakes within Broknes Peninsula can be considered slightly acidic to neutral and slightly alkalinity (pH varies from 5.30 to 7.70). The value of electrical conductivity varies significantly: from 14.1 to 2830 µS∙cm−1. The content of major anions in lake waters is also very different: chlorides from 5 to 865 mg∙L−1, sulfates varies from below the detection limit to 34.6 mg∙L−1and bicarbonates varies from below the detection limit to 59.8 mg∙L−1.
3.2 Similarities of different types of water
Our data have shown that various types of natural waters, including groundwater, within the Broknes Peninsula are sodium chloride (Figure 4), that confirm the influence of marine environment on precipitation and terrestrial water in the region. This is in a good agreement with data of Thamban et al. (2010) and Budhavant et al. (2014) for snow, and Gillieson et al. (1990), Gasparon et al. (2002) and Nuruzzama et al. (2021) for surface water.
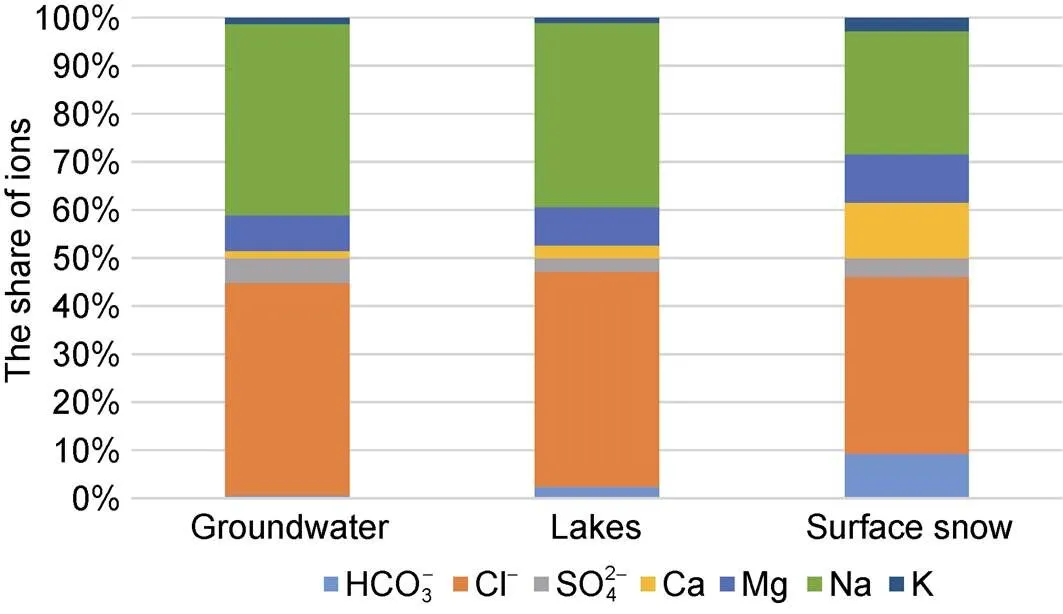
Figure 4 Chemical composition of different types of natural water at Broknes Peninsula.
The share of chloride ions in lakes varies from 79.3% to 98.4% (mean value is 92.3%), and the share of sodium ions in lakes varies from 56% to 90% (mean value is 78%). Elevated share of Mg (up to 32%) has been measured only in one case (Scandtett Lake); its average share is assessed in 16%. The input of other ions (bicarbonates, sulphates, calcium and potassium) is insignificant.
The similar composition is characteristic for groundwater: the share of chloride ions varies in the range 80%–97.5% (mean value is 88%), and sodium cations varies in the range 75.5%–87.9% (mean value is 80%).
In snow waters, with the dominance of sodium and chlorine ions, in some cases, the contribution of bicarbonate ions, magnesium and calcium ions is increased.
Close relationships between the content of major ions are also confirmed as the similar factors in chemical composition formation of different types of water on Broknes Peninsula. So, the coefficients of correlation () between Na and Mg equal 0.98 for snow and lake, and 0.80 for groundwater (Table 2). The high value ofis also characteristic for the relationships of Na-K in lake (0.98) and groundwater (0.91).
Strong connection between Cl−and Na, Cl−and Mg in snow, groundwater and lakes indicate the dissolution of NaCl and MgCl2derived with precipitation from the Ocean. Close correlation was also observed between SO42−and Na, and HCO3−and K in lake water, probably resulting from dissolution of sulphate and silicate minerals. Earlier it was shown, that the most abundant salt on northern and eastern Broknes and Mirror Peninsula is halite (NaCl), with subordinate thenardite (Na2SO4), identified as being of marine origin (Kiernan et al., 2009).
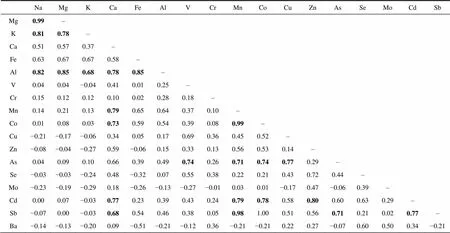
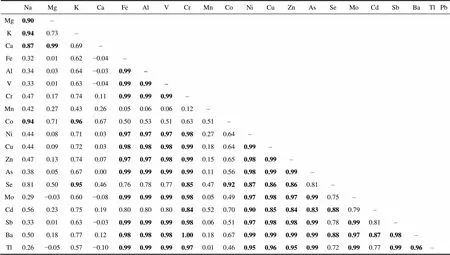
Correlation coefficients between the major and trace elements in snow, groundwater and lake water are presented in Tables S1–S3. According to the results, in snow waters, Al strongly correlates with all major elements and Fe (=0.68–0.85) (Tables S1). In surface waters, V, Se and Co correlate with almost all major elements (=0.54–0.76). A close relationship between Mn and Co is characteristic for snow waters (=0.99) and lake waters (=0.80). At the same time, while Zn content in snow waters correlates with Cd content (=0.80), such relationship is not found in other types of waters. In surface waters, the content of Cd correlates with the content of Cu (=0.76) and Mo (=0.98). The different correlations between elements can be caused their different sources including marine aerosols (Masuda et al., 1982), rocks and sediments, biogeochemical processes, human activities etc.

Table 2 Correlation coefficients (r) between anions and cations in the snow, groundwater and lakes on Broknes Peninsula
Note: Bold value means correlation significant at=0.01 level
As it is given in Table 3, the average Cl–/Na ratio in snow (2.3), groundwater (1.6) and lakes waters (1.6) are close to the seawater ratio (1.8), and indicate that the geochemistry of atmospheric deposition and terrestrial waters in Broknes Peninsula is affected by the marine environment like other coastal oasis in Antarctica (Borghini and Bargagli, 2004). The values Cl–/Na in some lakes are lower in comparison with sea water (Table S4), that may be caused by additional input of soluble Na from rocks and sediments. The average values of ratio Mg/Na in snow, groundwater and lakes (0.3, 0.10 and 0.13, respectively) are also close to the ratio for seawater (0.12). The values of K/Na and Ca/Na in snow (0.2 and 0.7) much higher than those in seawater (0.04). The higher ratios indicate that K and Ca are enriched due to weathering processes within ice-free area in the region. Ornithogenic factor, which is considered as a very significant factor of soil formation in coastal Antarctic (Abakumov et al., 2021can contributes additional amount of potassium and calcium into snow. In opposite, the ratios K/Na and Ca/Na for groundwater (0.05 and 0.03) and lake waters (0.05 and 0.07) are very similar with seawater (0.04 for both K/Na and Ca/Na).
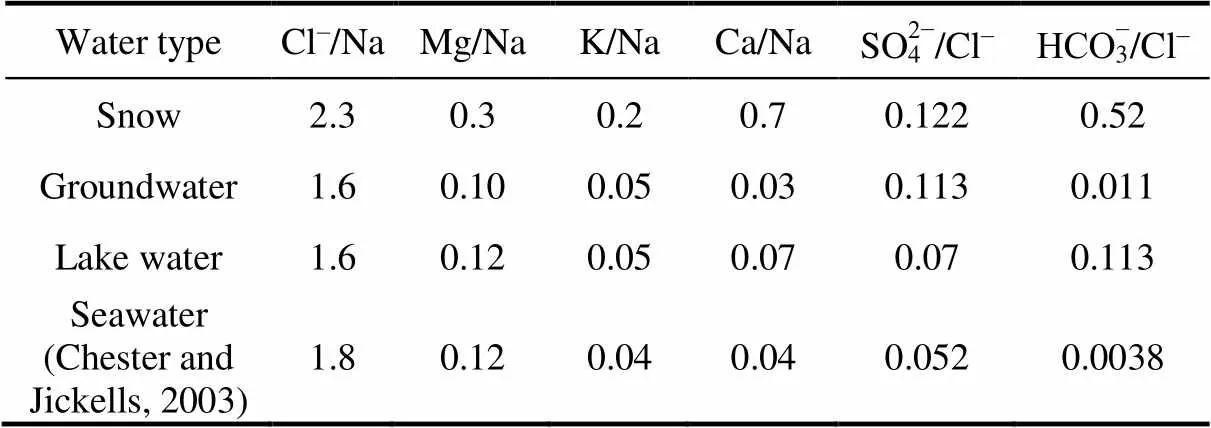
Table 3 Ratios of components for different types of water of Broknes Peninsula, Larsemann Hills
In regards to others ratio, the values of SO42−/Cl−(especially in snow and groundwater) and НСО3−/Cl−in all types of water are higher than ratio in sea water. It means that other sources such as weathering in the catchment areas can contribute into total concentrations of bicarbonates and sulphates.
3.3 Differences of old and newly fallen snow
The composition of snow waters (atmospheric precipitates) being the main source of nutrition for lakes (including through perennial snowfields and glaciers) varies within smallest range. The content of major and trace elements in surface snow samples are the lowest.
The results showed that the content of Mg, Na and K in newly fallen snow is in 8–11 times higher than in old snow. Content of Ca differ in 4.3 times, Fe in 9.5 times. There are also elevated concentrations of some trace elements in fresh snow in comparison with old one: Cu (in 5.9 times), U (in 4.6 times), Ba (in 2.9 times), As (in 3 times), Co (in 2.8 times), V (in 1.6 times). Mean contents of other elements are similar. The maximum concentrations of Na, Mg, K, Ca, Fe, Cu, Sb and Ba have been revealed in the newly fallen snow, whereas Al, Cr, Mn, Co and Mo in old snow.
Considering differences, we should take into account the time of newly snow fallout and sampling. It was a summer, when prevailing easterly winds bring marine aerosols and salts from the open water surface. As indicated in Kiernan et al. (2009), the upwind (eastern) shorelines of Broknes Peninsula are very affected by marine aerosols. Snowfall in winter could be less enriched by see salts because of ice–covered see surface around the Broknes Peninsula. Moreover, a significant number of islands in the northern part can be considered as a natural barrier for enrichment of atmospheric precipitates by see salt aerosols in the winter period.
Elevated content of some chemical elements in fresh snow in comparison with old snow was measured at the Ross Sea region in 2011–2012 (Tuohy et al., 2015) as well as on Dismal and Horseshoe Islands, Marguerite Bay, Antarctic Peninsula in 2020 (Kakareka et al., 2022). At the same time, an extremely large variability of sea-salt content in atmospheric precipitation at Antarctic coastal areas over all seasons should be taken into account (Wagenbach et al., 1998). For example, two peaks of chemicals content in atmospheric precipitation (in the summer and in the winter) have been registered on Roosevelt Island, that are most likely related to the absence of katabatic air flow in the summer (combined with increased summer dust loading in the atmosphere) and to higher snow accumulation in the winter (Tuohy et al., 2015). As shown in Wagenbach et al. (1998), Tuohy et al. (2015), and Thakur (2019), wide variabilities of chemical composition of precipitation are influenced by atmospheric processes, wind direction, aerosols size, enrichment of aerosols with sea salts during strong winds, and other factors.
The chemical composition of surface snow is also caused by many factors including snow redistribution and post-depositional processes, evaporation, leaching of easily soluble salts, atmospheric dry deposition as well as emissions of crustal dust from free-ice area. These processes can lead to smoothing peaks in the content of major and trace elements in snow. The obtained results for surface snow on Broknes Peninsula are close with the data for Larsemann transect (Thamban et al., 2010; Thamban and Thakur, 2013), although the comparison is complicated because of different sampling area.
Newly fallen snow can be a source of additional input of chemical elements in the environment in the summer, but its amount is negligible. According to the Progress Station measurement data, the annual precipitates in Larsemann Hills amounts 158 mm; they fall mainly in the form of snow during the warm season (statistics were taken from the Russian Arctic and Antarctic Research Institute, http://www. aari.aq). The average long-term monthly precipitation varies from 5.9 mm (January) to 18.3 mm (May); in March– September, the average monthly snowfall is 15.9 mm.
It can be assumed that redistribution of snow occurs mainly during the period of snowfall with its accumulation in the wind shadow, including lake basins. Thus, the redistribution of snow contributes to the formation of perennial snowfields and an increase in the period of snow melting and, accordingly, the flow of low-mineralized melt water into lakes. On the other hand, the snow-free soil surface warms up faster, and part of the surface runoff is transferred to the underground, the chemical composition of which is determined by the properties of the loose rocks that it drains.
3.4 Differences of groundwater and snow
Content of major ions and trace elements in groundwater is significantly higher compared to snow waters: Na, Mg, K, Ca, Al, V, Co, As on average 10– 25 times, Fe, Mn, Cu, Mo and Ba on average 3–9 times. This may indicates the different leaching of chemicals from rocks. In fact, the formation of groundwater flow occurs during the melting of snowfields and snow-ice and the infiltration of meltwater into the soil. The variability of groundwater composition depends on the composition of soils, the depth of the drained layer, the length of the slope, the presence of vegetation and other factors. Distinctive features of groundwater are the most highest content of Fe, Al and other elements of the crustal origin.
3.5 Spatial heterogeneity of groundwater
Studies have shown that the content of major ions and trace elements in groundwater varies significantly even within one geochemical profile. The maximum content of mostly elements has been revealed in the samples collected around 120 m from the profile start (Figure 5). It means that the longer meltwater flow path, the more time the meltwater interacts with rocks and mineral substrates. Increase of the content of chemicals in subsurface meltwater can be caused not only by distance, but also the depth, where groundwater contacted with soil (40 cm). Decrease in the content of chemical elements was noted near the lake, probably due to dilution processes of melt water from nearby snowfields.

Figure 5 The change of ratio of the content of major and some trace elements in groundwater to the content in Lake Scandrett along the geochemical profile at Broknes Peninsula.
The limited number of groundwater samples and the small study area on the Broknes Peninsula does not allow to make full description of their diversity. It can be assumed that the content of trace elements will varies more significantly with changes in geochemical conditions, especially the reaction of the environment, which determines the mobility of elements and the possibility of their leaching. Intensity of weathering depends on geomorphological features of peninsula, physical and chemical properties of soils that vary greatly (Mergelov, 2014; Kukharchyk et al., 2022). According to Carson and Grew (2007), the bedrock of Larsemann Hills is represented by a layered complex of cordierite, gneiss and paragneiss. Granitic nature of the rocks rich in Fe and Al and prevalent acidic soils with variations from strongly acidic to slightly acidic (Kukharchyk et al., 2022) may provide intensive leaching of Al and other elements. By the data of Kanamaru et al. (2018), the weathering of granitic rocks in a hyper-arid and hypothermal environment is controlled mainly by oxidation. Generally, the chemistry of groundwater on the Broknes Peninsula may be affected by features of soil and loose sediments, their salinity, as well as the presence of lacustrine–lagoon deposits in some cases that was indicated by Kierman et al. (2009) and Demidov et al. (2013). Infiltration of sewage water in the area of human activities can also influence on groundwater, especially on nitrogen and phosphorus content (Kaup and Burgess, 2002).
Differences in the content of major and trace elements in groundwater between two valleys (Table S5) were revealed. The content of Na, Mg, K, Ca and Se in the groundwater of the Valley II in comparison with Valley I is lower in 1.5–2.0 times, Ba, As, Cr, Co, Sb, Ni content is lower in 3.0–5.8 times, and Fe, Al, V, Cu and Mo in 11– 22 times. There are practically no differences in the content of Mn.
Our results, in spite of short length of investigated valleys, are consistent with data presented by Lyons et al. (2005), Welch et al. (2010) and Kim et al. (2020) regarding the effect of the length of the watercourse on the content of chemical, as well as the distance that the underground flow fluxes. We have been not taken into account the time factor, but it can effects, since the groundwater level and, accordingly, the depth of the drained layer, as well as the intensity of the flow, change by the end of summer.
3.6 Spatial differences in the content of chemical elements in lakes
Up to now, there are a lot of data confirmed spatial variations of major ions and trace elements content in lakes within different costal oases of Antarctica: McMurdo Dry Valleys and Syowa Oasis(Torii et al., 1988; Matsumoto et al., 1992), Terra Nova Bay (Borghini and Bargagli, 2004;Abollino et al., 2012; Zelano et al., 2017), Vestfold Hills (Torii et al., 1988; Quesada et al., 2006; Verleyen et al., 2012), Bunger Hill (Klokov et al., 1990), Schirmacher Oasis (Kumar et al., 2002; Asthana et al., 2019), etc. There are lakes from freshwater to saline in these oases.
Our data for Larsemann Hills are consistent with those previously obtained by Gillieson et al. (1990), Ellis-Evans et al. (1998), Gasparon andBurgess (2000), Gasparon et al. (2002), Sabbe et al. (2004), Asthana et al. (2013, 2019), Nuruzzama et al. (2021) and demonstrate also large variations in chemicals content even in nearby lakes (Table 1).
To show spatial differences and to minimize the influence of sampling time on the content of chemical elements in lakes, data obtained from sampling in the middle of austral summer–January 2020 have been compared. According to the results, the content of bicarbonates and sulfates between lakes differ in hundred and dozens times and other major ions differ in dozens (Figure 6a). The greatest differences among the trace elements were found in regard to Al (88 times), Ba (36 times), V (34 times) and minimal difference (3–4 times) was observed in Tl and Th (Figure 6b). The content of other trace elements (Cr, As, Mo, U, Co, Se and Cd) varies in the range 8–20 times.

Figure 6 Range and average content of major ions (a) and trace elements (b) in lakes of Broknes Peninsula in January 2020.
The differences of major ions and trace elements content in lakes within Broknes Peninsula can be explained by different location of lakes in relation to shore. It should be stressed that the content of major and trace elements in sea water, especially near glacier confluences or the breaking off of icebergs like Dalk Glacier, is subject to variability and dilution. According to Krogulec et al. (2018), the content of iron in seawater near King George Island varies from 9 to 171 μg∙L−1, aluminum content varies from values below the detection limit to 306 μg∙L−1.
Besides, the weathering process is important for the addition of chlorides, bicarbonates, and sulfates into lakes (Asthana et al., 2013). By the data of Nuruzzama et al. (2020), chemical weathering of the exposed rocks in the catchments contributes about 20% of the total dissolved solutes to the Larsemann Hills lakes. Different intensity of chemical weathering within watersheds of lakes of Larsemann Hills was indicated by the content of reactive silicate in the range from 18.1 in Progress Lake to 153.8 µg∙L−1in Sarah Tarn Lake (Ellis-Evans et al., 1998). Further, biogeochemical processes are also known to influence the distribution of major ions, trace elements and nutrients compositions of the lakes (Verleyen et al., 2012).
The lowest concentrations of major ions and trace elements are found in Boulder Lake, and they are similar to the lowest values in snow. The lake is the farthest from the sea shore (more than 2500 m) and its catchment is represented by ice sheet. This reflects the general geographical patterns of changes in the chemical composition of freshwater lakes of Antarctica with the distance from the coast (Fedorova, 2003; Bertler et al., 2005). By the data in Boronina et al. (2021), the ice thickness in the lake varied from 2 to 18.5 m with an average value of 6 m and open water was represented by the supraglacial layer of melt water.
Lakes Progress, Sibthorpe, Scandrett and Discussion, which contain low amount of major ions belong to oligotrophic lakes. All these lakes are flowing with significant impact of snow and glacial melted waters on their chemical composition. But in spite of similarities there are some differences in the content of trace elements. For example, maximum content of Zn (3.36 µg∙L−1), Mn (1.62 µg∙L−1) and Cu (0.96 µg∙L−1) has been revealed in Sibthorpe Lake that can be caused by the shallow lake depth (mean value is 0.8 m and maximum is 3.5 m), its rapid warming up and development of the biochemical processes during the summer. The highest concentration of Al (33.7 µg∙L−1) and Ni (2.81 µg∙L−1) was recorded at Lake Scandrett that may be due to the largest catchment area (259 ha), its location in a long wet valley and input of groundwater into the lake. As it was shown above, groundwater is enriched by Al (mean value is 850.9 µg∙L−1; Table S5) and other elements of crustal origin. Elevated content of Fe (64 µg∙L−1) and Mo (0.36 µg∙L−1) as well as sulphate anions (9.96 mg∙L−1) is characteristic for Discussion Lake. It is probably connected with features of geochemical processes within large catchment area (about 75 hm2).
The maximum content of major elements in 2014 and 2020 was typical for the endorheic small lakes Sarah Tarn, Reid and Stepped (Heart Lake) that is an agreement with the data provided by Gillieson et al. (1990), Ellis-Evans et al. (1998) and Gasparon et al. (2002). In 2020 there are also the highest content of Fe (102–207 µg∙L−1) and Cr (0.52–0.65 µg∙L−1) and V (0.23–1.83 µg∙L−1) in these lakes. The smallest lake area (about 1 hm2) in 2014 is characteristic for Sarah Tarn; the area of surface water for Reid and Stepped lakes is about 5 hm2. According to Kuznetsova et al. (2021), the share of snowfields in the catchment area of Lake Sarah Tarn accounts for only 3% of the total area, and that in the catchment area of Lake Reid for 12% of the total area. This means that a significant part of the melt runoff in the summer is transferred to subsurface meltwater. Small catchment areas (5.7 hm2for Sarah Tarn and 19.6 hm2for Reid) promote rapid snow melting in early summer leading to a negative water balance (Ellis-Evans et al., 1998). In addition, contributions of evaporation processes are important in the formation of the hydrochemical regime of these lakes. As it was indicated in Shevnina et al. (2021), for the endorheic land-locked lakes, the evaporation over the surface area is the main loss component of the water balance equation. Hodgson et al. (2005) emphasized, that the high salinity of Lake Reid, located at an altitude 30 m a.s.l. and having an age of more than 100 thousand years, is due to a long history of evaporation and the addition of salts by sea spray. A similar situation is characteristic for Sarah Tarn Lake, the salts content of which is even higher. As it was shown for the northern part of Victoria Land (Borghini and Bargagli, 2004), namely evaporation processes influence to changes in chemical elements in the lakes.
In regard to the chemical composition of the Stepped Lake located in the northeastern part of the peninsula, there is a significant impact by the proximity of the sea. Besides, the influence of human activities should be taken into account near the stations (Kaup and Burgess, 2002; Goldsworthy et al., 2003; Nigamatzyanova and Fedorova, 2015).
3.7 Temporal differences in the content of chemical elements in lakes
Sampling in 2014 and 2020 has shown that there are also significant interannual variability of chemicals in some lakes (Table S4). The content of a number of elements (Na, Mg, Ca, K, Al, Se) is different from 7 to 10 times, Mn and Cr about 3 times. The content of Fe varies in dozens times. At the same time, the chemical composition of lake waters remains almost unchanged (Figure S1). The sodium chloride composition of lake waters indicates the constancy of the dominant source of the main ions. The most evident reasons for variability of major ions content are sea input via aerosols and sea spray. Wind direction and its speed are very important.
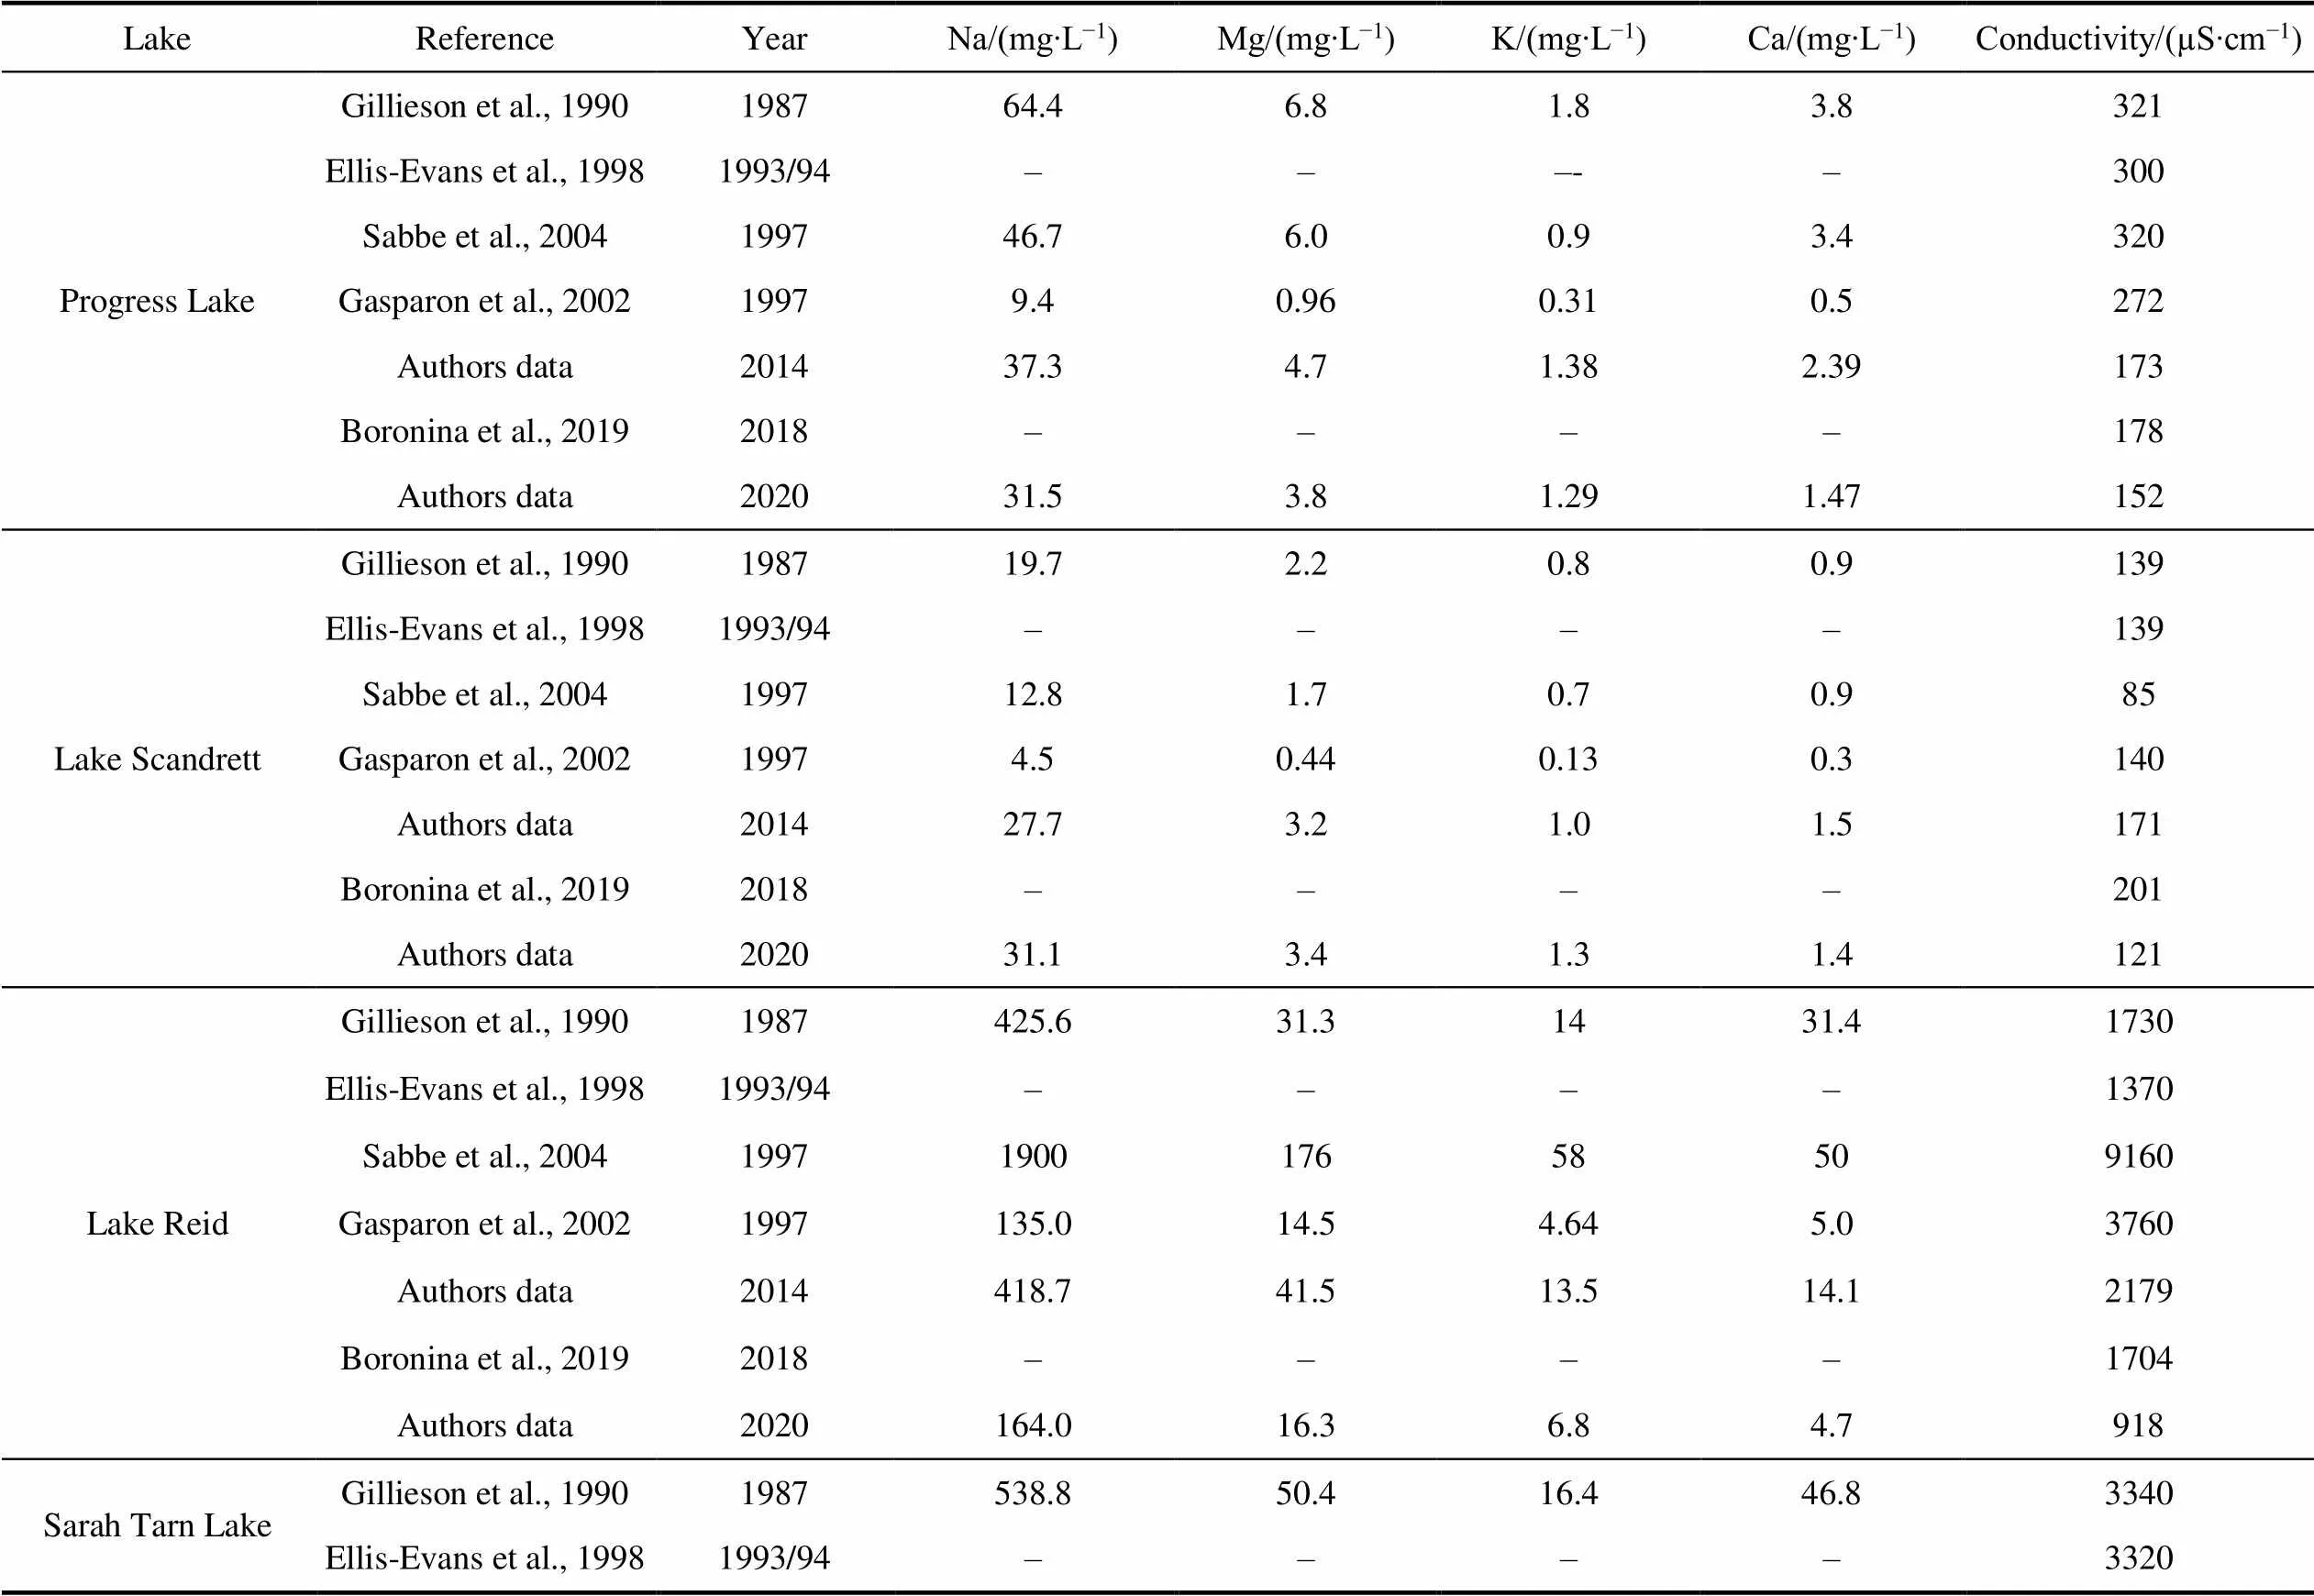
More significant temporal differences have been revealed since 1987 and provided in several publications (Gillieson et al., 1990; Ellis-Evans et al., 1998; Gasparon et al., 2002; Sabbe et al., 2004; Boronina et al., 2019).Comparison of the content of major elements and electrical conductivity in the lakes of Broknes Peninsula for the whole period of investigation is given in Table S6. Figure 7 illustrates the range of electrical conductivity as integral parameter of soluble chemicals in lakes, and Na content as dominated ion.
The most pronounced variability is for Sarah Tarn Lake: the differences in Na content and conductivity of water make up dozens time (82 and 58, respectively). And other major elements show a similar pattern. Variabilities of major elements and conductivity for the Lake Reid are in the range 10–14. Generally, the variability of Na content decreases in the series Sarah Tarn>Reid>Discussion> Sibthorpe>Scandrett=Progress>Stepped>Boulder. A similar ranking of lakes is also typical when other main elements are considered.
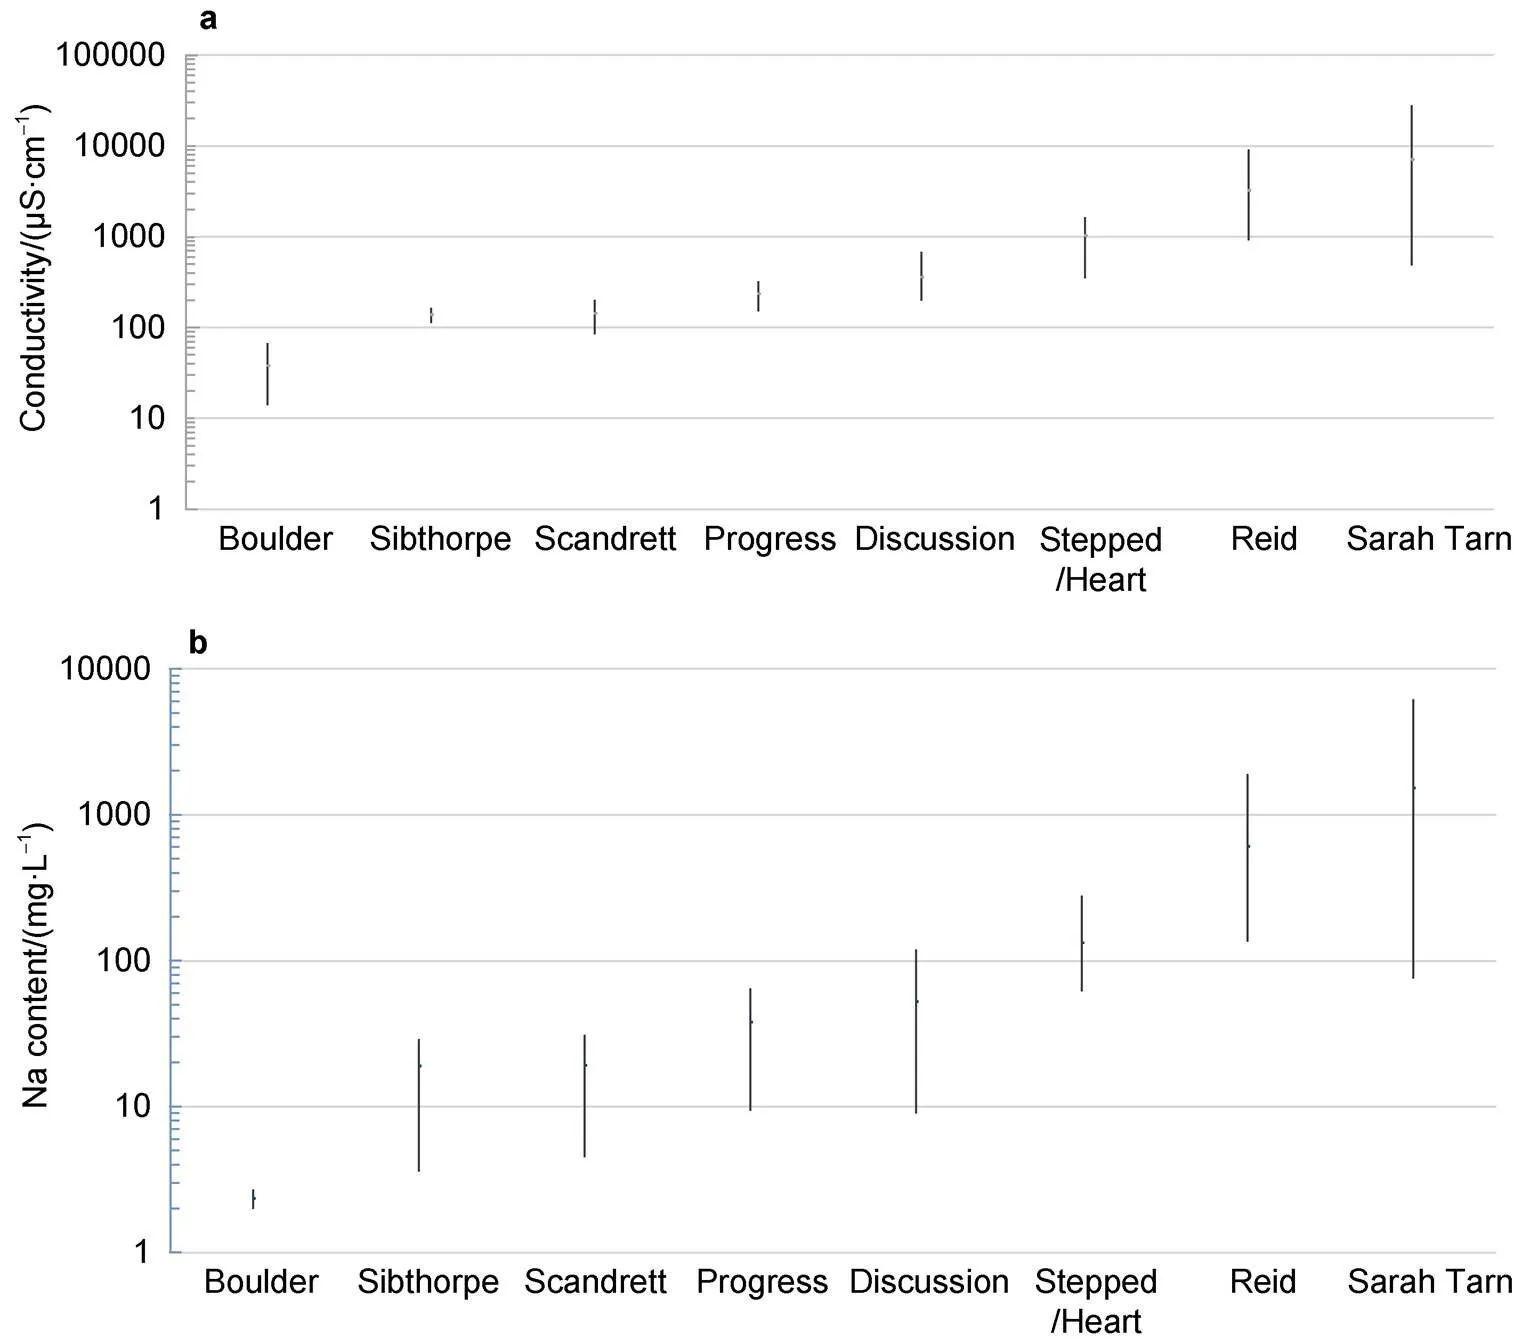
Figure 7 Range of electrical conductivity (a) and Na content (b) in lakes of Broknes Peninsuls for the 1987–2020.
Considering the data of investigation since the end of 1990s we can indicate that there are no clear trends in the content of major elements (Table S6). It may be caused by different reason. For example, the values measured by Gasparon et al. (2002) were lower than values received by Gillieson et al (1990). The differences may be deal with the different sampling and analytical techniques as indicated in Gasparon et al (2002). During expedition of ANARE in 1987 water samples have been analysed in laboratory, after the expedition, in 1996–1997–immediately in the field. The weather conditions were also different: during the summer months in 1987 most of the Larsemann Hills lakes thaw or partially thaw (Gillieson et al., 1990), during the 1997 sampling period the lakes were experiencing between 10% and 100% ice-cover (Gasparon et al., 2002). The results of expeditions have shown that seawater input (sea spray) is the main factor controlling the water composition, and variations of parameters depend largely on the exposure of the lake to the ocean and especially exposure towards the north-east wind direction which is the predominant for Broknes Peninsula.
The further results provided by Saabe et al. (2004) and Verleyen et al. (2012) have confirmed the large variability of major element content and conductivity in the lakes of Larsemann Hills. Water chemistry are influenced by season of sampling, climatic factors, weather patterns and others factors. For example, conductivity in Lake Reid before and after snow melting was 9160, 3760 µS∙cm−1, repectively, in Sarah Tarn Lake was 23870, 5520 µS∙cm−1correspondently (Saabe et al., 2004). According to Verleyen et al. (2012), the thawing of the lake-ice can increase or decrease in chemicals concentration in lake waters and specific conductance that depends on lake-ice and snow cover characteristics. In case of accumulation of marine aerosols in the snow and ice, thawing process can lead to more concentrated lake waters. Changes in major ion concentrations in lakes in northern Victoria Land have also been associated with the presence or absence of ice during sampling (Borghini and Bargagli, 2004). Dependencies of major elements content in lake waters on the distance from the coastline, depth of lakes and their area are demonstrated in the Figure 8.
It is evident that the depth and area are the main morphological factors influencing the content of chemicals in lake waters of Broknes Peninsula. Small volume of water in lakes Sarah Tarn and Reid is subject to rapid changes during snow/snowfield melting, and the changes will depend on the accumulated snow and the rate of snowmelt, as well as the temperature conditions that provided evaporation processes. The deepest and the largest lakes like Progress and Scandrett are more stable in relation to major elements content. Wherein Scandrett Lake, in spite of close location to the sea shore (Nella Fiord), is characteristic quite low variability of chemicals because its valley is oriented from south to north, and closed from the eastern winds. The changes of the most remote lakes, like Boulder, may be caused by climatic and weather factors.
Generally, in relation to spatial and temporal heterogeneity, it should be stressed, that in fact many geographical factors are overlapped (altitude, area of lake water and watershed, the share of ice and snowfield, the depth of lake and others).
3.8 Enrichment factors of different types of water
Considering the content of major and trace elements in different types of waters, we took into account that the newly fallen snow characterizes the current state of the incoming part of the hydrochemical balance of lakes, old snow–averaged over several weeks or months, groundwater– averaged transformed condition over a few weeks or austral summer season. The composition of lake waters characterizes their averaged state over several years (depending on the time of retention). Generally, the geochemistry of lake waters integrally reflects the cumulative effect produced by chemicals migration with inflow and outflow pathway, evaporation and biogeochemical processes. Besides, anthropogenic impact onto chemical composition of water in this region should not be excluded. The local contamination of soil and water as footprint of each station was revealed by Goldsworthy et al. (2003). According to Artamonova et al. (2019), an increased content of ammonium and organic forms of nitrogen and phosphorus indicates the influence of anthropogenic or bird activities.

Figure 8 Dependencies of major elements content in lake waters of Broknes Peninsula on the distance from sea shore (a), the depth of lakes (b) and area of lakes (c).
Figure 9 Mean crustal enrichment factors (EFc) of major and trace elements in snow (a) and groundwater (b) on Broknes Peninsula.
The results of EFc calculation have showed that snow is more enriched in Zn, Se, Mo, Cd and Sb (Figure 9a). These values are close to those received earlier by Thamban and Thakur (2013) and are probably associated with anthropogenic input. EFc for Na is in the range 10–100 that allow to suppose its marine origin. Some elements (Fe, Al, V, Co, As and Ba) with EFc <10 in the samples of surface snow are of terrigenous origin.
The obtained values related to the enrichment of groundwater with Na (>100) and Mg (10–100) may be explained by leaching of these elements from soil because of their high mobility. EFc for other elements are below 10, indicating their crustal genesis. The exceptions are Cu and Se, for which additional sources are likely available.
The highest values of EFc (>1000) and relatively high EFc (>100) in lakes are specific for Na and Mg in spite of different lakes salinity (Figure 10). It can be assumed that salts of marine origin are accumulating in lake waters despite ultra-oligotrophic atmospheric precipitates. These processes are characteristic especially for the endorheic small and shallow lakes. As known, lake salinitization is more evident for dry and cold oases of Antarctica like Vestfold or McMurdo Dry Valleys (Torii et al., 1975;Matsumoto, et al., 1992).
In some cases, EFc for Se, Mo, as well as for Cd and Sb are also high that may be caused by transboundary influence of anthropogenic sources. It should be noted that the list of highly enriched elements of probably anthropogenic origin is similar to snow (Thamban and Thakur, 2013). High EFc for some technophile elements in lakes in different regions have been established, for example for Cd, Co and Zn in Nepal (Paudyal et al., 2016); for Ag, As, Mo, Se, Ni, and Pb in European Russia and Western Siberia (Moiseenko et al., 2019).
4 Conclusion
The performed studies confirm the ultra-oligotrophic character of snow within Broknes Peninsula, which is the main sources of groundwater formation during austral summer and water supply of lakes. For the first time, the maximum content of Fe, Al and Mn in groundwater for this region and their spatial heterogeneity, especially in the content of trace elements, were revealed. The high variabilities in the content of the most trace elements in groundwater are associated with the spatial heterogeneity of geochemical processes on the peninsula. Large differences in the content of major and trace elements in water, accumulated in lakes, as well as inter annual variability have been confirmed.
Figure 10 Mean crustal enrichment factors (EFc) of major and trace elements in lake waters at Broknes Peninsula.
It seems that the Larsemann Hills oasis can be considered as important area for hydrochemical research, especially under conditions of increasing anthropogenic pressures and climate change. In addition to evaporation processes, it is necessary to take into account possible changes in the composition of groundwater with a change in their level and/or intensity of flows. As in other coastal oases, groundwater can be an important pathway for pollutants migration. The development of research in the Larsemann Hills should be directed, among other things, towards the harmonization of methodological approaches of sampling of various substrates, including snow and surface water.
The study was conducted in the framework of the State Programs “Monitoring of the polar regions of the Earth and ensuring the activities of the Arctic and Antarctic expeditions for 2011–2015” and “Monitoring of the polar regions of the Earth, the creation of the Belarusian Antarctic station and ensuring the activities of polar expeditions for 2016–2020”.
The authors are grateful to the leadership of the 7th and 12th Belarusian Antarctic Expedition and the 65th Russian Antarctic Expedition, as well as to the head of the Antarctic Progress Station D. A. Mamadaliev for assistance in conducting research and organizing storage and transportation of samples. The authors are grateful to M. A. Kudrevich and Yu. G. Kokosh for the water samples pretreatment. We also appreciate two anonymous reviewers and Associate Editor Dr. José Retamales for constructive comments that helped us improve the manuscript.
Abakumov E V, Parnikoza I Y, Zhianski M, et al. 2021. Ornithogenic factor of soil formation in Antarctica: a review. Eurasian Soil Sci, 54(4): 528-540, doi:10.1134/S1064229321040025.
Abollino O, Malandrino M, Zelano I, et al. 2012. Characterization of the element content in lacustrine ecosystems in Terra Nova Bay, Antarctica. Microchem J, 105: 142-151, doi:10.1016/j.microc.2012.05.017.
Artamonova K V, Dukhova L A, Lukyanova O N, et al. 2019. Monitoring the hydrochemical regime of lakes in East Antarctica over the past 10 years. Modern trends and prospects for the development of hydrometeorology in Russia. Irkutsk: Materials of the II All-Russian Scientific and Practical Conference, 97-106 (in Russian).
Asthana R, Shrivastava P K, Srivastava H B, et al. 2013. Hydrochemistry and sediment characteristics of polar periglacial lacustrine environments on Fisher Island and Broknes Peninsula, East Antarctica. Adv Polar Sci, 24(4): 281-295, doi:10.3724/sp.j.1085.2013.00281.
Asthana R, Shrivastava P K, Srivastava H B, et al. 2019. Role of lithology, weathering and precipitation on water chemistry of lakes from Larsemann Hills and Schirmacher Oasis of East Antarctica. Adv Polar Sci, 30(1): 35-51, doi: 10.13679/j.advps.2019.1.00035.
Bargagli R. 2008. Environmental contamination in Antarctic ecosystems. Sci Total Environ, 400(1-3): 212-226, doi:10.1016/j.scitotenv.2008.06.062.
Bertler N, Mayewski P A, Aristarain A, et al. 2005. Snow chemistry across Antarctica. Ann Glaciol, 41: 167-179, doi:10.3189/17275640578181 3320.
Bhardwaj L K, Jindal T. 2022. Evaluation of coliform and faecal coliform bacteria in the lakes of Broknes and Grovnes Peninsula, East Antarctica. Nat Env Poll Tech, 21(5(Suppl)): 2025-2034, doi:10.46488/nept.2022.v21i05.002.
Bhardwaj L K, Sharma S, Jindal T. 2023. Estimation of physico-chemical and heavy metals in the lakes of Grovnes & Broknes Peninsula, Larsemann Hill, East Antarctica. Chem Afr, 6(5): 2677-2694, doi:10. 1007/s42250-023-00668-6.
Bharti P K, Niyogi U K. 2015. Assessment of pollution in a freshwater lake at Fisher Island, Larsemann Hills over East Antarctica. Sci Int, 3(1): 25-30, doi:10.17311/sciintl.2015.25.30.
Bharti P K, Kaup E, Sharma B, et al. 2016. Occurrence of various ingredients in the lake environments at Stornes Peninsula, Ingrid Christenson Coast, East Antarctica. Amer J Environ Sci Tech, 1:1-10.
Borghini F, Bargagli R. 2004. Changes of major ion concentrations in melting snow and terrestrial waters from northern Victoria Land, Antarctica. Antarct Sci, 16(2): 107-115, doi:10.1017/s095410200400 197x.
Boronina A S, Popov S V, Pryakhina G V. 2019. Hydrological characteristics of lakes in the eastern part of the Broknes Peninsula, Larsemann Hills, East Antarctica. Ice and Snow, 59(1): 39-48, doi:10.15356/2076-6734-2019-1-39-48 (in Russian).
Boronina A, Popov S, Pryakhina G, et al. 2021. Formation of a large ice depression on Dålk Glacier (Larsemann Hills, East Antarctica) caused by the rapid drainage of an englacial cavity. J Glaciol, 67(266): 1121-1136, doi:10.1017/jog.2021.58.
Budhavant K B, Rao P S P, Safai P D. 2014. Chemical composition of snow-water and scavenging ratios over costal Antarctica.Aerosol Air Qual Res, 14(3): 666-676, doi:10.4209/aaqr.2013.03.0104.
Carson C J, Grew E S. 2007. Geology of the Larsemann Hills, Antarctica, First Edition(1: 25000 scale map). Canberra: Geoscience Australia.
Chester R, Jickells T. 2003. Marine geochemistry. Oxford: Blackwell Science, doi:10.1002/9781118349083.
Demidov N E, Verkulich S R, Zanina O V, et al. 2013. The end moraine and lacustrine-marine sediments in the crossection of quaternary deposits of the Larsemann Hills, East Antarctica.Arct Antarct Res, 97 (3): 79-90 (in Russian).
Dixon D A, Mayewski P A, Korotkikh E, et al. 2013. Variations in snow and firn chemistry along US ITASE traverses and the effect of surface glazing. Cryosphere, 7(2): 515-535, doi:10.5194/tc-7-515-2013.
Ellis-Evans J C, Laybourn-Parry J, Bayliss P R, et al. 1998. Physical, chemical and microbial community characteristics of lakes of the Larsemann Hills, Continental Antarctica. Archiv fur Hydrobiologie, 141(2): 209-230, doi:10.1127/archiv-hydrobiol/141/1998/209.
Fedorova I V. 2003. The current state and resistance to the effects of inland waters of Antarctica. Abstract for the candidate of geological sciences, St. Petersburg (in Russian).
Gasparon M, Burgess J S. 2000. Human impacts in Antarctica: trace-element geochemistry of freshwater lakes in the Larsemann Hills, East Antarctica. Environ Geol, 39(9): 963-976, doi:10.1007/s0025499 00010.
Gasparon M, Lanyon R, Burgess J S, et al. 2002. The freshwater lakes of the Larsemann Hills, East Antarctica: chemical characteristics of the water column. ANARE Research Report, 147: 1-28.
Gillieson D S, Burgess J, Spate A, et al. 1990. Atlas of the lakes of the Larsemann Hills, Princess Elizabeth Land, Antarctica. ANARE Research Notes, 74.
Goldsworthy P M, Canning E A, Riddle M J. 2003. Soil and water contamination in the Larsemann Hills, East Antarctica. Polar Rec, 39 (4): 319-337, doi:10.1017/s003224740300305x.
Grotti M, Soggia F, Ardini F, et al. 2011. Major and trace element partitioning between dissolved and particulate phases in Antarctic surface snow. J Environ Monit, 13(9): 2511-2520, doi:10.1039/c1em 10215j.
Hodgson D A. 2012. Antarctic Lakes//Bengtsson L, Herschy R W, Fairbridge RW (eds.). Encyclopedia of lakes and reservoirs, Dordrecht: Springer Netherlands, 26-31, doi:10.1007/978-1-4020-4410-6_38.
Hodgson D A, Verleyen E, Sabbe K, et al. 2005. Late Quaternary climate driven environmental change in the Larsemann Hills, East Antarctica, multi-proxy evidence from a lake sediment core. Quatern Res, 64: 83-99.
Hofstee E H, Campbell D I, Balks M R, et al. 2006. Groundwater characteristics at Seabee Hook, Cape Hallett, Antarctica. Antarct Sci, 18(4): 487-495, doi:10.1017/S0954102006000538.
Kakareka S, Kukharchyk T, Kurman P. 2019. Major and trace elements content in freshwater lakes of Vecherny Oasis, Enderby Land, East Antarctica. Environ Pollut, 255: 113126, doi:10.1016/j.envpol.2019. 113126.
Kakareka S, Kukharchyk T, Kurman P. 2022. Trace and major elements in surface snow and fresh water bodies of the Marguerite Bay Islands, Antarctic Peninsula. Polar Sci, 32: 100792, doi:10.1016/j.polar.2022. 100792.
Kanamaru T, Suganuma Y, Oiwane H, et al. 2018. The weathering of granitic rocks in a hyper-arid and hypothermal environment: a case study from the Sør-Rondane Mountains, East Antarctica. Geomorphology, 317: 62-74, doi:10.1016/j.geomorph.2018.05.015.
Kaup E, Burgess J S. 2002. Surface and subsurface flows of nutrients in natural and human impacted lake catchments on Broknes, Larsemann Hills, Antarctica. Antarct Sci, 14(4): 343-352, doi:10.1017/s09541020 02000123.
Kiernan K, Gore D B, Fink D, et al. 2009. Deglaciation and weathering of Larsemann Hills, East Antarctica. Antarct Sci, 21(4): 373, doi:10. 1017/s0954102009002028.
Kim J, Jeen S-W, Lim H S, et al. 2020. Hydrogeological characteristics of groundwater and surface water associated with two small lake systems on King George Island, Antarctica. J Hydrol, 590: 125537, doi:10.1016/j.jhydrol.2020.125537.
Klokov V, Kaup E, Zierath R, et al. 1990. Lakes of the Bunger Hills (East Antarctica): chemical and ecological properties. Polland Polar Res, 11: 147-159.
Krogulec E, Krogulec T, Małecki J, et al. 2018. Hydrogeological characteristics of aquifer near Arctowski Polish Antarctic Station on King George Island (South Shetland Islands), Antarctica. Polar Sci, 16: 68-77, doi:10.1016/j.polar.2018.02.005.
Kukharchyk T I, Kakareka S V, Giginyak Y G. 2022. Soils of the Broknes Peninsula, East Antarctica. Eurasian Soil Sci, 55(12): 1673-1688, doi:10.1134/s1064229322700016.
Kumar P, Shokri M R, Mehrotra I. 2002. Water quality: lakes of Schirmacher Oasis, Antarctica. Eighteenth Indian Expedition to Antarctica, Scientific Report, Department of Ocean Development. Technical Publication No.16., 273-292.
Kuznetsova M R, Priakhina G V, Grigoreva S D, et al. 2021. Formation factors of surface inflow to Antarctic lakes of the Larsemann Hills Oasis. Arct Antarct Res, 67(3): 293-309, doi:10.30758/0555-2648-2021-67-3-293-309 (in Russian).
Lyons W B, Welch K A, Carey A E, et al. 2005. Groundwater seeps in Taylor Valley Antarctica: an example of a subsurface melt event. Ann Glaciol, 40: 200-206, doi:10.3189/172756405781813609.
Masuda N, Nishimura M, Torii T. 1982. Pathway and distribution of trace elements in Lake Vanda, Antarctica. Nature, 298: 154-156.
Matsumoto G I, Nakaya S, Murayama H, et al. 1992. Geochemical characteristics of Antarctic lakes and ponds. Proc NIPR Symp Polar Biol, 5: 125-145.
Mergelov N S. 2014. Soils of wet valleys in the Larsemann Hills and Vestfold Hills oases (Princess Elizabeth Land, East Antarctica). Eurasian Soil Sci, 47(9): 845-862, doi:10.1134/S1064229314090099.
Moiseenko T I, Dinu M I, Gashkina N A, et al. 2019. Aquatic environment and anthropogenic factor effects on distribution of trace elements in surface waters of European Russia and Western Siberia. Environ Res Lett, 14(6): 065010, doi:10.1088/1748-9326/ab17ea.
National Centre for Antarctic and Ocean Research (NCAOR), Ministry of Earth Sciences, Government of India. 2010. Final comprehensive environmental evaluation of new Indian research station at Larsemann Hills, Antarctica.
Nędzarek A, Tórz A, Podlasińska J. 2015. Ionic composition of terrestrial surface waters in Maritime Antarctic and the processes involved in formation. Antarct Sci, 27(2): 150-161, doi:10.1017/s095410201400 0522.
Nigamatzyanova G R, Fedorova I V. 2015. Assessment of the ecological state of the Larsemann Hills and the Shirmacher Oases lakes (East Antarctica). Adv Curr Nat Sci, 12: 140-144.
Nikitin D A, Semenov M V. 2020. Subaqual soils of Antarctica: conditions of formation and perspectives of microbiological research. Dokuchaev Soil Bull, 102: 49-69, doi:10.19047/0136-1694-2020-102-49-69 (in Russian).
Nuruzzama M, Rahaman W, Mohan R. 2021. Sources, distribution and biogeochemical cycling of dissolved trace elements in the coastal lakes of Larsemann Hills, East Antarctica. Sci Total Environ, 764: 142833, doi:10.1016/j.scitotenv.2020.142833.
Nuruzzama M, Rahaman W, Tripathy G R, et al. 2020. Dissolved major ions, Sr and87Sr/86Sr of coastal lakes from Larsemann Hills, East Antarctica: solute sources and chemical weathering in a polar environment. Hydrol Process, 34, 2351-2364, doi:10.1002/hyp.13734.
Paudyal R, Kang S C, Sharma C M, et al. 2016. Variations of the physicochemical parameters and metal levels and their risk assessment in urbanized Bagmati River, Kathmandu, Nepal. J Chem, 2016: 6025905, doi:10.1155/2016/6025905.
Planchon F A M, Boutron C F, Barbante C, et al. 2002. Changes in heavy metals in Antarctic snow from Coats Land since the mid-19th to the late-20th century. Earth Planet Sci Lett, 200(1/2): 207-222, doi:10.1016/ s0012-821x(02)00612-x.
Quesada A, Vincent W F, Kaup E, et al. 2006. Landscape control of high latitude lakes in a changing climate//Bergstrom D M, Convey P, Huiskes A H L (eds.). Trends in Antarctic terrestrial and limnetic ecosystems. Dordrecht: Springer Netherlands, 221-252, doi:10.1007/ 1-4020-5277-4_11.
Rudnick R L, Gao S. 2003. Composition of the continental crust//Holland H D, Turekian K K (eds.). Treatise on geochemistry. Amsterdam: Elsevier, 1-64, doi:10.1016/b0-08-043751-6/03016-4.
Sabbe K, Hodgson D A, Verleyen E, et al. 2004. Salinity, depth and the structure and composition of microbial mats in continental Antarctic Lakes. Freshw Biol, 49(3): 296-319, doi:10.1111/j.1365-2427.2004. 01186.x.
Shevnina E, Kourzeneva E. 2017. Thermal regime and components of water balance of lakes in Antarctica at the Fildes Peninsula and the Larsemann Hills. Tellus A Dyn Meteorol Oceanogr, 69(1): 1317202, doi:10.1080/16000870.2017.1317202.
Shevnina E, Kourzeneva E, Dvornikov Y, et al. 2021. Retention time of lakes in the Larsemann Hills oasis, East Antarctica. Cryosphere, 15(6): 2667-2682, doi:10.5194/tc-15-2667-2021.
Thakur R C. 2019. Trace elemental variability in aerosols near the two Indian Antarctic research stations during austral summer//Twenty Eighth Indian Antarctic Expedition 2008, Ministry of Earth Sciences. Technical Publication, 26: 61-74
Thamban M, Laluraj C M, Mahalinganathan K, et al. 2010. Glaciochemistry of surface snow from the Ingrid Christensen Coast, East Antarctica, and its environmental implications. Antarct Sci, 22(4): 435-441, doi:10.1017/s0954102010000155.
Thamban M, Thakur R C. 2013. Trace metal concentrations of surface snow from Ingrid Christensen Coast, East Antarctica–spatial variability and possible anthropogenic contributions. Environ Monit Assess, 185(4): 2961-2975, doi:10.1007/s10661-012-2764-0.
Tiwari A K. 2017. Environmental monitoring around Indian stations. Proc Indian Natl Sci Acad, 83(2): 399-413, doi:10.16943/ptinsa/2017/ 48964.
Tiwari A K, Singh N. 2014. Mercury in the freshwater lakes of Schirmacher and Larsemann Hills, Antarctica. Int J Environ Sci, 4 (5): 703-708 .
Torii T, Yamagata N, Nakaya S, et al. 1975.Geochemical aspects of the McMurdo saline lakes with special emphasis on the distribution of nutrient matters., 4:5-21.
Torii T, Matsumoto G, Nakaya S. 1988.The chemical characteristics of Antarctic lakes and ponds, with special emphasis on the distribution of nutrients. Polarforschung,58 (2/3): 219-230.
Tuohy A, Bertler N, Neff P, et al. 2015. Transport and deposition of heavy metals in the Ross Sea region, Antarctica. J Geophys Res Atmos, 120(20): 10996-11011, doi:10.1002/2015JD023293.
Verleyen E, Hodgson D A, Gibson J, et al. 2012. Chemical limnology in coastal East Antarctic lakes: monitoring future climate change in centres of endemism and biodiversity. Antarct Sci, 24(1): 23-33, doi:10.1017/s0954102011000642.
Wagenbach D, Ducroz F, Mulvaney R, et al. 1998. Sea-salt aerosol in coastal Antarctic regions. J Geophys Res, 103(D9): 10961-10974, doi:10.1029/97jd01804.
Welch K A, Lyons W B, Whisner C, et al. 2010. Spatial variations in the geochemistry of glacial meltwater streams in the Taylor Valley, Antarctica. Antarct Sci 22(6): 662-672, doi:10.1017/s09541020100 00702.
Zelano I, Malandrino M, Giacomino A, et al. 2017. Element variability in lacustrine systems of Terra Nova Bay (Antarctica) and concentration evolution in surface waters. Chemosphere, 180: 343-355, doi:10. 1016/j.chemosphere.2017.04.005.
Table S1 Correlation coefficients () between the major and trace elements in the snow from Broknes Peninsula, Larsemann Hills (=13)
NaMgKCaFeAlVCrMnCoCuZnAsSeMoCdSb Mg0.99– K0.810.78– Ca0.510.570.37– Fe0.630.670.670.58– Al0.820.850.680.780.85– V0.040.04−0.040.410.010.25– Cr0.150.120.120.100.020.280.18– Mn0.140.210.130.790.650.640.370.10– Co0.010.080.030.730.590.540.390.080.99– Cu−0.21−0.17−0.060.340.050.170.690.360.450.52– Zn−0.08−0.04−0.270.59−0.060.150.330.130.560.530.14– As0.040.090.100.660.390.490.740.260.710.740.770.29– Se−0.03−0.03−0.240.48−0.320.070.550.380.220.210.430.720.44– Mo−0.23−0.19−0.290.18−0.26−0.13−0.27−0.010.030.01−0.170.47−0.060.39– Cd0.000.07−0.030.770.230.390.430.240.790.780.580.800.600.630.29– Sb−0.070.00−0.030.680.540.460.380.050.981.000.510.560.710.210.020.77– Ba−0.14−0.13−0.200.09−0.51−0.21−0.120.36−0.21−0.210.220.27−0.070.600.500.34−0.21
Note: Bold value means correlation significant at=0.01.
Table S2 Correlation coefficients () between the major and trace elements in the groundwater from Broknes Peninsula, Larsemann Hills (=8)
NaMgKCaFeAlVCrMnCoNiCuZnAsSeMoCdSbBaTlPb Mg0.90– K0.940.73– Ca0.870.990.69– Fe0.320.010.62−0.04– Al0.340.030.64−0.030.99– V0.330.010.63−0.040.990.99– Cr0.470.170.740.110.990.990.99– Mn0.420.270.430.260.050.060.060.12– Co0.940.710.960.670.500.530.510.630.51– Ni0.440.080.710.030.970.970.970.980.270.64– Cu0.440.090.720.030.980.980.980.990.180.640.99– Zn0.470.130.740.070.970.970.980.990.150.650.980.99– As0.380.050.670.000.990.990.990.990.110.560.980.990.99– Se0.810.500.950.460.760.780.770.850.470.920.870.860.860.81– Mo0.29−0.030.60−0.080.990.990.990.980.050.490.970.980.970.990.75– Cd0.560.230.750.190.800.800.800.840.520.700.900.850.840.830.880.79– Sb0.330.010.63−0.030.990.990.990.980.060.510.970.980.980.990.780.990.81– Ba0.500.180.770.120.980.980.981.000.180.670.990.990.990.990.880.970.870.98– Tl0.26−0.050.57−0.100.990.990.990.970.010.460.950.960.950.990.720.990.770.990.96–
Continued

NaMgKCaFeAlVCrMnCoNiCuZnAsSeMoCdSbBaTlPb Pb0.30−0.020.60−0.070.990.990.990.980.050.490.970.980.970.990.750.990.800.990.970.99– Th0.27−0.050.58−0.100.990.990.990.980.030.460.960.970.970.990.730.990.780.990.970.990.99
Note: Bold value means correlation significant at=0.01.
Table S3 Correlation coefficients () between the major and trace elements in the lake water from Broknes Peninsula, Larsemann Hills (=23)
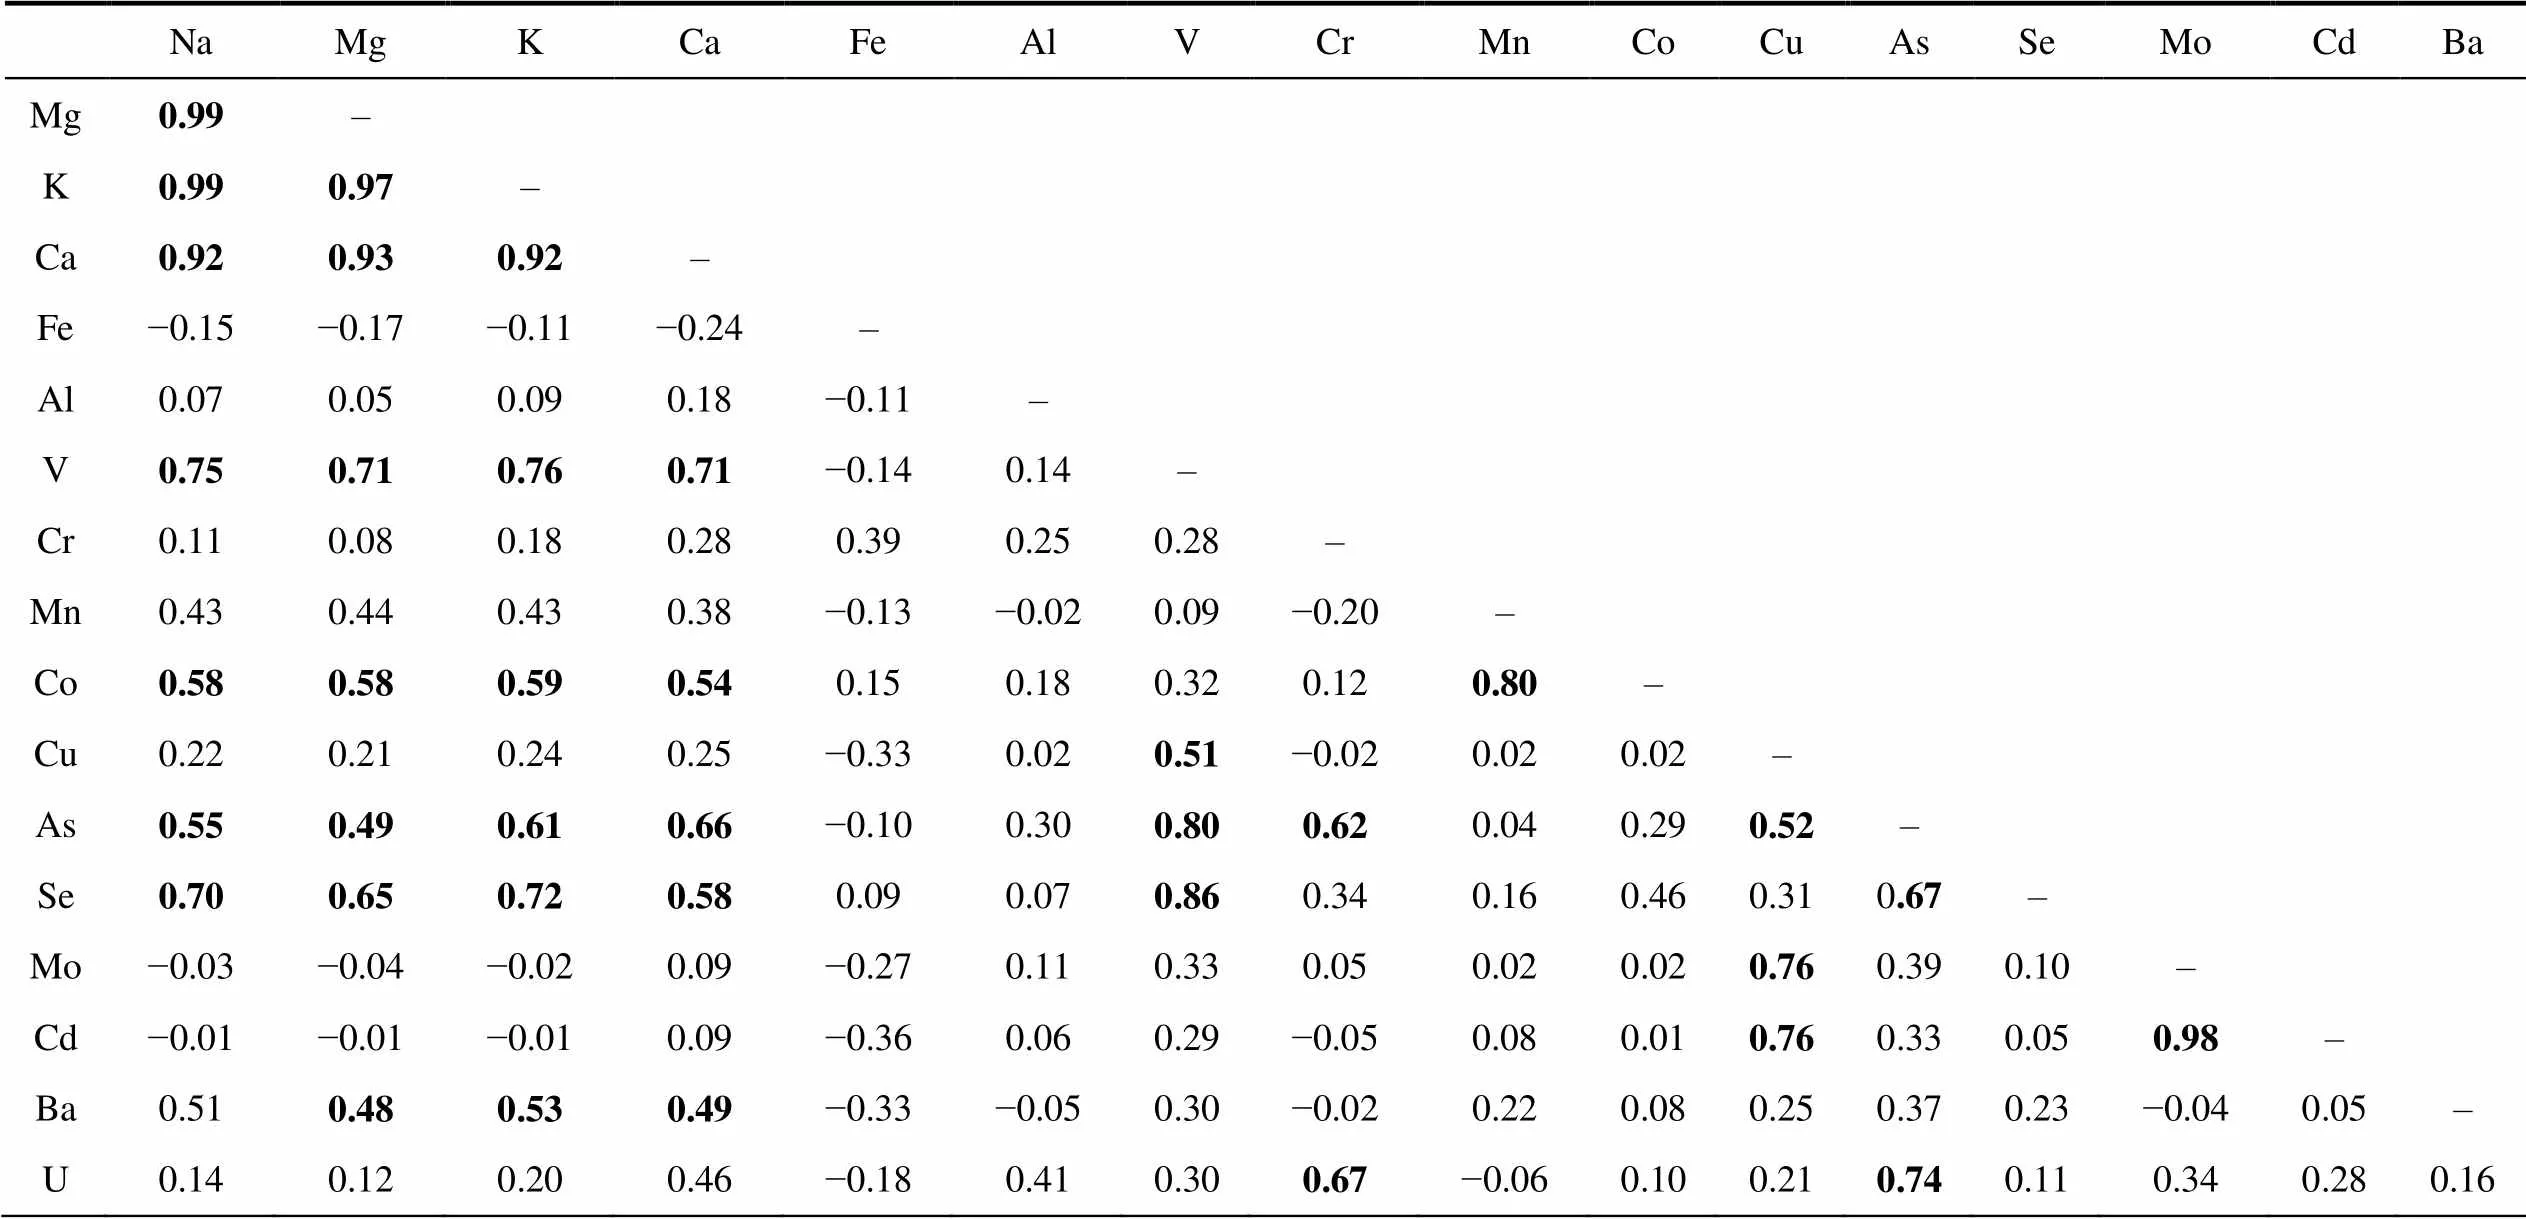
NaMgKCaFeAlVCrMnCoCuAsSeMoCdBa Mg0.99– K0.990.97– Ca0.920.930.92– Fe−0.15−0.17−0.11−0.24– Al0.070.050.090.18−0.11– V0.750.710.760.71−0.140.14– Cr0.110.080.180.280.390.250.28– Mn0.430.440.430.38−0.13−0.020.09−0.20– Co0.580.580.590.540.150.180.320.120.80– Cu0.220.210.240.25−0.330.020.51−0.020.020.02– As0.550.490.610.66−0.100.300.800.620.040.290.52– Se0.700.650.720.580.090.070.860.340.160.460.310.67– Mo−0.03−0.04−0.020.09−0.270.110.330.050.020.020.760.390.10– Cd−0.01−0.01−0.010.09−0.360.060.29−0.050.080.010.760.330.050.98– Ba0.510.480.530.49−0.33−0.050.30−0.020.220.080.250.370.23−0.040.05– U0.140.120.200.46−0.180.410.300.67−0.060.100.210.740.110.340.280.16
Note: Bold value means correlation significant at=0.01.
Table S4 Average content of major ions and trace elements in lake waters at Broknes Peninsula, Larsemann Hills in 2014 and 2020

Element and parameterSarah Tarn LakeLake ReidStepped LakeLake ScandrettProgress LakeBoulder LakeDiscussion LakeLake Sibthorpe 2014 (4)2020 (1)2014 (2)2020 (2)2014 (2)2020 (1)2014 (2)2020 (3)2014 (2)2020 (1)2020 (1)2020 (1)2020 (1) рН7.56.57.56.26.76.24.35.96.76.15.66.05.7 Conductivity/(µS∙cm−1)2362482217991834369217112117315214.1201139 HCO3−/(mg∙L−1)36.49.722.331.23.608.98nd5.491.63.80.051.953.07 Cl−/(mg∙L−1)700.9134.0640.8275.591.8196.540.038.445.050.05.060.046.7 SO42−/(mg∙L−1)17.35.23.817.05.026.73.16.03.65.50.1710.06.5 Be/(mg∙L−1)0.021nd0.0200.0040.0140.002nd0.0040.0170.0030.0040.0030.002 Na/(mg∙L−1)576.975.8418.7164.078.1116.027.731.137.331.52.729.728.9 Mg/(mg∙L−1)73.99.8541.516.36.5013.43.223.444.713.790.323.813.37 K/(mg∙L−1)17.22.6113.56.773.505.431.001.311.381.290.151.291.25 Ca/(mg∙L−1)27.42.8414.14.702.404.221.511.372.391.470.111.931.40 Fe/(µg∙L−1)510246207nd147153nd5996451 Al/(µg∙L−1)4.500.687.683.181.113.055.0714.410.190.380.891.072.30 V/(µg∙L−1)1.290.161.830.580.230.230.800.100.170.080.010.100.09 Cr/(µg∙L−1)0.160.520.220.610.050.65nd0.190.060.240.040.310.28 Mn/(µg∙L−1)2.810.853.261.011.361.161.150.751.701.250.150.811.62
Continued
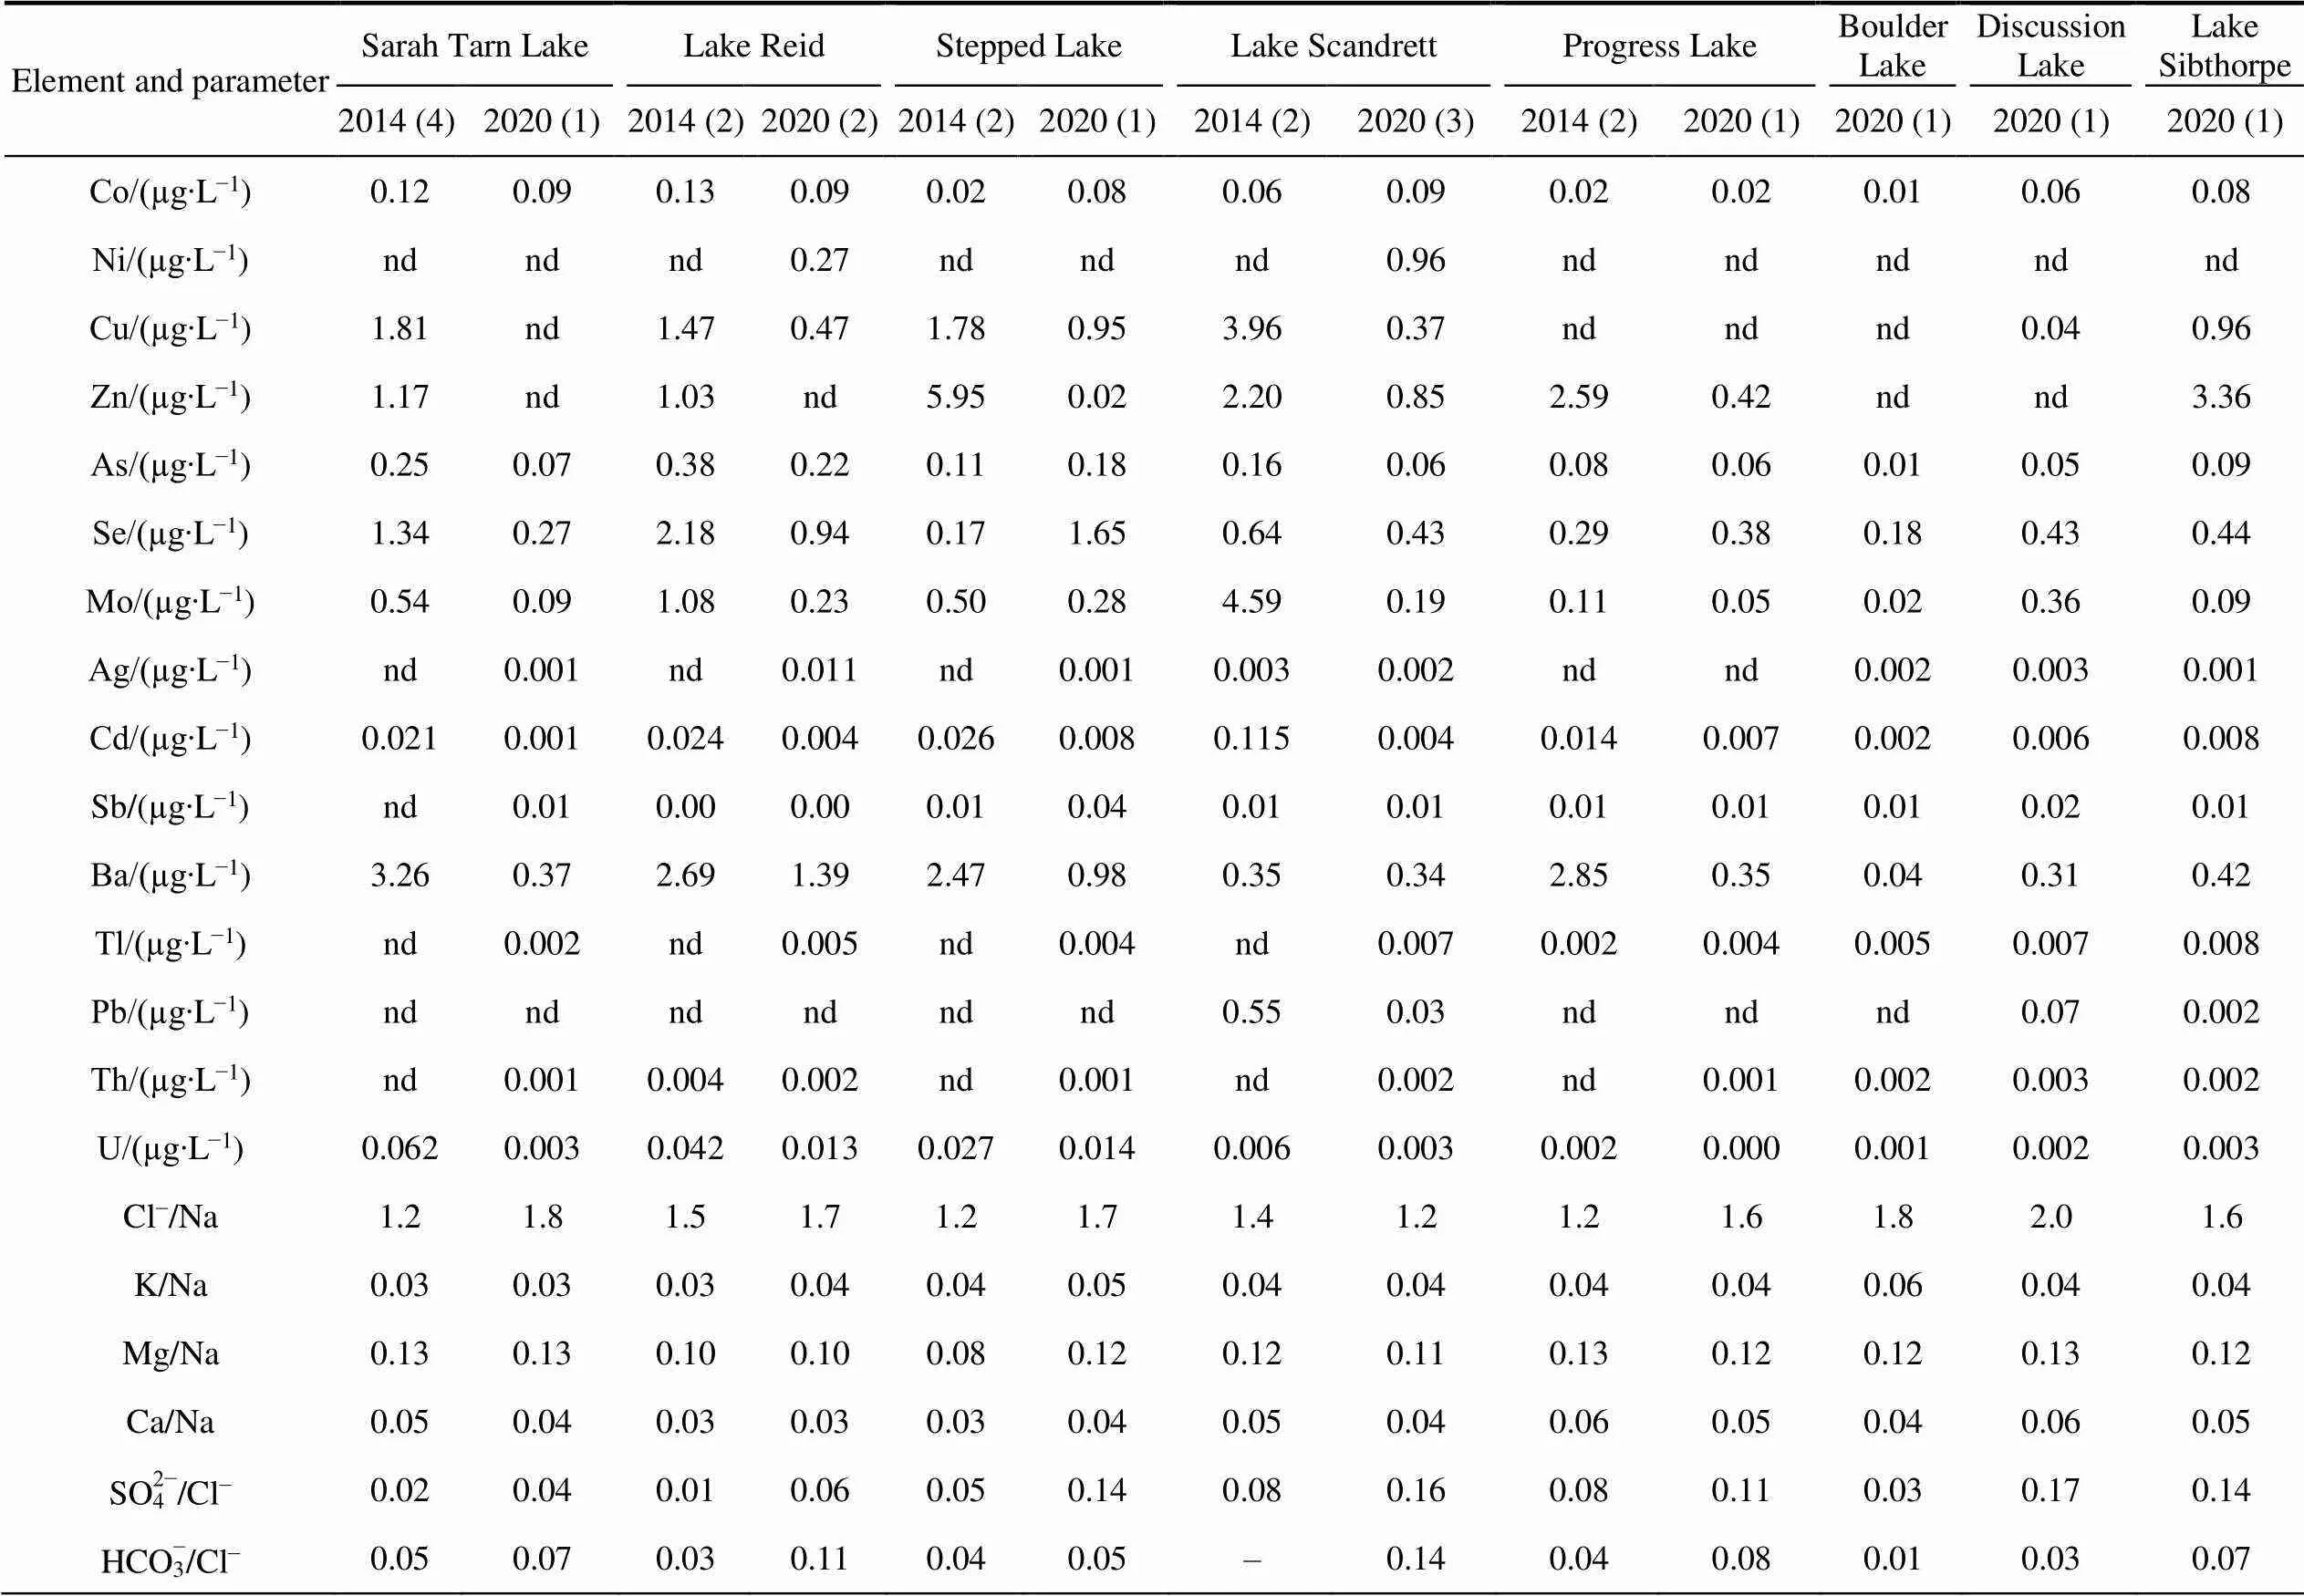
Element and parameterSarah Tarn LakeLake ReidStepped LakeLake ScandrettProgress LakeBoulder LakeDiscussion LakeLake Sibthorpe 2014 (4)2020 (1)2014 (2)2020 (2)2014 (2)2020 (1)2014 (2)2020 (3)2014 (2)2020 (1)2020 (1)2020 (1)2020 (1) Co/(µg∙L−1)0.120.090.130.090.020.080.060.090.020.020.010.060.08 Ni/(µg∙L−1)ndndnd0.27ndndnd0.96ndndndndnd Cu/(µg∙L−1)1.81nd1.470.471.780.953.960.37ndndnd0.040.96 Zn/(µg∙L−1)1.17nd1.03nd5.950.022.200.852.590.42ndnd3.36 As/(µg∙L−1)0.250.070.380.220.110.180.160.060.080.060.010.050.09 Se/(µg∙L−1)1.340.272.180.940.171.650.640.430.290.380.180.430.44 Mo/(µg∙L−1)0.540.091.080.230.500.284.590.190.110.050.020.360.09 Ag/(µg∙L−1)nd0.001nd0.011nd0.0010.0030.002ndnd0.0020.0030.001 Cd/(µg∙L−1)0.0210.0010.0240.0040.0260.0080.1150.0040.0140.0070.0020.0060.008 Sb/(µg∙L−1)nd0.010.000.000.010.040.010.010.010.010.010.020.01 Ba/(µg∙L−1)3.260.372.691.392.470.980.350.342.850.350.040.310.42 Tl/(µg∙L−1)nd0.002nd0.005nd0.004nd0.0070.0020.0040.0050.0070.008 Pb/(µg∙L−1)ndndndndndnd0.550.03ndndnd0.070.002 Th/(µg∙L−1)nd0.0010.0040.002nd0.001nd0.002nd0.0010.0020.0030.002 U/(µg∙L−1)0.0620.0030.0420.0130.0270.0140.0060.0030.0020.0000.0010.0020.003 Cl−/Na1.21.81.51.71.21.71.41.21.21.61.82.01.6 K/Na0.030.030.030.040.040.050.040.040.040.040.060.040.04 Mg/Na0.130.130.100.100.080.120.120.110.130.120.120.130.12 Ca/Na0.050.040.030.030.030.040.050.040.060.050.040.060.05 SO42−/Cl−0.020.040.010.060.050.140.080.160.080.110.030.170.14 HCO3−/Cl−0.050.070.030.110.040.05–0.140.040.080.010.030.07
Note: The number of samples in brackets.
Table S5 Content of major ions and trace elements in groundwater of two investigated sites, Broknes Peninsula, Larsemann Hills
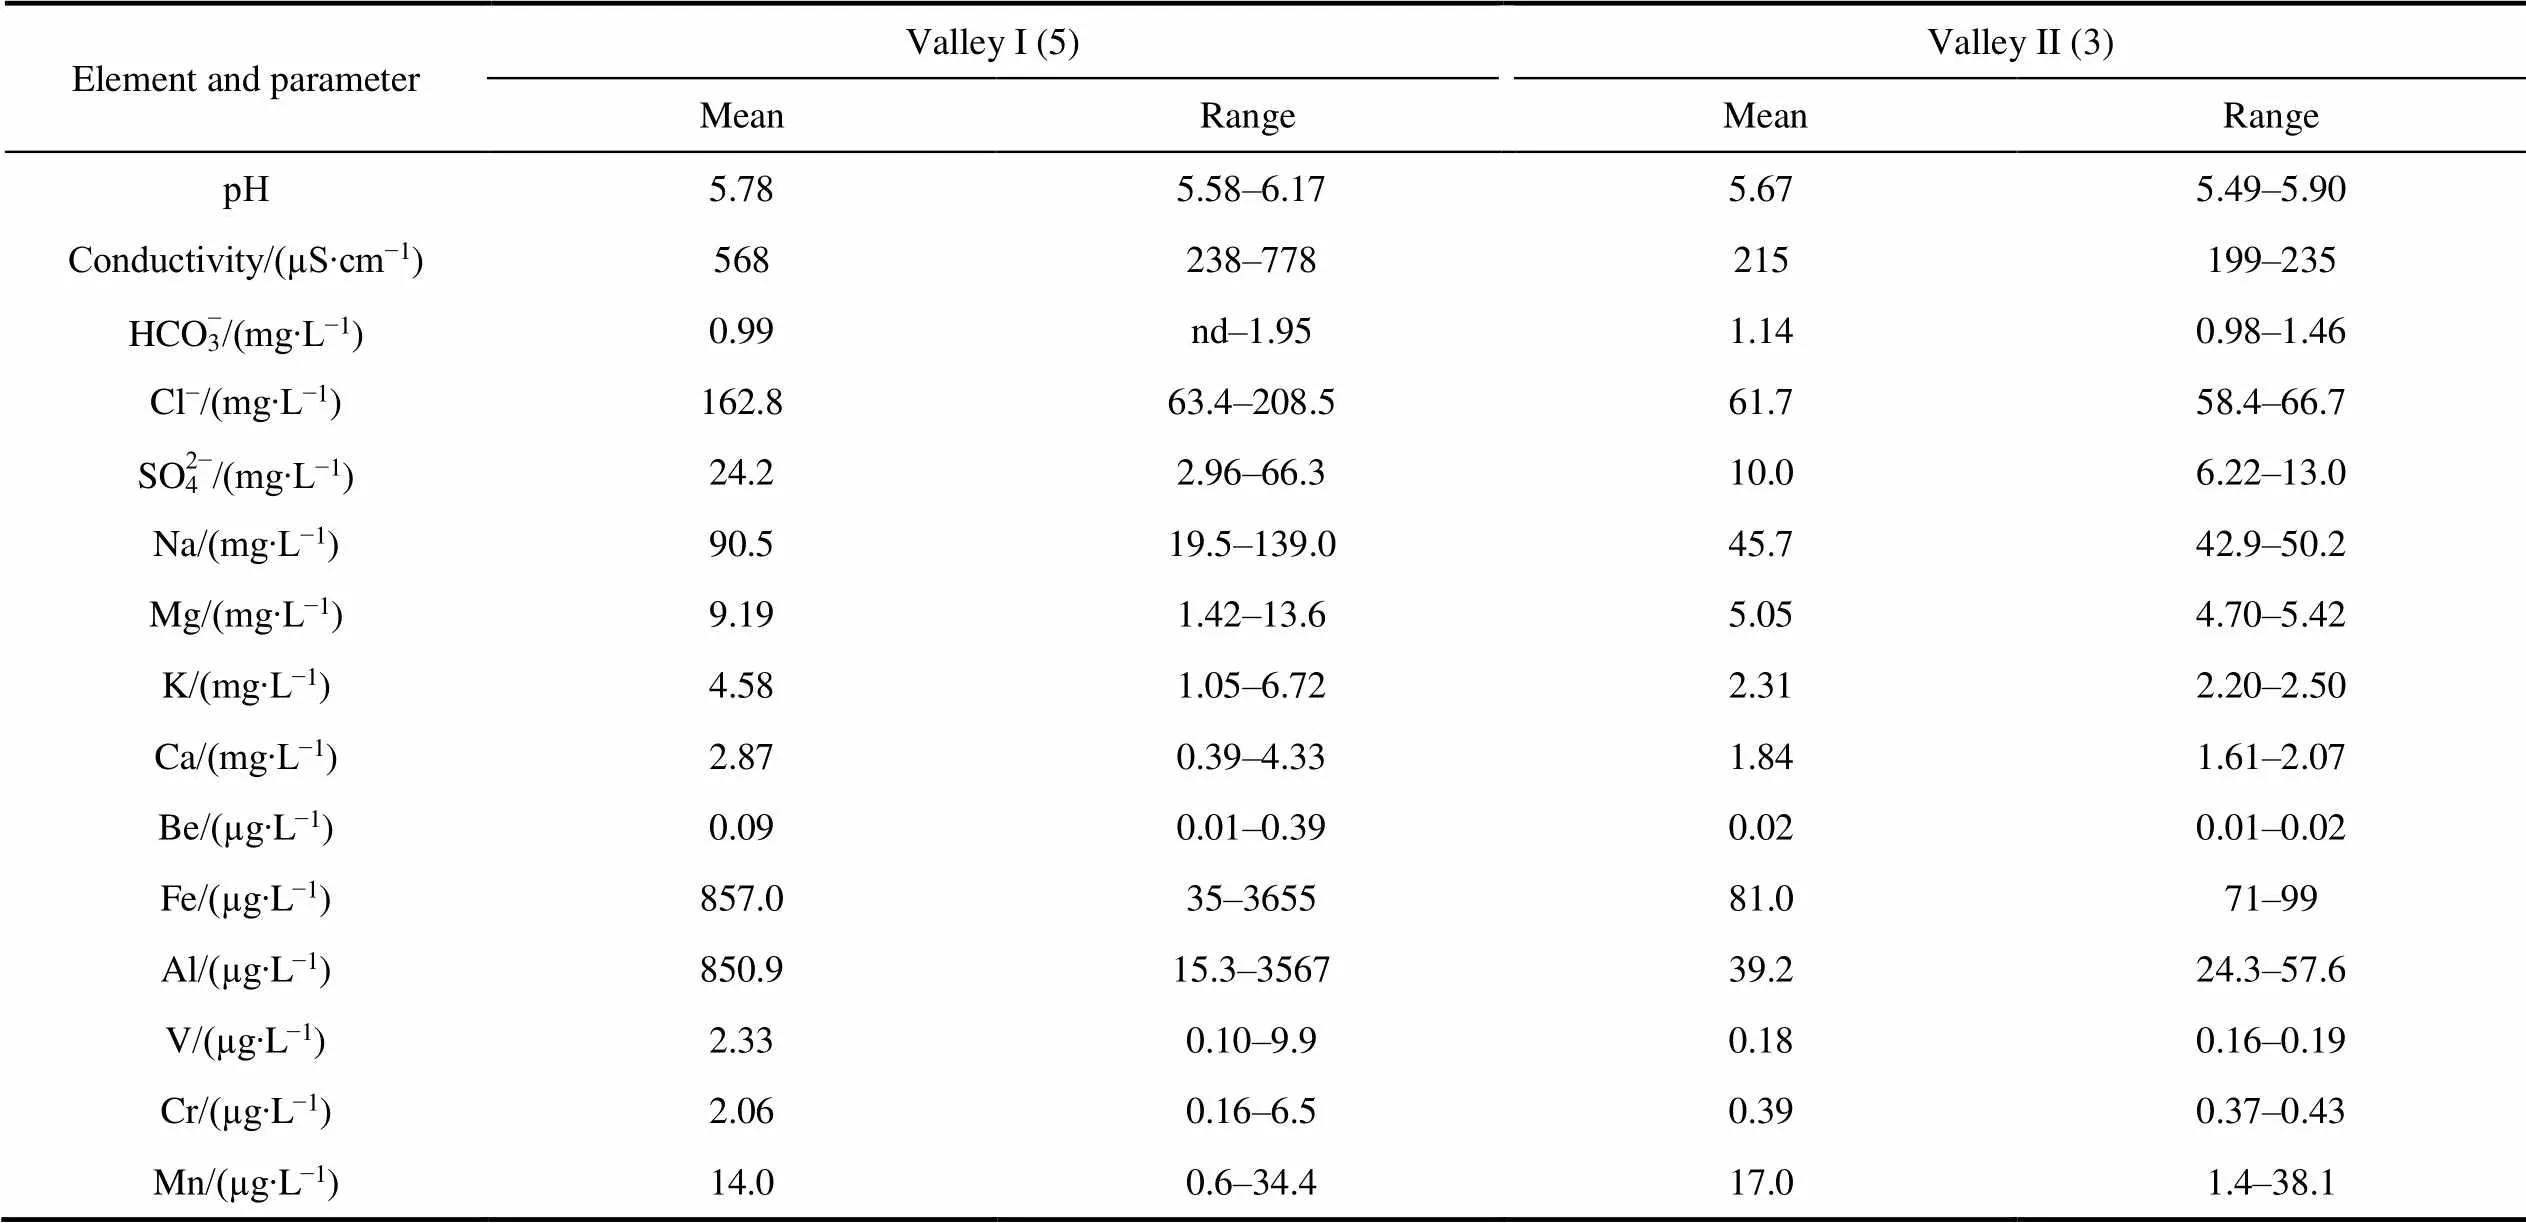
Element and parameterValley I (5)Valley II (3) MeanRangeMeanRange рН5.785.58–6.175.675.49–5.90 Conductivity/(µS∙cm−1)568238–778215199–235 HCO3−/(mg∙L−1)0.99nd–1.951.140.98–1.46 Cl−/(mg∙L−1)162.863.4–208.561.758.4–66.7 SO42−/(mg∙L−1)24.22.96–66.310.06.22–13.0 Na/(mg∙L−1)90.519.5–139.045.742.9–50.2 Mg/(mg∙L−1)9.191.42–13.65.054.70–5.42 K/(mg∙L−1)4.581.05–6.722.312.20–2.50 Ca/(mg∙L−1)2.870.39–4.331.841.61–2.07 Be/(µg∙L−1)0.090.01–0.390.020.01–0.02 Fe/(µg∙L−1)857.035–365581.071–99 Al/(µg∙L−1)850.915.3–356739.224.3–57.6 V/(µg∙L−1)2.330.10–9.90.180.16–0.19 Cr/(µg∙L−1)2.060.16–6.50.390.37–0.43 Mn/(µg∙L−1)14.00.6–34.417.01.4–38.1
Continued
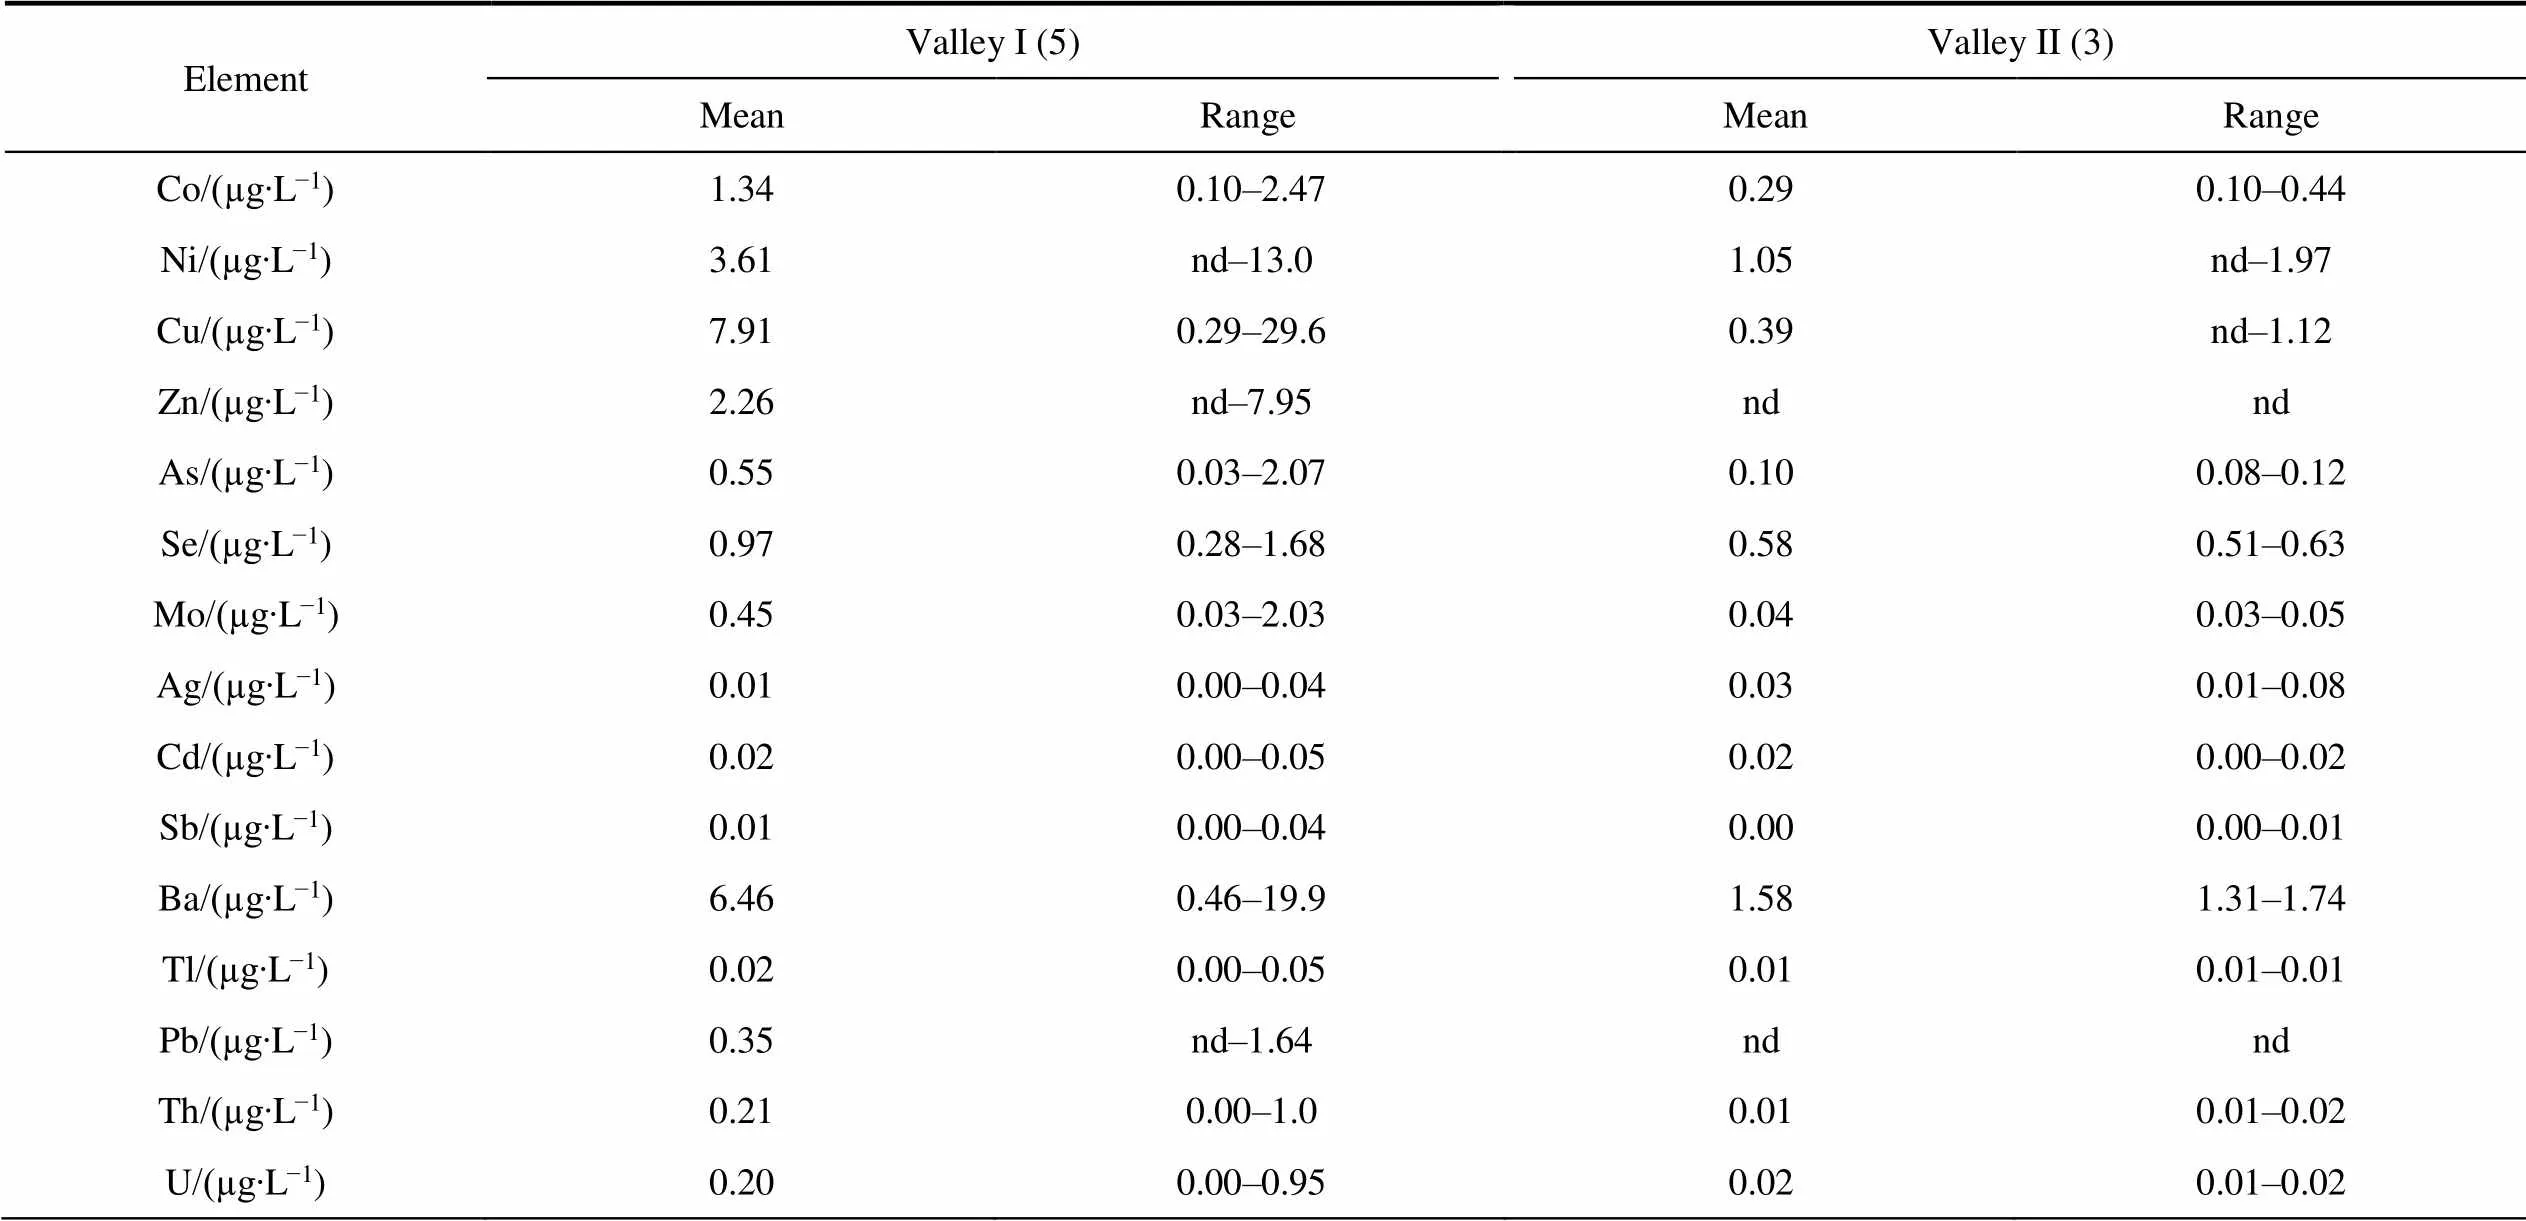
ElementValley I (5)Valley II (3) MeanRangeMeanRange Co/(µg∙L−1)1.340.10–2.470.290.10–0.44 Ni/(µg∙L−1)3.61nd–13.01.05nd–1.97 Cu/(µg∙L−1)7.910.29–29.60.39nd–1.12 Zn/(µg∙L−1)2.26nd–7.95ndnd As/(µg∙L−1)0.550.03–2.070.100.08–0.12 Se/(µg∙L−1)0.970.28–1.680.580.51–0.63 Mo/(µg∙L−1)0.450.03–2.030.040.03–0.05 Ag/(µg∙L−1)0.010.00–0.040.030.01–0.08 Cd/(µg∙L−1)0.020.00–0.050.020.00–0.02 Sb/(µg∙L−1)0.010.00–0.040.000.00–0.01 Ba/(µg∙L−1)6.460.46–19.91.581.31–1.74 Tl/(µg∙L−1)0.020.00–0.050.010.01–0.01 Pb/(µg∙L−1)0.35nd–1.64ndnd Th/(µg∙L−1)0.210.00–1.00.010.01–0.02 U/(µg∙L−1)0.200.00–0.950.020.01–0.02
Note: The number of samples in brackets.
Table S6 Comparison of the content of the major elements and electrical conductivity in the lakes of the Broknes Peninsula, Larsemann Hills
LakeReferenceYearNa/(mg∙L−1)Mg/(mg∙L−1)K/(mg∙L−1)Ca/(mg∙L−1)Conductivity/(µS∙cm−1) Progress Lake Gillieson et al., 1990198764.46.81.83.8321 Ellis-Evans et al., 19981993/94–––-–300 Sabbe et al., 2004199746.76.00.93.4320 Gasparon et al., 200219979.40.960.310.5272 Authors data201437.34.71.382.39173 Boronina et al., 20192018––––178 Authors data202031.53.81.291.47152 Lake ScandrettGillieson et al., 1990198719.72.20.80.9139 Ellis-Evans et al., 19981993/94––––139 Sabbe et al., 2004199712.81.70.70.985 Gasparon et al., 200219974.50.440.130.3140 Authors data201427.73.21.01.5171 Boronina et al., 20192018––––201 Authors data202031.13.41.31.4121 Lake ReidGillieson et al., 19901987425.631.31431.41730 Ellis-Evans et al., 19981993/94––––1370 Sabbe et al., 20041997190017658509160 Gasparon et al., 20021997135.014.54.645.03760 Authors data2014418.741.513.514.12179 Boronina et al., 20192018––––1704 Authors data2020164.016.36.84.7918 Sarah Tarn LakeGillieson et al., 19901987538.850.416.446.83340 Ellis-Evans et al., 19981993/94––––3320
Continued

LakeReferenceYearNa/(mg∙L−1)Mg/(mg∙L−1)K/(mg∙L−1)Ca/(mg∙L−1)Conductivity/(µS∙cm−1) Sarah Tarn LakeSabbe et al., 20041997620082416019328000 Gasparon et al., 20021997247.136.47.612.65520 Authors data2014576.973.917.227.42362 Boronina et al., 20192018––––2939 Authors data202075.89.82.62.8482 Sibthorpe LakeGillieson et al., 1990198718.32.90.80.5130 Sabbe et al., 2004199725.02.56.20.6164 Gasparon et al., 200219973.650.360.100.10112 Boronina et al., 20192018––––152 Authors data202028.93.41.251.4139 Stepped/Heart LakeGillieson et al., 19901987127.112.3–7.4987 Ellis-Evans et al., 19981993/94––––570 Sabbe et al., 2004199728030.412.126.11620 Gasparon et al., 20021997626.952.22.51640 Authors data201478.16.53.52.4348 Boronina et al., 20192018––––895 Authors data2020116.013.45.44.2692 Discussion Lake Gillieson et al., 19901987––––– Ellis-Evans et al., 19981993/94––––454 Sabbe et al., 2004199711914.44.315.0680 Gasparon et al., 200219979.012.00.320.6358 Boronina et al., 20192018––––199 Authors data202029.73.81.31.9201 Boulder LakeGillieson et al., 19901987––––– Gasparon et al., 200219972.040.160.05nd34 Boronina et al., 20192018––––66.7 Authors data20202.70.320.150.1114.1

Figure S1 Chemical composition of lake water at Broknes Peninsula, Larsemann Hills in 2014 and 2020. BL–Boulder Lake; DL–Discussion Lake; SL–Sibthorpe Lake.
: Kakareka S, Kukharchyk T, Giginyak Y, et al. Chemical composition of natural waters at Broknes Peninsula, Larsemann Hills, Antarctica. Adv Polar Sci, 2023, 34(4): 318-339,doi:10.12429/j.advps.2023.0008
10.12429/j.advps.2023.0008
15 June 2023;
16 December 2023;
30 December 2023
, ORCID: 0000-0002-4267-0948, E-mail: sk001@yandex.ru
杂志排行
Advances in Polar Science的其它文章
- Space physics and astronomy research from Chinese polar stations:current and future directions
- Variations and relations between chlorophyll concentrations and physical-ecological processes near the West Antarctic Peninsula
- Evaluation of meteorological predictions by the WRF model at Barrow,Alaska and Summit,Greenland in the Arctic in April 2019
- Current state of research on microplastics in the marine-atmosphere environment of the Arctic region
- Carbon isotope ratios of n-alkanoic acids:new organic proxies for paleo-productivity in Antarctic ponds
- Chlorella across latitudes:investigating biochemical composition and antioxidant activities for biotechnological applications