Evolution of Subkilometer-scale Impact Craters on the Lunar Maria as Constrained from Mini-RF Data and Topographic Degradation Model
2024-01-16QingiSun孙庆海WenzheFa法文哲MengHuaZhu祝梦华andJunDu都骏
Qingi Sun (孙庆海), Wenzhe Fa (法文哲)3,, Meng-Hua Zhu (祝梦华), and Jun Du (都骏)
1 State Key Laboratory of Lunar and Planetary Sciences, Macau University of Science and Technology, Macau 999078, China 2 CNSA Macau Center for Space Exploration and Science, Macau 999078, China 3 Institute of Remote Sensing and Geographical Information System, School of Earth and Space Sciences, Peking University, Beijing 100871, China wzfa@pku.edu.cn 4 State Key Laboratory of Space Weather, National Space Science Center, Chinese Academy of Sciences, Beijing 100190, China Received 2023 June 12; revised 2023 September 15; accepted 2023 September 20; published 2023 October 25
Abstract Physical properties (e.g., ejecta size and distribution) of impact craters are crucial and essential to understanding the ejecta excavation and deposition process, estimating rock breakdown rate, and revealing their evolution characteristics.However, whether these physical properties are scale-dependent and how they evolve in different radial regions needs further studies.In this study,we first investigated the physical properties and evolution of subkilometer(D ≤800 m)craters on lunar maria based on the radar circular polarization ratio(CPR).In addition,we estimated the periods over which rocks and blocky ejecta are exposed and buried in the shallow subsurface layer(termed as exposure time) in different radial regions and assessed the retention time and degradation states for potential radar anomalous craters.We found that in the central region of craters, the largest median CPR occurs after an 80 Myr delay following crater formation.In the rim region, there is no obvious CPR peak in the first 100 Ma, whereas in the upper wall region, an evident CPR peak occurs beyond 100 Ma and could last over one billion years.In addition, the probable exposure time of rocks and blocky ejecta is estimated to be ∼2.0 Gyr(central region), ∼2.7 Gyr (upper wall region), ∼2.1 Gyr (rim region), and ∼0.6 Gyr (continuous ejecta blanket region).We also propose that the retention time of radar anomalous craters depends on the crater size, whereas their degraded states are independent of crater size.
Key words: Moon – planets and satellites: surfaces – planets and satellites: physical evolution
1.Introduction
As a fundamental geologic process on the Moon, impact cratering can excavate and eject a large population of boulders,rocks, decimeter-to-centimeter scale clasts, and fine-grained regolith and most ejecta materials finally deposit in a limited range surrounding the impact site (e.g., Melosh 1989).After formation, impact craters are affected by degradation due to later bombardment by meteorites, micrometeorites (Soderblom 1970; Fassett & Thomson 2014), distal ejecta (Li &Mustard 2005), land sliding (Senthil Kumar et al.2013; Xiao et al.2013),and thermal cycling(Molaro&Byrne 2012).Such diverse geologic processes not only severely modify crater morphologies (e.g., depth and slope; Stopar et al.2017; Sun et al.2023), but also change the physical properties (e.g., size and distribution of rocks) in crater interior and exterior continuous ejecta blanket regions.Therefore, quantification and analysis of the physical properties of impact craters are crucial and essential to reveal the evolution characteristics of lunar impact craters, estimate the survival time of rocks and blocky ejecta in the surface and subsurface, and evaluate growth rates of fine-grained regolith.According to remote sensing data sets of the Moon,previous studies on the physical properties of lunar craters are roughly divided into two periods:the 1970–1980s and the 21st century.
During the 1970–1980s, Earth-based radar observations(e.g., Haystack and Arecibo radars), thermal infrared observations (e.g., Earth-based thermal infrared observations during lunar eclipses and Apollo 17 scanning Infrared Radiometer experiment) and optical images (e.g., Lunar Orbiter photography and Apollo Orbital photography) were used to study physical properties of crater ejecta deposits (e.g., Thompson et al.1974, 1979, 1980, 1981).Previous works systematically investigated the optical,infrared,and radar signatures of ejecta deposits associated with over 1000 lunar craters with diameters from 4 to 100 km and Thompson et al.(1980) divided these craters into eight classes based on different remote-sensing characteristics and provided possible evolution sequences of these eight classes.For example, the BBB class indicates numerous rocks in the surface and subsurface (i.e., fresh younger craters), whereas the FFF class presents no excess surface or subsurface blocks (i.e., degraded older ones).Furthermore, they found that the lifetimes of these physical properties depend on crater diameter and smaller craters lose radar and infrared bright halo more rapidly compared with larger craters.In addition, Schultz & Mendell (1978) also provided four possible mechanisms(e.g.,ejecta interaction and sorting) to explain the formation of non-blocky ejecta deposits associated with large lunar craters (D>3 km) based on the same orbital infrared data.Studies in this period reveal that remote-sensing signatures of crater ejecta deposits mainly depend on ejecta size, their buried depth, and surface roughness.Furthermore, most studies found that the variations and lifetime of these signatures also depend on crater size.However, studies on physical properties and their lifetime associated with smaller craters (e.g., D<1 km) are rare due to the coarse spatial resolution of remote-sensing data used in this period.In addition, whether or not there are significant differences in evolution behaviors of physical properties between crater interior and crater ejecta remains unclear.
In the 21st century, the advent of high-resolution lunar optical data (e.g., Lunar Reconnaissance Orbiter [LRO]Camera [LROC] images), thermal infrared data (e.g., LRO Diviner),newly released earth-based radar data(e.g.,upgraded Arecibo radar) and orbital radar images (e.g., LRO Miniature Radio Frequency [Mini-RF]) provide an unprecedented opportunity for systematical study on physical properties of crater ejecta deposits and their evolutions.Several fundamental questions on the physical properties of impact craters have been addressed based on these advanced data sets.For example,the formation and degradation mechanisms of radar bright halo and dark halo craters (e.g., Gupta & Ghent 2008; Ghent et al.2010, 2016), the distribution characteristics and age of radar anomalous craters (e.g.,Fa &Cai 2013; Eke et al.2014; Fa &Eke 2018),the survival time of rocks and boulders on the lunar surface (e.g., Basilevsky et al.2013, 2015, 2018), and the dating of individual impact craters(e.g.,Bell et al.2012;Ghent et al.2014;Li et al.2018).Furthermore,the temporal evolution of radar circular polarization ratio (CPR) was investigated based on a mare crater database (800 m–5 km; N=13 657;King et al.2017; Fassett et al.2018a; Nypaver et al.2019, 2021).Their endeavors demonstrate that the evolution of CPR in crater interiors and exteriors is significantly decoupled.However, some questions involving physical properties require additional research to answer.For example,whether obvious differences exist in the CPR evolution of smaller craters (e.g., D<800 m) and how CPR evolves (e.g.,decline rates) in different radial regions (e.g., central region,upper wall region)of craters.Thus,in this study,we will focus on small craters with diameters <800 m and investigate CPR distribution characteristics and their evolution associated with these small craters.
Given that ejecta properties (e.g., size and emplacement distance)are mainly correlated with crater size,studies on radar CPR evolution of smaller craters also could help understand scale dependence on ejecta properties.Greater shock pressure and longer residence time of fragmented debris lead to longer comminution of ejecta associated with larger craters (e.g.,Schultz & Mendell 1978).However, larger craters generally excavate more rocks, and the size of the largest ejecta is probably related to crater size (e.g., Moore 1971; Bart &Melosh 2010).Moreover, Housen & Holsapple (1999) found that the effective strength of rocks is scale-dependent, and the larger rocks break down rapidly due to weaker strength.In addition, the degradation rate of smaller craters is larger than that of larger craters(e.g.,Fassett&Thomson 2014).Cratering processes of smaller impact events play a crucial role in overturning and mixing of lunar surficial regolith(i.e.,regolith gardening) than those of larger craters (e.g., Shi et al.2022).These phenomena above also help motivate our systematical investigation of how radar CPR evolves for smaller craters.
In this study, we first investigated the temporal evolution of radar CPR in crater interior and exterior regions for subkilometer craters (D ≤800 m) on the lunar maria.We next estimated the period over which rocks and blocky ejecta are exposed and buried in the near-surface regolith layer(∼1–3 m)in different radial regions of the crater.We also performed a case study on individual craters to investigate their behaviors and evolution histories in different remote-sensing maps in detail.Moreover, we discussed the retention timescale of potential radar anomalous craters and assessed the effects of surface slopes on CPR.This study, as a critical supplement to the investigation of the physical properties of lunar craters,could help us further understand the scale-dependent effect of the evolution on crater’s physical properties.
2.Data and Methods
2.1.Optical, Topographic, and Radar Data Sets
High-resolution optical and topographic data sets are preferential to study lunar small craters, especially for subkilometer craters.In this study, we used the LROC Narrow-Angle Camera(NAC)images to manually select crater samples and the spatial resolution of NAC is ∼0.5–2 m pixel−1(Robinson et al.2010).Considering that obvious offsets exist between the crater locations in NAC and Mini-RF images, we also used NAC images to coregister these two data sets.In addition,we used NAC digital terrain models(DTMs)products to extract radial topographic profiles of crater samples.The spatial resolutions of NAC DTMs are ∼2–4 m pixel−1,with the absolute accuracy of the elevation (indicated by root-meansquare error)generally smaller than one-pixel space(Henriksen et al.2017).
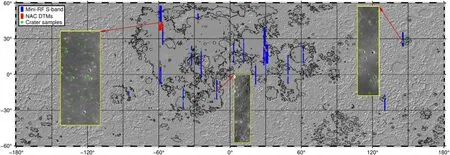
Figure 1.The locations of mare 260 sub-kilometer scale impact craters (green circles), 17 NAC DTMs (red rectangles), and 23 Mini-RF S-band products (blue rectangles).Three yellow rectangle frames as examples show the crater samples.The basemap is the LRO Lunar Orbiter Laser Altimeter(LOLA)shaded relief of the Moon, and the black curves outline the boundary between maria and highlands from Nelson et al.(2014).
The radar data we used are from Mini-RF,which operates at the S band(2.38 GHz,12.6 cm)and C band(7.14 GHz,4.2 cm)with a nominal incidence angle of ∼49°.The spatial resolution is 150 m for the baseline mode, and 15 × 30 m for the zoom model(Nozette et al.2010).The Mini-RF instrument utilizes a hybrid polarimetric architecture, which transmits a left-hand circular polarized signal and receives horizontal and vertical linear polarization echoes (Raney et al.2010).The Stokes parameters (i.e., S1, S2, S3, and S4) are derived from these two received polarization signals, and thus the radar backscattered power (e.g., σscfor the same-sense circular echoes and σocfor the opposite-sense circular echoes) and CPR (CPR=σsc/σoc)can be calculated (e.g., Fa et al.2011; Thompson et al.2011).Given that previous studies of crater physical properties widely used S-band zoom data and due to the wider coverage of Sband data across the lunar surface, we chose S-band zoom mode data to investigate mare sub-kilometer impact craters.The Mini-RF level 1 calibrated data are available from NASA’s Planetary Data System Geosciences node.These level 1 data were then processed using the USGS Integrated Software for Imagers and Spectrometers version 3 (ISIS3) to derive the orthorectified S1and CPR images.The detailed procedure and ISIS3 precessing scripts have been depicted in Fa & Eke(2018).We use S1images to manually co-register NAC images,as crater rims are very obvious in S1images.After finishing the co-registration of the NAC and S1images,the CPR images can be automatically co-registered to NAC images given to their consistency with S1images.
2.2.Sub-kilometer Scale Crater Samples(375 ≤D ≤800 m)
In this study, the selected sub-kilometer craters in the maria from two sources: one is from the lunar crater database in Robbins(2019,therein the last sentence in Section 6);the other is manually identification and selection from NAC images.The Robbins’crater database contains more than 0.7 million impact craters(D ≤1 km)across the lunar surface and each crater has 21 parameters (e.g., diameter, longitude, latitude, ellipticity[e]).To eliminate the potential secondary craters, we selected craters with e ≤1.1 from this database (e.g., Bottke et al.2000).Considering that lunar craters with diameters smaller than 300 m generally show different morphological types(e.g.,concentric terrace,and central mound)due to the heterogeneity in target strength (e.g., Oberbeck & Quaide 1967; Bart 2014;Fa et al.2014;Zhang et al.2023),to remain a consistent initial morphology type (simple bowl-shaped type) in our crater samples,we removed craters with diameter smaller than 300 m.
Given that the search range for the initial diameter is in 0.8–1 D when using the topographic diffusion model to estimate the crater absolute model age (see Section 2.4), we finally set the diameter range of crater samples to 375–800 m.Finally, we chose 260 crater samples with diameters of 375–800 m,including 60 craters from the database, and 200 craters from manual identification (Figure 1).As can be seen, these craters are located in different mare terrains (e.g., Mare Imbrium,Oceanus Procellarum,Mare Tranquillitatis),which enable us to investigate the physical properties of sub-kilometer craters and their evolution characteristics in mare regions.The sizefrequency distribution of these 260 craters is given in Figure A1(a).
2.3.Region Selections from Crater Interior and Exterior Regions
The accurate extraction of topographic and CPR profiles mainly depends on crater interior and exterior region selection.There are two factors that could bias the results.The first factor is that complex terrains (e.g., hills, grabens), or other geologic structures (e.g., large-scale superimposed craters) in crater interior and exterior can affect the extraction of radial elevation profiles.The other is that rocks and blocky ejecta produced from large or fresh superimposed craters could bias the CPR and overestimate the measured CPR values of crater samples.Basilevsky et al.(2013) mentioned that this phenomenon will potentially affect rock populations on crater rims.As few newly formed craters are found in their test areas that could excavate boulders, they proposed that such processes will not significantly change the survival time of meter-sized boulders.However, for this study, many fresh superposed craters exist due to larger study regions, which could excavate additional rocks and thus bias CPR results, and therefore, we prefer to exclude superimposed craters.
To exclude contamination of rocks and boulders from other large or fresh craters superposed in the study regions, we manually inspected and selected interior and exterior regions for each crater sample using ArcMap 10.6.The continuous ejecta blanket is defined as an annular zone that extends 2.5 crater radii from the crater center (e.g., Settle & Head 1977).The radius is measured as the horizontal distance between the crater center and the rim crest.We used the diameter defined in the elevation data, instead of the diameter measured in optical images, as the reference crater diameter when extracting topographic and CPR profiles.This is because the latter one is subject to the illumination condition of the optical image and the investigator bias when outlining the crater rim (e.g.,Robbins et al.2014).The differences between optical and elevation diameters are shown in Figures A1(c) and (d).
2.4.Age Estimation from Topographic Degradation Model
Crater age estimation is critical to reveal the evolution characteristics of physical properties in interior and exterior proximal ejecta blanket regions.In this study, we use crater degradation states and absolute model ages derived from the topographic diffusion model (e.g., Soderblom 1970; Fassett &Thomson 2014).The crater degradation process is widely recognized as a diffusional process, which mainly results from the micrometeorite bombardment.Recent studies found that the diffusivity is not only time-dependent but also size-dependent(e.g.,Xie et al.2017;Fassett et al.2018b).Furthermore,Fassett et al.(2018b) revised the relationship between diffusion age and time for mare craters as:
where K1000m=kt, is the diffusion age for mare crater with a diameter of 1 km,k is diffusivity,and t represents time in Gyr.Xie et al.(2017) proposed a relationship between the K1000mand the diffusion age of craters with a diameter of D0as:
The procedure to derive the absolute model age of craters based on topographic data and the method in Fassett &Thomson (2014) is summarized below.First, we used NAC DTMs to extract the topographic profile of a crater.Second,we derived a series of crater elevation profiles in different degradation states through a topographic degradation model with the initial fresh elevation profiles in Cai & Fa (2020).Third, we determined the best-fitting profile, which best matches the topographic profile of each crater extracted from the first step.Finally, we could estimate the diffusion age(K[D0]) and initial diameter (D0) for each crater based on the best-fitting profile.According to these steps, we obtained the K1000mfrom Equation(2),and further derived the crater age by solving Equation (1).
3.Results
In this section,we first present the evolution characteristics of CPR in interior and exterior proximal ejecta blanket regions for mare sub-kilometer impact craters (D: 375–800 m).Then, we use the exponential function to model the decline rates of CPR in four radial regions and estimate their retention time before decreasing to background values.Finally, we perform a case study to investigate evolution behaviors in multiple remotesensing images for four craters with different degradation states.
3.1.Temporal Evolution of Radar CPR
We extracted the median CPR profile in a fixed radial bin(0.1R).The radial profile of the median CPR values for craters with different model ages is shown in Figure 2.In the initial stage (age<50 Ma), the crater interior and exterior proximal ejecta blankets generally show large median CPR values(∼0.50–0.64).Given that radar CPR is more sensitive to rocks and blocky ejecta from the surface and shallow subsurface,this phenomenon indicates that numerous rocks and blocky ejecta are exposed on the surface or buried in the shallow regolith layer (∼1–3 m depth; Fa & Eke 2018).Additionally, in the crater center region (0–0.4R), the occurrence of the largest median CPR has an 80 Myr delay after crater formation (i.e.,the CPR peak in the central region may not necessarily occur in the first ∼3 Ma).A probable explanation to this phenomenon is that boulders, rocks, and decimeter-to-centimeter scale clasts are transported from steep upper wall and rim regions to the crater center due to the gravity instability (i.e., mass wasting).This geologic process also probably accounts for the phenomenon that there is no evident local CPR peak in the upper wall regions (0.4–0.8R) in the first 100 Ma (Figure 2(a)).
However, obvious enhanced CPR occurs in the upper wall region beyond 100 Ma, and lasts for over one billion years(Figures 2(b) and (c)).This behavior likely results from slope decline in this region.As the crater degrades, the upper wall slope gradually decreases, and the material transportation process slows down.Under this circumstance, newly exposed rocks and blocky ejecta due to regolith overturning could be retained in this region.We note that the upper wall region also remains relatively steeper compared with other radial regions(e.g., central region), albeit the wall slope has decreased to some extent.Therefore, the newly formed regolith is hard to deposit and cover the outcropped rocks and blocky ejecta in this region.As a net erosion region, the upper wall region generally shows more elevated CPR than other regions and this characteristic is prominent over the crater lifetime.We will further quantify the decline rate of CPR and the potential retention time for CPR decreasing to the background value in this region in Section 3.2.
There is no noticeable CPR peak in the first 100 Ma at the crater rim region (0.8–1.2R), which is different from CPR behaviors of larger craters (D: 800 m–2 km) in Fassett et al.(2018a).In their results, a prominent local maximum of CPR occurs in this region.We propose that excavation and masswasting processes are probably responsible for this difference.First, a small population of rocks could be excavated from subsurface coherent bedrock layers due to the weaker shock pressure for smaller craters.Second, the mass wasting process can move rocks and decimeter-to-centimeter scale fragments from rim regions to the crater center in the beginning.Therefore, we find that elevated CPR occurs in the central region during the first 100 Ma (Figure 2(a)).Third, the exclusion of rocks and blocky ejecta excavated by fresh superposed craters in the rim region may also lead to this difference.Basilevsky et al.(2013) analyzed meter-size boulders on the rims of 12 lunar craters with diameters of 150–950 m.They found that the median survival time (i.e.,∼50% of boulders breakdown) of these boulders or rocks is∼40–80 Ma and that a significant decline of boulder density occurs in the first 50 Ma.Thus, their observations and interpretations also could explain this phenomenon (i.e.,subdued CPR peak in the rim region).
After more than ∼1.3 billion years (i.e., severely degraded craters), small CPR values (∼0.38–0.47) dominate in crater interior and proximal ejecta blankets regions (1.2–2.5R;Figure 2(c)), which is even smaller than ∼0.46–0.57 for old craters with similar degradation states given in Fassett et al.(2018a).We propose three possible explanations for this phenomenon: (1) we almost removed additional rocks and blocky ejecta produced by superposed impact craters in interior or continuous ejecta blankets.This process probably explains the major component of this difference, especially for older craters.(2) Craters in this study are smaller than those in(Fassett et al.2018a, D=0.8–2 km).Previous studies found that larger impact craters could excavate more meter-scale rocks than smaller craters and that the size of the largest ejecta depends on crater size (e.g., Bart & Melosh 2010; Watkins et al.2019).(3) The significant difference in crater numbers used in these two studies is also likely to cause this large discrepancy.Fassett et al.(2018a)selected 6206 crater samples to reveal the temporal evolution of median CPR for larger craters(800 m–2 km),which probably yields more statistically significant results.Our study focuses on 260 smaller craters that may introduce larger uncertainties due to the limited crater samples.However,we enlarged the sampling bin(i.e.,0.1R),to minimize the noise in extracting CPR median values compared with 0.05R taken in Fassett et al.(2018a).Though our study contains a smaller crater population, our results of physical properties and their evolution characteristics of sub-kilometer craters are robust and reliable.
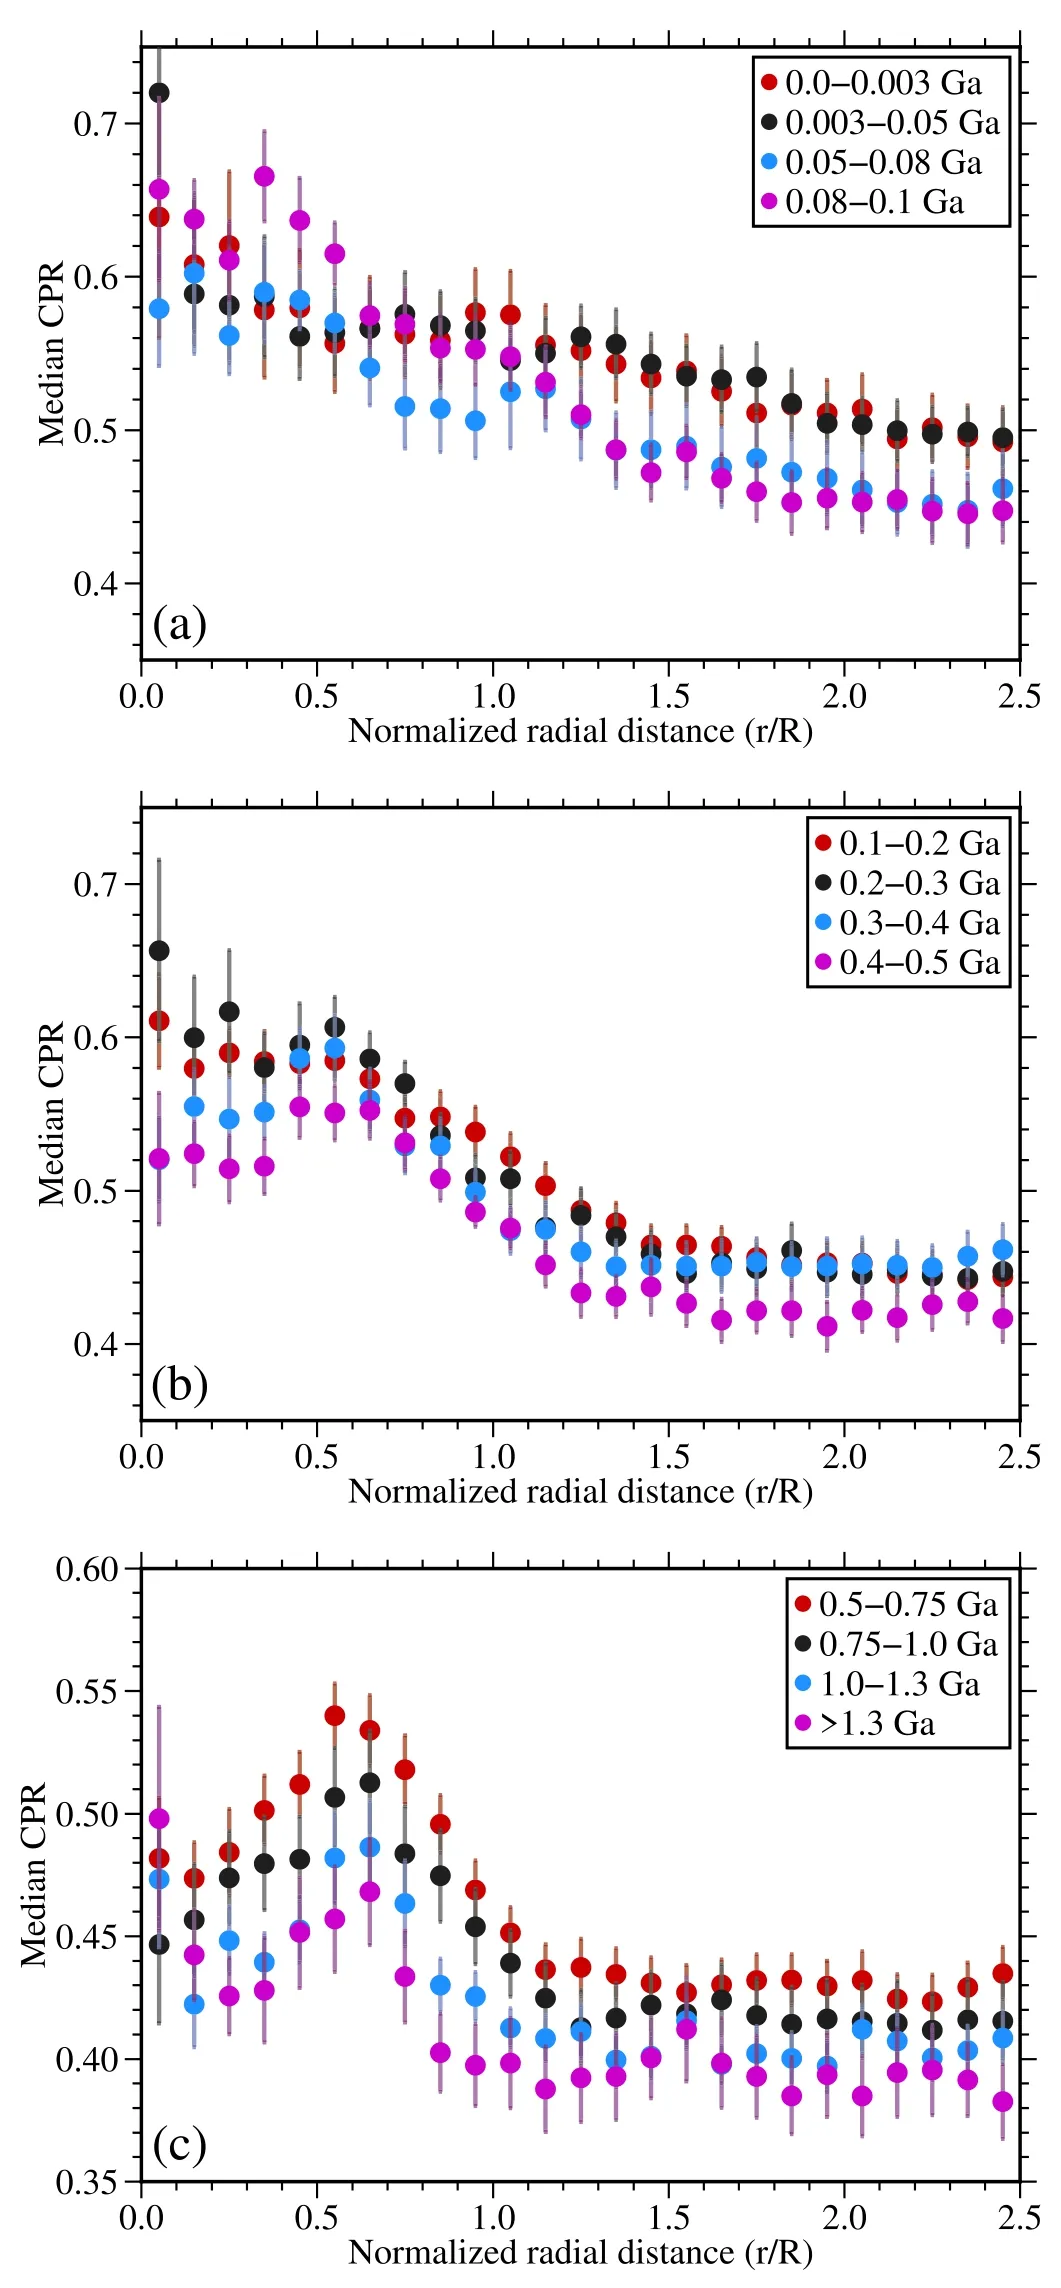
Figure 2.Radial profile of median CPR for craters (D=375–800 m) with different absolute model ages.The error bar represents the standard errors of CPR in each bin (0.1R).
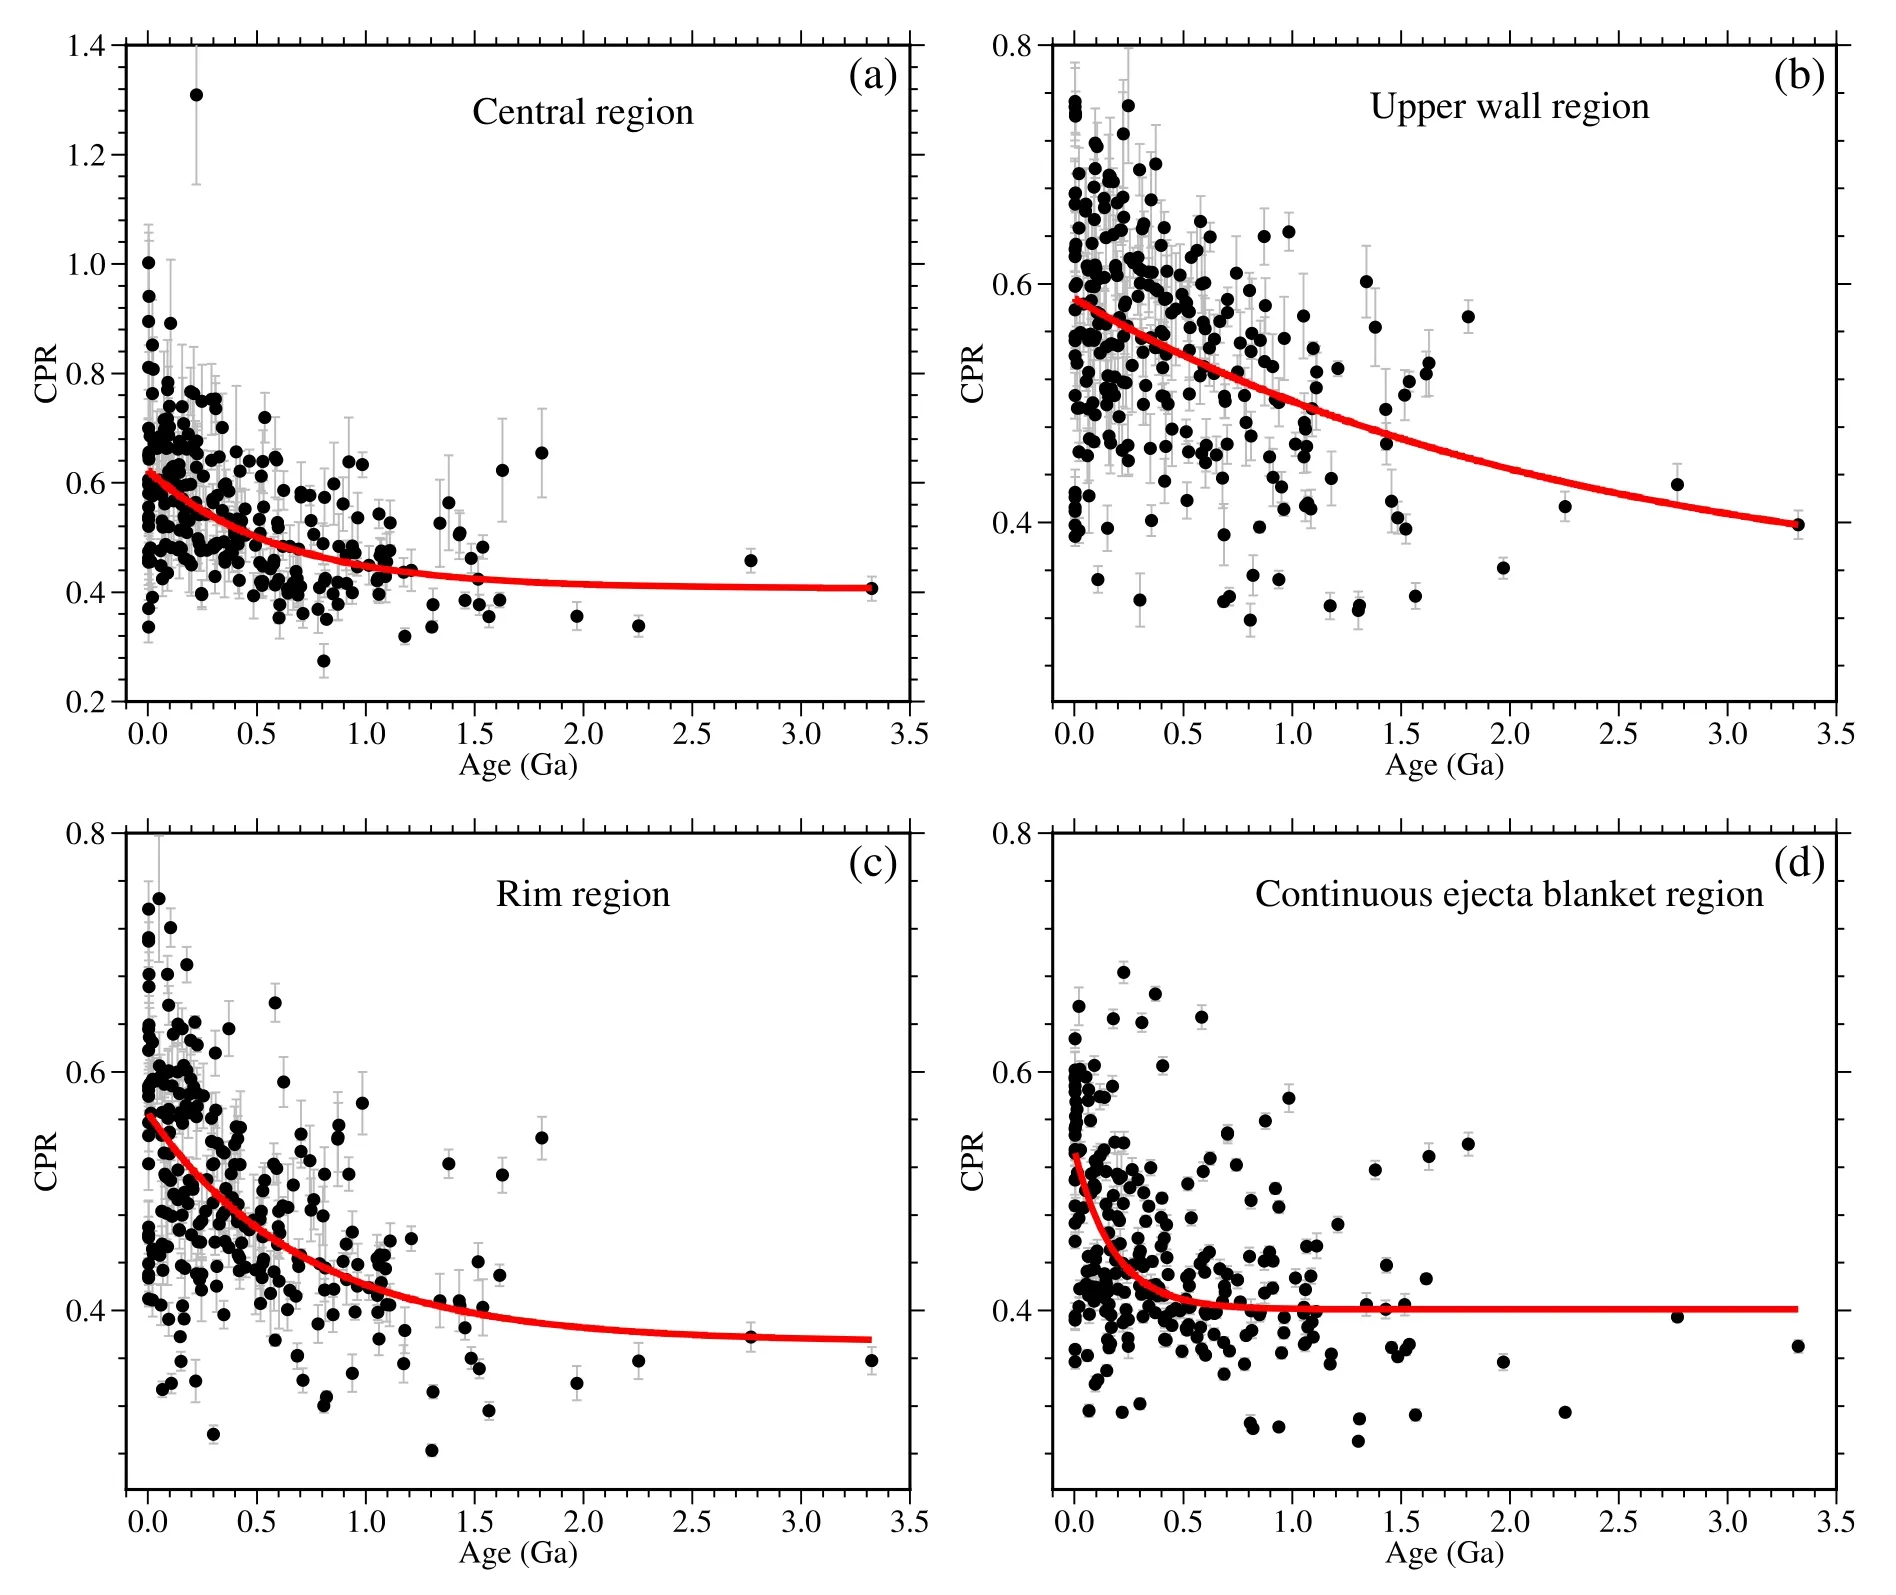
Figure 3.The CPR value as a function of crater age in four radial regions of a crater: (a) central region (0–0.4R), (b) upper wall region (0.4–0.8R), (c) rim region(0.8–1.2R),and(d)continuous ejecta blanket region(1.2–2.5R),where R is crater radius.The red solid curves show the best-fitting results and the vertical error bars represent the standard error of the CPR values.
3.2.Decline Rates of CPR in Different Radial Regions
We also investigated the decline rate of CPR values in different radial regions, including the central region, the upper wall region, the rim region, and the continuous ejecta blanket region.Figure 3 shows CPR values as a function of model age in these four radial regions.We used an exponential decay function to fit these CPR values with repsect to age:
where t represents age, CPR0+CPRbrepresents the initial CPR for fresh craters,CPRbis the background value,and α is a constant indicating the decline rate of CPR.Table 1 shows the best-fit coefficients and their uncertainties of the exponential decay function.
The radar CPR generally decreases as crater age increases and decline rates in various radial regions are different.For example, the largest decline rate (α=∼5.55) occurs in the exterior continuous ejecta blanket region, and the smallest rate(α=∼0.41) is in the upper wall region.These two distinctive decline characteristics could be explained as follows.For the proximal ejecta blanket region, lower surface slopes prevent rocks and blocky ejecta from being uncovered by the overlying regolith.In addition,rocks and blocky ejecta continually break down due to later micrometeorite bombardments.However,for the upper wall region, mass wasting could replenish surface rocks significantly due to larger surface slopes and thus the CPR decreases to the background slowly.There are similar decline rates in the crater center (∼1.66) and rim (∼1.39).In the initial period after crater formation, the crater center possesses numerous rocks or blocky ejecta transported from the steep wall and thus has larger CPR values.As the crater further degrades, the mass wasting process is suppressed due to thesubdued slopes of crater walls, and the growth of regolith formation outpaces the blocks transported to the crater center thus radar echoes decrease.For the rim region, it is always characterized as a rocky surface for a fresh crater, which is supported by the local CPR peak shown in Figure 2(a), albeit subdued (e.g., Bart & Melosh 2010).Furthermore, large rocks or blocky fragments are also likely to migrate downslope into the crater interior, though surface slopes in this region are smaller than upper wall regions.Previous studies find that boulders at rims of old craters could be exhumed because of the downslope movement of overlying regolith(e.g.,Nypaver et al.2021).All the potential geologic processes together lead to a relatively lower decline rate of CPR in the rim region.
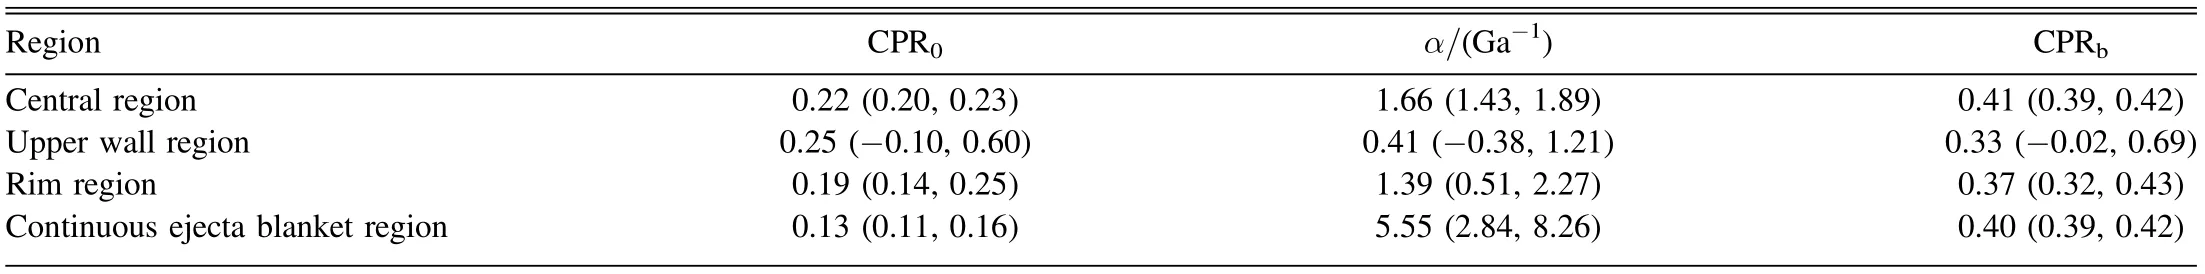
Table 1 Best-fit Coefficients in the Fitting of CPR Decay with Crater Age
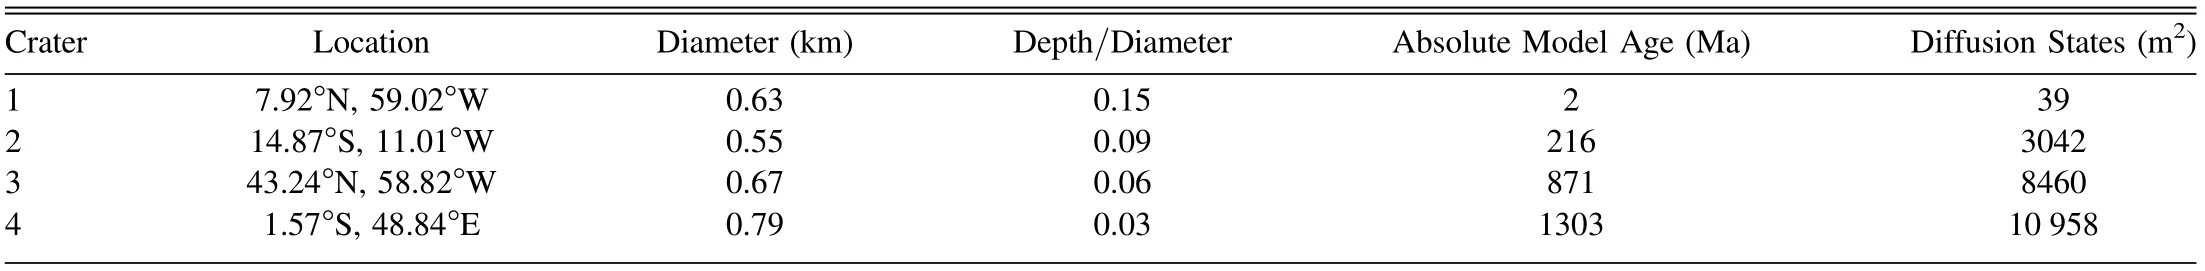
Table 2Information for these Four Impact Craters
These fitting results (Figure 3) indicate that the evolution processes of CPR can be described by an exponential function,which suggests that rocks and blocky ejecta perched on the surface and subsurface transport, break down, and are buried by fine-grained regolith rapidly in the first ∼0.5 Ga but slow down afterwards.In addition, from the fitting coefficients, we could further estimate the probable exposure time of rocks and decimeter-scale clasts,or the time length for CPR to decrease to background values in different regions.The timescales for 99%of rocks and blocky fragments being exposed and covered by regolith in 1–3 m are ∼2.0 Gyr (central region), ∼2.7 Gyr(upper wall region), ∼2.1 Gyr (rim region), and ∼0.6 Gyr(continuous ejecta blankets region).We note that the retention time in the upper wall region(i.e.,∼2.7 Gyr)represents a lower limit value.For sub-kilometer scale craters, this characteristic indicates that the CPR in the upper wall region is hard to reach background value over the crater lifetime.Given that the mass wasting process could last for a long time due to the large slope in this region, surface rocks are continually replenished until this process becomes inefficient.Because the 99% survival time of surface rocks on the rim of sub-kilometer scale crater is∼0.15–0.3 Ga (e.g., Basilevsky et al.2013), we could deduce that the rocks in the shallow subsurface persist for ∼2 Gyr.However, in exterior proximal ejecta blanket regions, the shortest time needed for CPR to reach background value also indicates that decimeter-to-centimeter scale rocks presumably dominate this region.These fragments will further break down due to later weathering processes (e.g., micrometeorite bombardment) and soon these fragmented rocks are invisible at radar wavelengths.
3.3.Case Studies of Individual Craters
The CPR in interior and exterior proximal ejecta deposits associated with mare sub-kilometer impact craters generally decreases with crater degradation.This evolution characteristic,potential decline rates, and survival time of CPR in different regions are concluded from all crater samples with obvious statistical significance.To more straightforwardly analyze the evolution characteristics of individual craters in optical,topography, and radar images, here, we use four craters with different model ages as examples to study their behaviors in detail (labeled as craters 1–4, Table 2, and Figures 4, and B1).
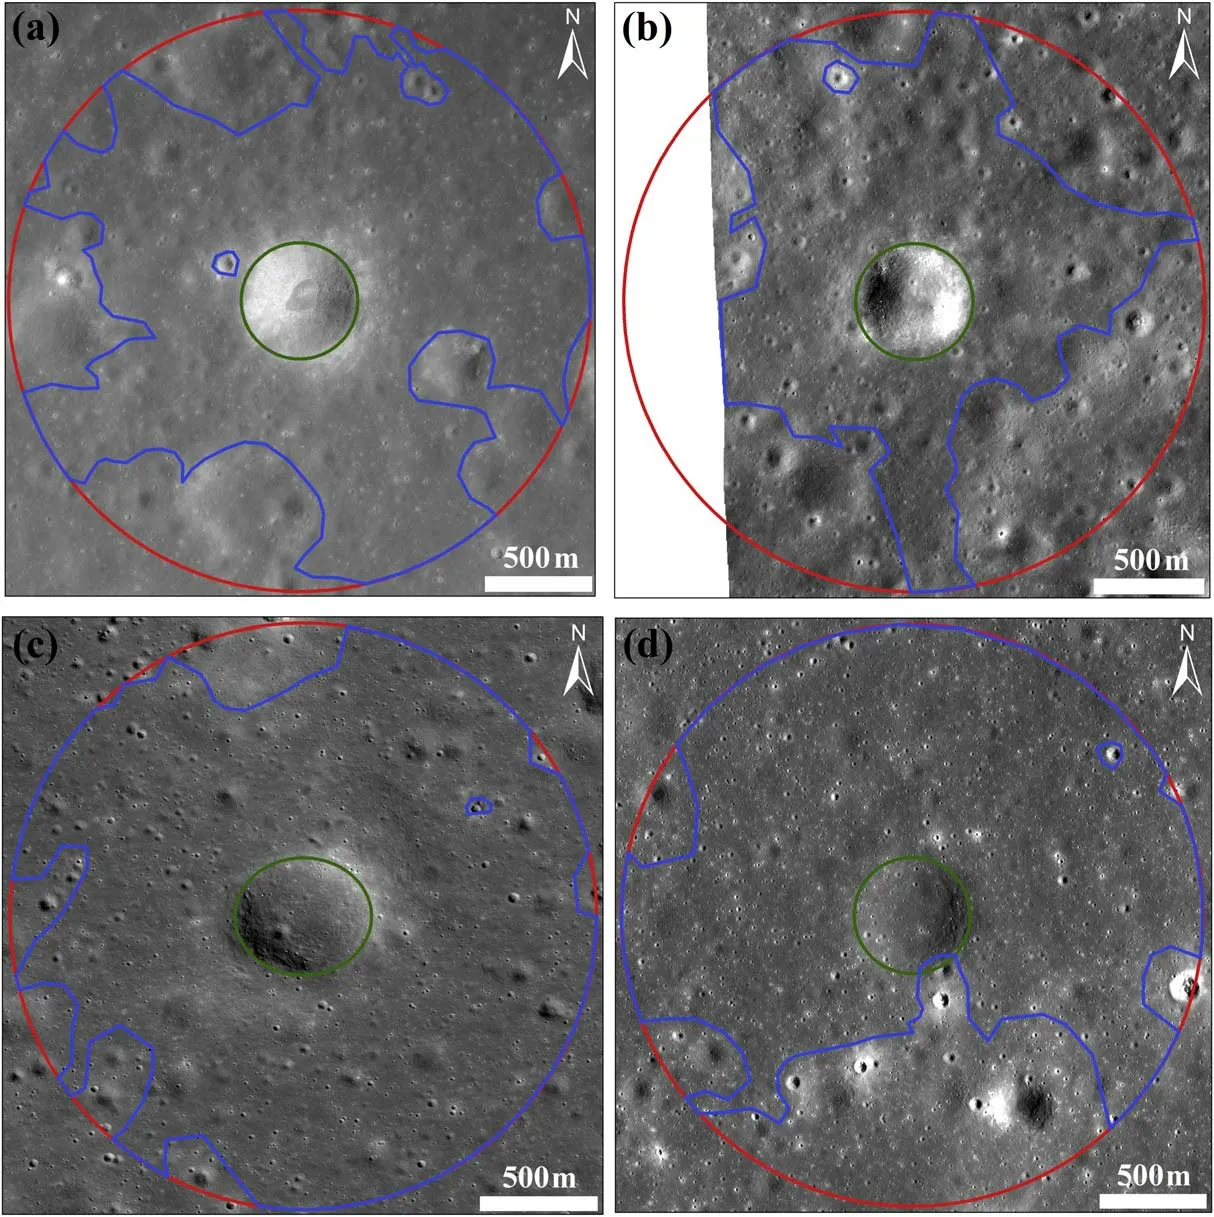
Figure 4.LROC NAC images for the four craters with different degradation states.The red circles represent 5R from crater center,and the blue curves represent the actual data range used to extract the topographic and radar profiles of craters after removing large or fresh superposed craters and complex geologic characteristics(e.g., hills, ridges).The green curves represent crater rim crests.(a) crater 1, (b) crater 2, (c) crater 3, and (d) crater 4.
From optical images shown in Figure 4, we could also determine the progressively increasing ages from crater 1 to crater 4 based on morphological features (e.g., slope, rock numbers, and superposed small craters; Basilevskii 1976).Figure 5 shows the topographic elevation, bidirectional slope,and CPR of crater interior and exterior continuous ejecta blanket regions for these four craters.From left to right, these craters become shallower, and the slopes decrease gradually,especially in crater interior regions.Furthermore,the CPR also generally decreases from crater 1 to crater 4.For the fresh crater 1, the elevated CPR occurs in interior and exterior regions,suggesting that a large population of rocks and blocky ejecta are strewn in the surface and subsurface.In contrast to crater 1, there are weak CPR enhancements in the interior and exterior regions of crater 2, indicative of the breakdown of rocks and blocky fragments with crater degradation.In addition, we find that larger CPR values only occur in the upper wall region for crater 3.We propose that mass wasting could replenish rocks and boulders due to larger slopes in this region, which supports our estimations, or the lowest decline rate of CPR in this region depicted in Section 3.2.As can be seen from Figure 4(c), there are only a few surface rocks, and this indicates that numerous subsurface rocks are present in the subsurface.The oldest crater 4 has the smallest CPR,implying that few rocks and blocks occur in the surface and subsurface,which are due to longer time of weathering processes such as micrometeorite bombardments and thermal cycling.
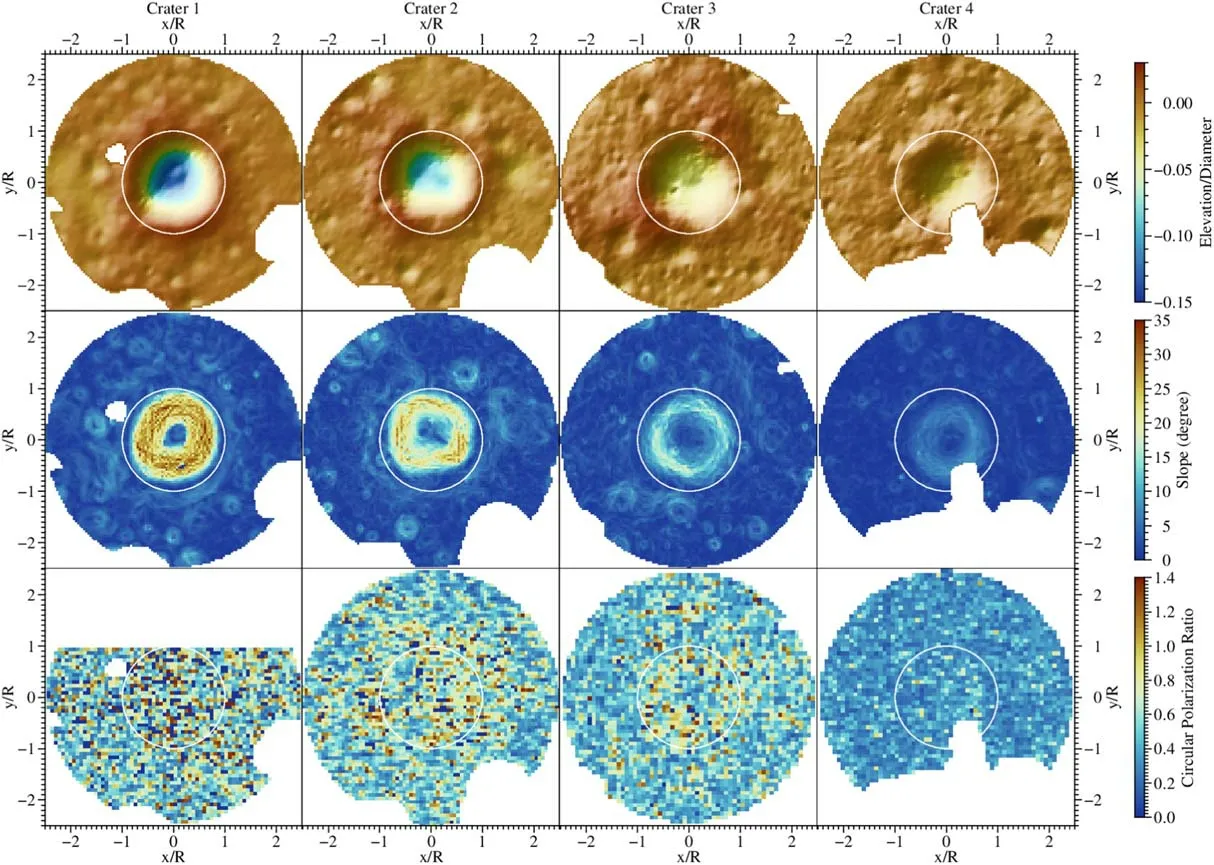
Figure 5.Normalized surface elevation (top), bidirectional slopes (middle), and CPR (bottom) of these four craters: crater 1 (the first column), crater 2 (the second column), crater 3 (the third column), and crater 4 (the last column).The white circles denote the rim locations.
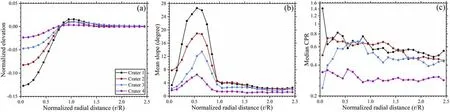
Figure 6.The radial profiles of (a) normalized elevation, (b) average slope, and (c) median CPR for the four sample craters.
The radial profiles of the elevation, slope, and CPR of these four craters are also given in Figure 6.According to the normalized elevation profiles,crater 1 has the largest relative depth, and the relative depth gradually decreases with crater degradation.In the crater interior region, the surface slopes also gradually decrease from crater 1 to crater 4,whereas the slopes in the exterior regions are not readily distinguished(Figure 6(b)).Additionally, the largest slopes occur in 0.5–0.7R and decrease with crater degradation.This phenomenon could help to explain that the local CPR peak occurs in the upper wall region over one billion years and that the lowest decline rate of CPR occurs in this region.Taking crater 3 and crater 4 for instance, an evident local CPR peak appears in the upper wall region.However, both crater 1 and crater 2 have elevated CPR in interior and exterior regions.The exterior average slopes of these four craters are four degrees smaller,which indicates that exterior continuous ejecta blankets are relatively flat and thus the mass wasting process is hard to develop or affect the CPR in any significant manner.Crater 4 has the smallest CPR values(∼0.3) whether in interior or in exterior regions compared with other craters.
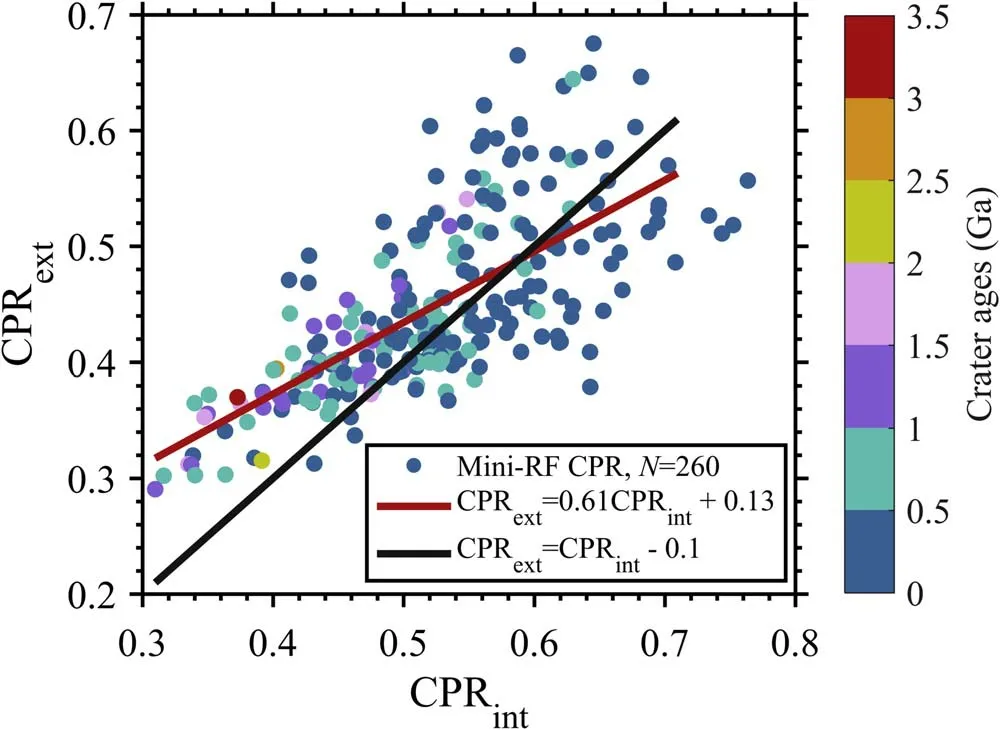
Figure 7.The exterior CPRext vs.interior CPRint for all crater samples.Different colors represent various ages.The red line represents the best-fitting linear relationship of CPR between interiors and exteriors.The black line represents the difference of 0.1 between interior and exterior median CPR,and anomalous craters are on the right of this line.
4.Discussion
4.1.Potential Radar Anomalous Craters
Radar CPR characteristics in the interior and exterior with different ages provide an effective reference to investigate potential radar anomalous craters.The anomalous crater is normally considered as the one with much higher CPRs in the crater interior than the exterior of the crater rim (e.g., Spudis et al.2010).To date, no consensus has been reached on the physical proxy to account for the formation mechanisms of radar anomalous craters at the poles, especially in the permanent shadow regions.There are two main arguments on formation mechanisms for lunar radar anomalous craters:one is water ice deposits (e.g., Spudis et al.2010; Thomson et al.2012),and the other is surface and subsurface rocks(e.g.,Fa&Cai 2013;Eke et al.2014).However,in the non-polar regions,or at low latitudes, rocks are the only agent producing this anomalous characteristic.
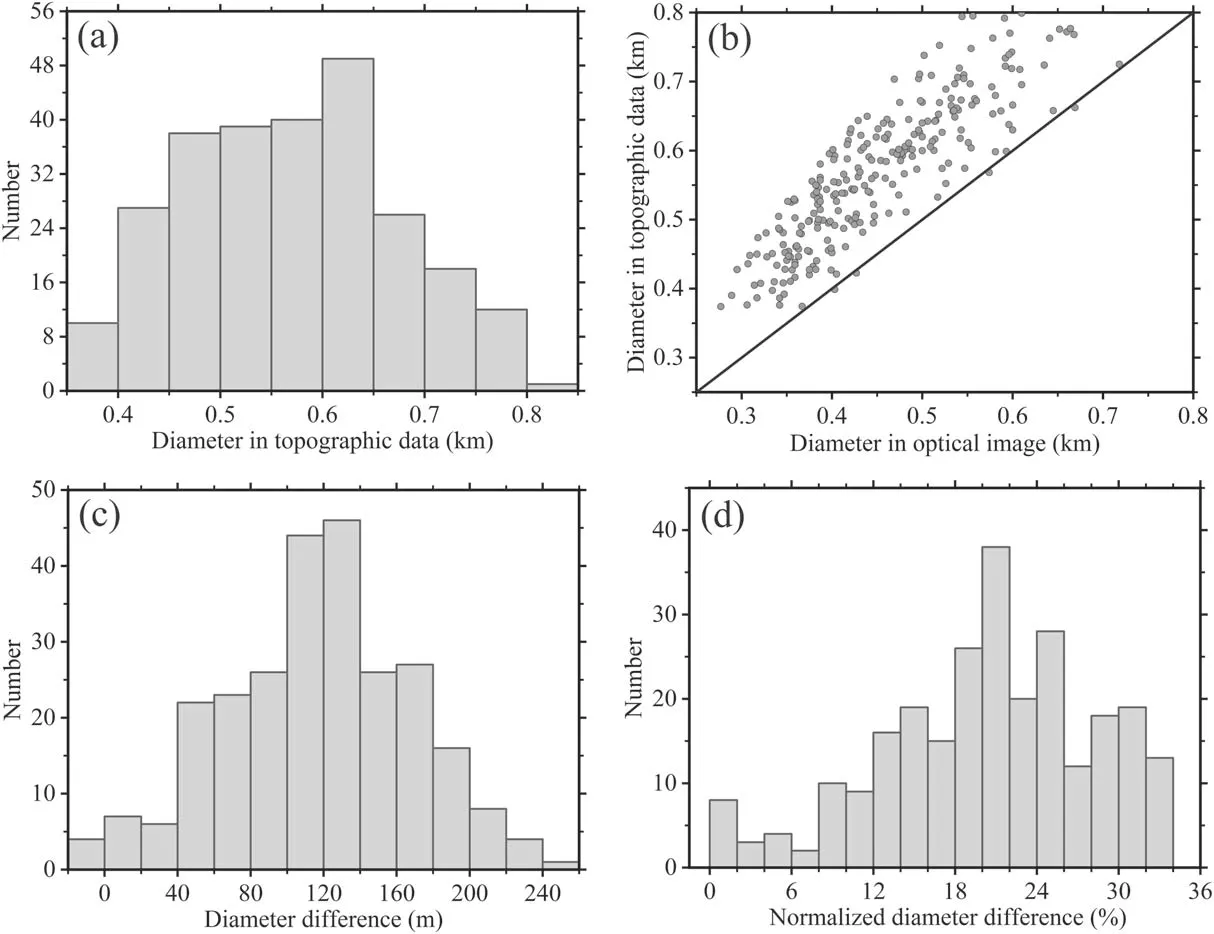
To investigate the survival timescale and evolution stage for potential radar anomalous craters,here,we used the definition of radar anomalous craters with △CPR=CPRint−CPRext≥0.1(Fa & Eke 2018).The CPRintrepresents the median CPR in the crater interior( Figure 8.The best-fit relationship of median CPR and surface average slopes(interiors and exteriors).The red and blue lines represent the best-fits in the crater interior and exterior regions.Error bars represent the standard error of CPR. We find that most anomalous craters occur with the ages of 2–1538 Ma, which is much smaller than previous studies for larger lunar impact craters (e.g., Eke et al.2014; Fassett et al.2018a; Fa & Eke 2018).In addition, 97% of anomalous craters have ages smaller than 1 Ga,with a median age of 0.23 Ga.We propose that the diameter difference could account for this discrepancy.Previous studies mainly focus on craters with larger diameters(>1 km).For example,Fa&Eke(2018)systematically analyzed 113 craters with diameters from 4.7 to 22 km and found anomalous craters could survive for ∼3 Gyr.Fassett et al.(2018a) find that more anomalous-looking craters are ∼1.5–2.5 Ga in age based on 6206 mare craters with diameters of 0.8–2 km.This obvious difference in survival time could be attributed to degradation rates, or alternatively, smaller craters normally degrade more rapidly than larger ones (e.g., Fassett &Thomson 2014).However,the evolution stages of the anomalous craters in these studies are similar, though their survival time is significantly different.Recent studies find that anomalous craters are of intermediate age based on depth-versus-diameter correlations (e.g., Eke et al.2014; Fa & Eke 2018).Given that the relative depth of anomalous craters approximately has a Gaussian distribution in this study,we used their average values as a more robust measure to present the evolution stage.The average depthto-diameter ratio of these anomalous craters is ∼0.08±0.03(mean±standard deviation).Assuming that the depth-todiameter ratio of a fresh normal crater with a diameter larger than 400 m is 0.2 (e.g., Stopar et al.2017), this average value could be regarded as an intermediate stage, which is also consistent with the evolution stage defined in Basilevskii (1976)for small lunar craters.In summary, our study supports this argument that radar anomalous craters will occur when craters evolve to the intermediate stage, which is independent of crater size.However, the occurrence timescale of anomalous craters is diameter-dependent, and anomalous characteristics occur at an earlier stage for smaller craters than for larger craters. Previously, most studies analyzed the effects of surface slopes on radar CPR with raw radar data (e.g., Chandrayann-1 Mini-SAR, and Mini-RF; Spudis et al.2010; Fa & Cai 2013;Spudis et al.2013).These raw radar data were not via rectified and thus parallax effect would severely distort the map locations of CPR.This phenomenon leads to uneven sampling in the crater interior region and the problem that the crater wall tilting away from Mini-RF dominates the crater interior in an unrectified CPR map, where a large local incidence angle also occurs.Given that large incidence angles generally produce elevated CPR, this unrectified map will cause a larger interior CPR value.In addition, Fa & Cai (2013) used eight typical craters to quantify the influences on CPR by wall slopes and found that the wall slopes change from ∼25° to 35° for a typical bowl-shaped crater.This slope range accounts for a∼30°difference in the local incidence angle in the crater inner wall,which will give rise to a variation of ∼0.2 for CPR.They also pointed out that radar data should be first rectified with topographic products to systematically analyze the effects of surface slopes on CPR. Following the research aforementioned,the rectified process for radar images is commonly performed in recent studies(e.g.,Eke et al.2014;Fa&Eke 2018).With these rectified Mini-RF data, they both find that elevated CPR generally occurs in upper wall regions due to large surface slopes, where the mass wasting process could replenish new rocks and thus remain large CPR.This phenomenon is also consistent with our finding that CPR values decrease slowly, and they are hard to reach background values over crater lifetimes in the upper wall region for smaller mare craters (see Section 3.2 for details).However, recent studies do not further investigate the general relation between CPR and surface slopes.For example, Eke et al.(2014)do not compare CPR and local slopes in detail due to the inaccurate alignment of CPR and topographic maps and the coarse spatial resolution of CPR (∼118 m). Our study also provides an opportunity for investigating the general relation between radar CPR and slope.Here,we divide surface slopes into interior and exterior slopes and reveal the potential relationship of them with CPR,respectively.Figure 8 shows the general relations between crater CPR and surface slopes.As can be seen, interior average slopes are generally larger than those in exterior regions.In addition, interior average slopes are mainly distributed within 4°–20°, whereas exterior average slopes are distributed within 1°–4°.This indicates that exterior regions are normally flat, whereas interior regions are generally steep, especially for the upper wall region.Furthermore, the median CPR values generally increase with increasing average slopes.According to the bestfitting coefficient between the interior and exterior regions(0.27±0.02 versus 0.33±0.03),we could deduce that exterior median CPR decreases at a slightly larger rate than that of interior median CPR.This quantified linear relation overall supports the evolution characteristics of CPR in the exterior proximal ejecta blankets, where the largest decline rate occurs as depicted in Section 3.2. Previous studies show that, among other parameters (e.g.,size and shape of the surface and subsurface rocks, roughness,dielectric permittivity), local incidence angle is the most important factor affecting radar CPR (e.g., Fa et al.2011).For Mini-RF with a fixed nominal incidence angle, the local incidence angle mainly depends on the surface slope.Our results show that the inner wall slope of a crater decreases as it degrades,and thus local incidence angle also changes with time(Figure 6).Thus, the observed CPR evolution might be due to slope evolution, not simply near surface rocks.Discriminating these two factors requires a quantitative relation between radar CPR and local incidence angle.In addition, the evolution of crater slope should be quantified through crater degradation modeling as well.All these will be considered in our future study. In this study, we systematically investigated the physical properties of interior and exterior proximal ejecta deposits and their evolution for mare sub-kilometer impact craters(D=375–800 m;N=260).We find an evident temporal trend of radar CPR in crater interior and exterior regions.In addition,more complicated evolution characteristics occur in the interior region compared with those in the exterior region.This phenomenon could be attributed to the fact that more diverse geologic activities (e.g., mass wasting, landslides) act on the interior region and thus the locations, comminution rates, and buried depths of rocks and blocky fragments differ between different stages in this region. The occurrence of the largest median CPR has an 80 Myr delay after crater formation in the crater central region.A probable explanation is that rocks and blocky ejecta are transported from the crater upper wall and rim regions into the central region due to the mass wasting process after crater formation.This geologic process also could partially account for no obvious local CPR peaks in the upper wall and rim regions in the first 100 Ma.Furthermore, in addition to mass wasting, the excavation process also plays a significant role in developing this phenomenon for the crater rim region.However, obvious CPR peaks occur in the upper wall region beyond 100 Ma and could last over one billion years.This CPR characteristic is strongly correlated with large upper wall slopes. We quantified the decline rates of CPR in different radial regions and found that the largest decline rate occurs in the exterior proximal ejecta blankets and that the smallest rate is in the upper wall region.Furthermore,the central and rim regions have similar decline rates.Fitting results of CPR decline processes suggest that rocks and blocky ejecta break down,transport,and are buried by fine-grained regolith rapidly in the first ∼0.5 Ga and then slow down afterward.In addition, the period over which rocks and decimeter-scale clasts are exposed and buried in the shallow subsurface layer in different regions is estimated to be ∼2.0 Gyr (central region), ∼2.7 Gyr (upper wall region),∼2.1 Gyr(rim region),and ∼0.6 Gyr(continuous ejecta blankets region).Here,the retention time(i.e.,∼2.7 Gyr)in the upper wall region represents the lower limit and this indicates that CPR in this region is hard to reach the background values over the lifetime of sub-kilometer craters. Potential radar anomalous craters occur in 2–1538 Ma after their formation, and 97% of anomalous craters are younger than ∼1 Ga, with a median age 0.23 Ga.These ages are much smaller than those reported in previous studies of larger craters.This phenomenon indicates that the retention time of radar anomalous craters depends on crater size.Additionally, the average relative depth of these anomalous craters is∼0.08±0.03, which could be regarded as an intermediate evolution stage of a normal crater.Our results also verify that an evident linear relationship exists between radar CPR and surface slopes. Our study is a crucial supplement to the investigation of the physical properties of lunar craters and could help us further understand the scale-dependent evolution of physical properties.In the future, we will focus on the physical properties of lunar polar craters, especially for those in permanent shadow regions, combined with multiple remote sensing observations and the radar scattering model.This will be of particular relevance for potential water ice detection,evolution characteristics of potential ice-bearing craters,and selections for landing sites and rover routes for lunar polar exploration missions in the future. Acknowledgments We appreciate Caleb I.Fassett for constructive and helpful review.We gratefully thank Dr.Min Ding, Dr.Minggang Xie,and Bojun Jia for their helpful discussions on improving methods in this manuscript and we appreciate Zhipeng Liu for his help in Mini-RF and NAC DTM data statistics.We acknowledge Stuart J.Robbins for sharing his crater database.We are grateful for members in LRO LROC and Mini-RF teams for releasing data to NASA PDS Geosciences Node(https://pds-geosciences.wustl.edu/dataserv/moon.html).This work was supported by the Science and Technology Development Fund of Macau (0020/2021/A1 and 0079/2018/A2),National Key Research and Development(2019YFE0123300),and the National Natural Science Foundation of China(12173004 and 41 941 002).This is PKU PRSL contribution 26. Appendix A Difference between Optical and Elevation Diameter Figure A1 shows the comparisons of crater diameters obtained in optical images and NAC DTMs.The smallest elevation diameter is 374±3 m (mean±standard deviation), and the largest elevation diameter is 803±6 m.As can be seen from panel(a),most craters are distributed in the 450–650 m diameter range.In addition, almost all the diameters measured in topographic data are larger than those measured in optical images(panel(b)).For diameter difference(panel(c)),the largest difference is ∼250 m,and the average difference is ∼117 m.We note that a negative diameter difference means that the optical diameter is larger than elevation diameter.Furthermore, we also normalized these diameter difference by the corresponding elevation diameter (panel (d)).From panel (d), we found that most normalized diameter difference ranges in 12%–34%. Figure A1.(a) Histogram of crater diameter that is obtained from topographic data, (b) scatter plot of diameters obtained in topographic data and optical images.Histograms of (c) diameter difference between the elevation diameter and optical diameter, and (d) diameter difference normalized by the elevation diameter. Appendix B Absolute Model Ages Figure B1 shows the fitting results of the crater absolute model age based on the topographic diffusion model for these four crater samples in Section 3.3.The formation ages among these four craters are from 2 to 1303 Ma,and the diffusion ages are from 39 to 10,958 m2.The red circles represent the measured elevations in different radial distances,and the black curves represent the best-fitting radial elevation profiles. ORCID iDs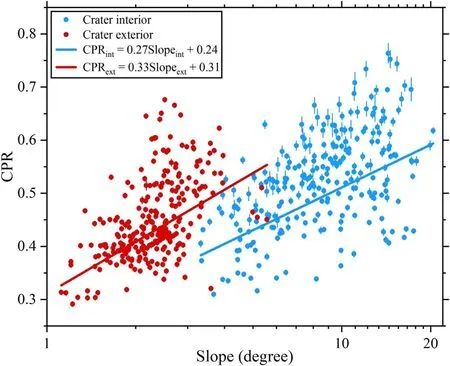
4.2.General Relation between CPR and Surface Slopes
5.Conclusions
杂志排行

Research in Astronomy and Astrophysics的其它文章
- Effect of Matching Algorithm and Profile Shape on Pulsar Pulse Time of Arrival Uncertainties
- A Revised Graduated Cylindrical Shell Model and its Application to a Prominence Eruption
- Predicting Gravitational Waves from Jittering-jets-driven Core Collapse Supernovae
- Redshift Dependence of the Low-energy Spectral Index of Gamma-Ray Bursts Revisited
- On the Nature of Long Period Radio Pulsar GPM J1839-10: Death Line and Pulse Width
- A Novel Imaging Method Based on Reweighted Total Variation for an Interferometer Array on Lunar Orbit