Effect of Matching Algorithm and Profile Shape on Pulsar Pulse Time of Arrival Uncertainties
2024-01-16WangVerbiestShaifullahandYuan
J.Wang, J.P.W.Verbiest, G.M.Shaifullah, and J.P.Yuan
1 Ruhr-Universität Bochum, Fakultät für Physik und Astronomie, Astronomisches Institut (AIRUB), D-44801 Bochum, Germany; jun.wang.ucas@gmail.com 2 Advanced Institute of Natural Sciences, Beijing Normal University, Zhuhai 519087, China 3 Fakulatät für Physik, Universität Bielefeld, Postfach 100131, D-33501 Bielefeld, Germany 4 Max-Planck-Institut für Radioastronomie, Auf dem Hügel 69, D-53121 Bonn, Germany 5 Florida Space Institute, University of Central Florida, 12354 Research Parkway, Orlando, FL 32826, USA 6 Dipartimento di Fisica “G.Occhialini,” Universitá degli Studi di Milano-Bicocca, Piazza della Scienza 3, I-20126 Milano, Italy 7 INFN, Sezione di Milano-Bicocca, Piazza della Scienza 3, I-20126 Milano, Italy 8 Xinjiang Astronomical Observatory, Chinese Academy of Sciences, Urumqi 830011, China 9 Key Laboratory of Radio Astronomy, Chinese Academy of Sciences, Nanjing 210008, China 10 INAF - Osservatorio Astronomico di Cagliari, via della Scienza 5, 09047 Selargius (CA), Italy Received 2023 May 24; revised 2023 September 15; accepted 2023 September 20; published 2023 November 15
Abstract For high-precision pulsar timing analysis and low-frequency gravitational wave detection, it is essential to accurately determine pulsar pulse times of arrival (ToAs) and associated uncertainties.To measure the ToAs and their uncertainties, various cross-correlation-based techniques can be employed.We develop methodologies to investigate the impact of the template-matching method, profile shape, signal-to-noise ratio of both template and observation on ToA uncertainties.These methodologies are then applied to data from the International Pulsar Timing Array.We demonstrate that the Fourier domain Markov chain Monte Carlo method is generally superior to other methods, while the Gaussian interpolation shift method outperforms other methods in certain cases,such as profiles with large duty cycles or smooth profiles without sharp features.However,it is important to note that our study focuses solely on ToA uncertainty, and the optimal method for determining both ToA and ToA uncertainty may differ.
Key words: methods: data analysis – (stars:) pulsars: general – methods: statistical
1.Introduction
The discovery of the first pulsar(Hewish et al.1968)opened up an entirely new domain in astronomy.Since then,more than 3300 pulsars have been discovered11Pulsar Catalogue V1.70: http://www.atnf.csiro.au/research/pulsar/psrcat/.(Manchester et al.2005).Among the discovered pulsars,a subset,known as millisecond pulsars (MSPs, Backer et al.1982), has been discovered to rotate with remarkable stability.By employing the pulsar timing approach, which entails precise measurement of pulse times of arrival (ToAs), MSPs can be utilized as tools for various extreme experiments, such as testing the equation of state of neutron stars (Lattimer & Prakash 2016), examining general relativity (Zhu et al.2015), and searching for lowfrequency gravitational waves (GWs, Antoniadis et al.2022).
Among the manifold applications, the detection and characterization of low-frequency GWs is one of the most remarkable research directions.In order to accomplish this goal, an ensemble of precisely timed MSPs distributed across the sky(known as a pulsar timing array or PTA)is required to be monitored and timed regularly (Foster & Backer 1990).Present PTA experiments include the European Pulsar Timing Array (EPTA, Chen et al.2021), the North American Nanohertz Observatory for Gravitational Waves (NANOGrav,Alam et al.2021),the Parkes Pulsar Timing Array(PPTA Kerr et al.2020),and the Indian Pulsar Timing Array(InPTA,Joshi et al.2018).These four PTAs have also joined forces as the International PTA (IPTA, Verbiest et al.2016) to further improve the sensitivity of PTAs.Also China and South Africa are organizing themselves for PTA initiatives and may join the IPTA community in the future.
In the specific pulsar timing operation, the precise measurement of ToAs and their associated uncertainties is essential.This process is typically achieved through cross-correlating observed pulse profiles with a standard template, either in the time domain or in the Fourier domain.However,when it comes to handling processes, not only does the template-matching method have a range of options, but also the creation of the template can be done in several ways.Wang et al.(2022)presented an overview and comparison of the different templates and timing techniques.In summary, Wang et al.(2022) examined template profiles derived from (a) the single brightest observation,(b)a combination of all observations,(c)a smoothed version of(b),and(d)a fully analytic profile.In the process of determining ToAs, three template-matching techniques, specifically the Fourier phase gradient shift (PGS,Taylor 1992), the Fourier domain Markov chain Monte Carlo(FDM) and the Gaussian interpolation shift (GIS, Hotan et al.2005) methods, were considered in that research.
As outlined in Taylor(1992),the profile of each observationcan be modeled as a scaled and phase-shifted version of the template T(φ) ,plus additional white noisen(φ) ,as follows,
Here, a and b represent arbitrary offset and scale factors,respectively, φ is the pulse phase, and τ is the phase offset between observation and template.Through template-matching approaches, ToAs and corresponding uncertainties can be derived from τ andn(φ).
Besides,the relationship between ToA uncertainty σToAand signal-to-noise ratio (S/N) is give by Lorimer & Kramer(2012),
where W is the width of the profile, Ssysand Smeanare the system equivalent flux density and the pulsar’s mean flux density, respectively.tobsis the integration time, △f is the observing bandwidth,P is the pulse period and δ=W/P is the pulse duty cycle.
Once ToAs and their corresponding uncertainties have been determined, least-squares fitting is typically performed to estimate pulsar parameters.Ideally, a perfect fit would yield a reduced chi-squared.However, thevalue obtained after the fit is often significantly different from unity.These disparities are primarily due to the incorrect estimation of ToA uncertainties, which could be caused by extra noise introduced during the data collecting and processing process (Verbiest &Shaifullah 2018).
If the fit of ToAs indicates that the fittedvalue deviates substantially from unity, a common practice is artificially altering ToA uncertainties to correct the inaccurate ToA uncertainties.To accomplish this, an EFAC (error factor, used to account for miscalibration of radiometer noise), or an EQUAD (error added in quadrature, accounting for additional uncorrelated noise, caused by pulse phase jitter) or both are usually introduced into the timing model to rescale the ToA uncertainties (Verbiest et al.2016).The revised ToA uncertainties,, can then be expressed as:
The system-dependent factor EFAC serves as an overall scaling factor to account for potential systematic errors in ToA measurement uncertainties (Alam et al.2021), while EQUAD represents an additional time-independent white noise contribution, such as jitter noise arising from stochastic phase and shape variations due to pulse-to-pulse fluctuations not fully averaged out within a given observation(Shannon et al.2014).
In principle,it could be rather simple to determine an EFAC or EQUAD value for each instrument-pulsar-frequency combination in the pulsar-timing data set,thus restoring theχr2value to unity.This approach has been widely employed in virtually every pulsar-timing analysis (e.g., Desvignes et al.2016).However, the application of EFACs and/or EQUADs is entirely ad hoc, as the reasons for these factors remain largely undefined or even entirely unknown.For instance,the EQUAD is often described as modeling pulse phase jitter, but when EQUAD parameters are compared to those anticipated from jitter studies, there is limited agreement (Verbiest et al.2016).Moreover, incorporating a substantial number of parameters into the model significantly increases the complexity of the noise analysis and consumes computational resources (Chen et al.2021).As a result, it is valuable to examine any possible sources of ToA uncertainty underestimation in order to enhance the dependability of ToA uncertainties and diminish the need for these ad hoc correction factors.
In this paper, we investigate three of the most frequently used methods for ToA determination and employ simulations to examine how the ToA uncertainties derived from these methods depend on the pulse profile shape and how they scale with the S/N of the observations.Section 2 provides an overview of the data set and simulations used.In Section 3 we test these three template-matching techniques on simulated pulse profiles and in Section 4 we present the results of simulations carried out with 65 pulse profiles from IPTA MSPs.Section 5 summarizes our findings.
2.Data Set and Template-matching Methods
The pulse profiles utilized in this study are sourced from the IPTA data release 2,12https://ipta4gw.org/data-release/featuring pulse profiles of 65 MSPs(Perera et al.2019).The IPTA data set comprises ToAs and profiles from three regional PTAs.Within this work, 42 templates generated with the Berkeley−Orléans−Nançay backend at the L-band at the Nançay telescope are included from the EPTA data.The central frequency and bandwidth for these data are 1398 MHz and 64 MHz, respectively.For NANOGrav,16 profiles were utilized,taken at the L-band with the Green Bank Ultimate Pulsar Processing Instrument(GUPPI, DuPlain et al.2008) at the Robert C.Byrd Green Bank Telescope (GBT) of the National Radio Astronomy Observatory.The remaining seven pulse profiles were acquired from the PPTA data portal13https://data.csiro.au/collection/csiro:11812(Dai et al.2015).
A summary of the pulse profiles used in this work is given in Table 1.The table includes the pulse periods P,the mean pulse widths for the L-band pulse profiles at 10% and 50% of theprofile peak (W10and W50respectively), and the corner frequency14The corner frequency is defined as the frequency at which the signal is reduced to meet the noise.of the profile’s power spectral density (PSD).For some of the pulse profiles exhibiting complex PSD shapes,e.g.,PSR J1911+1347,(see Figure 1),the higher frequency is listed outside brackets and the lower value within brackets.
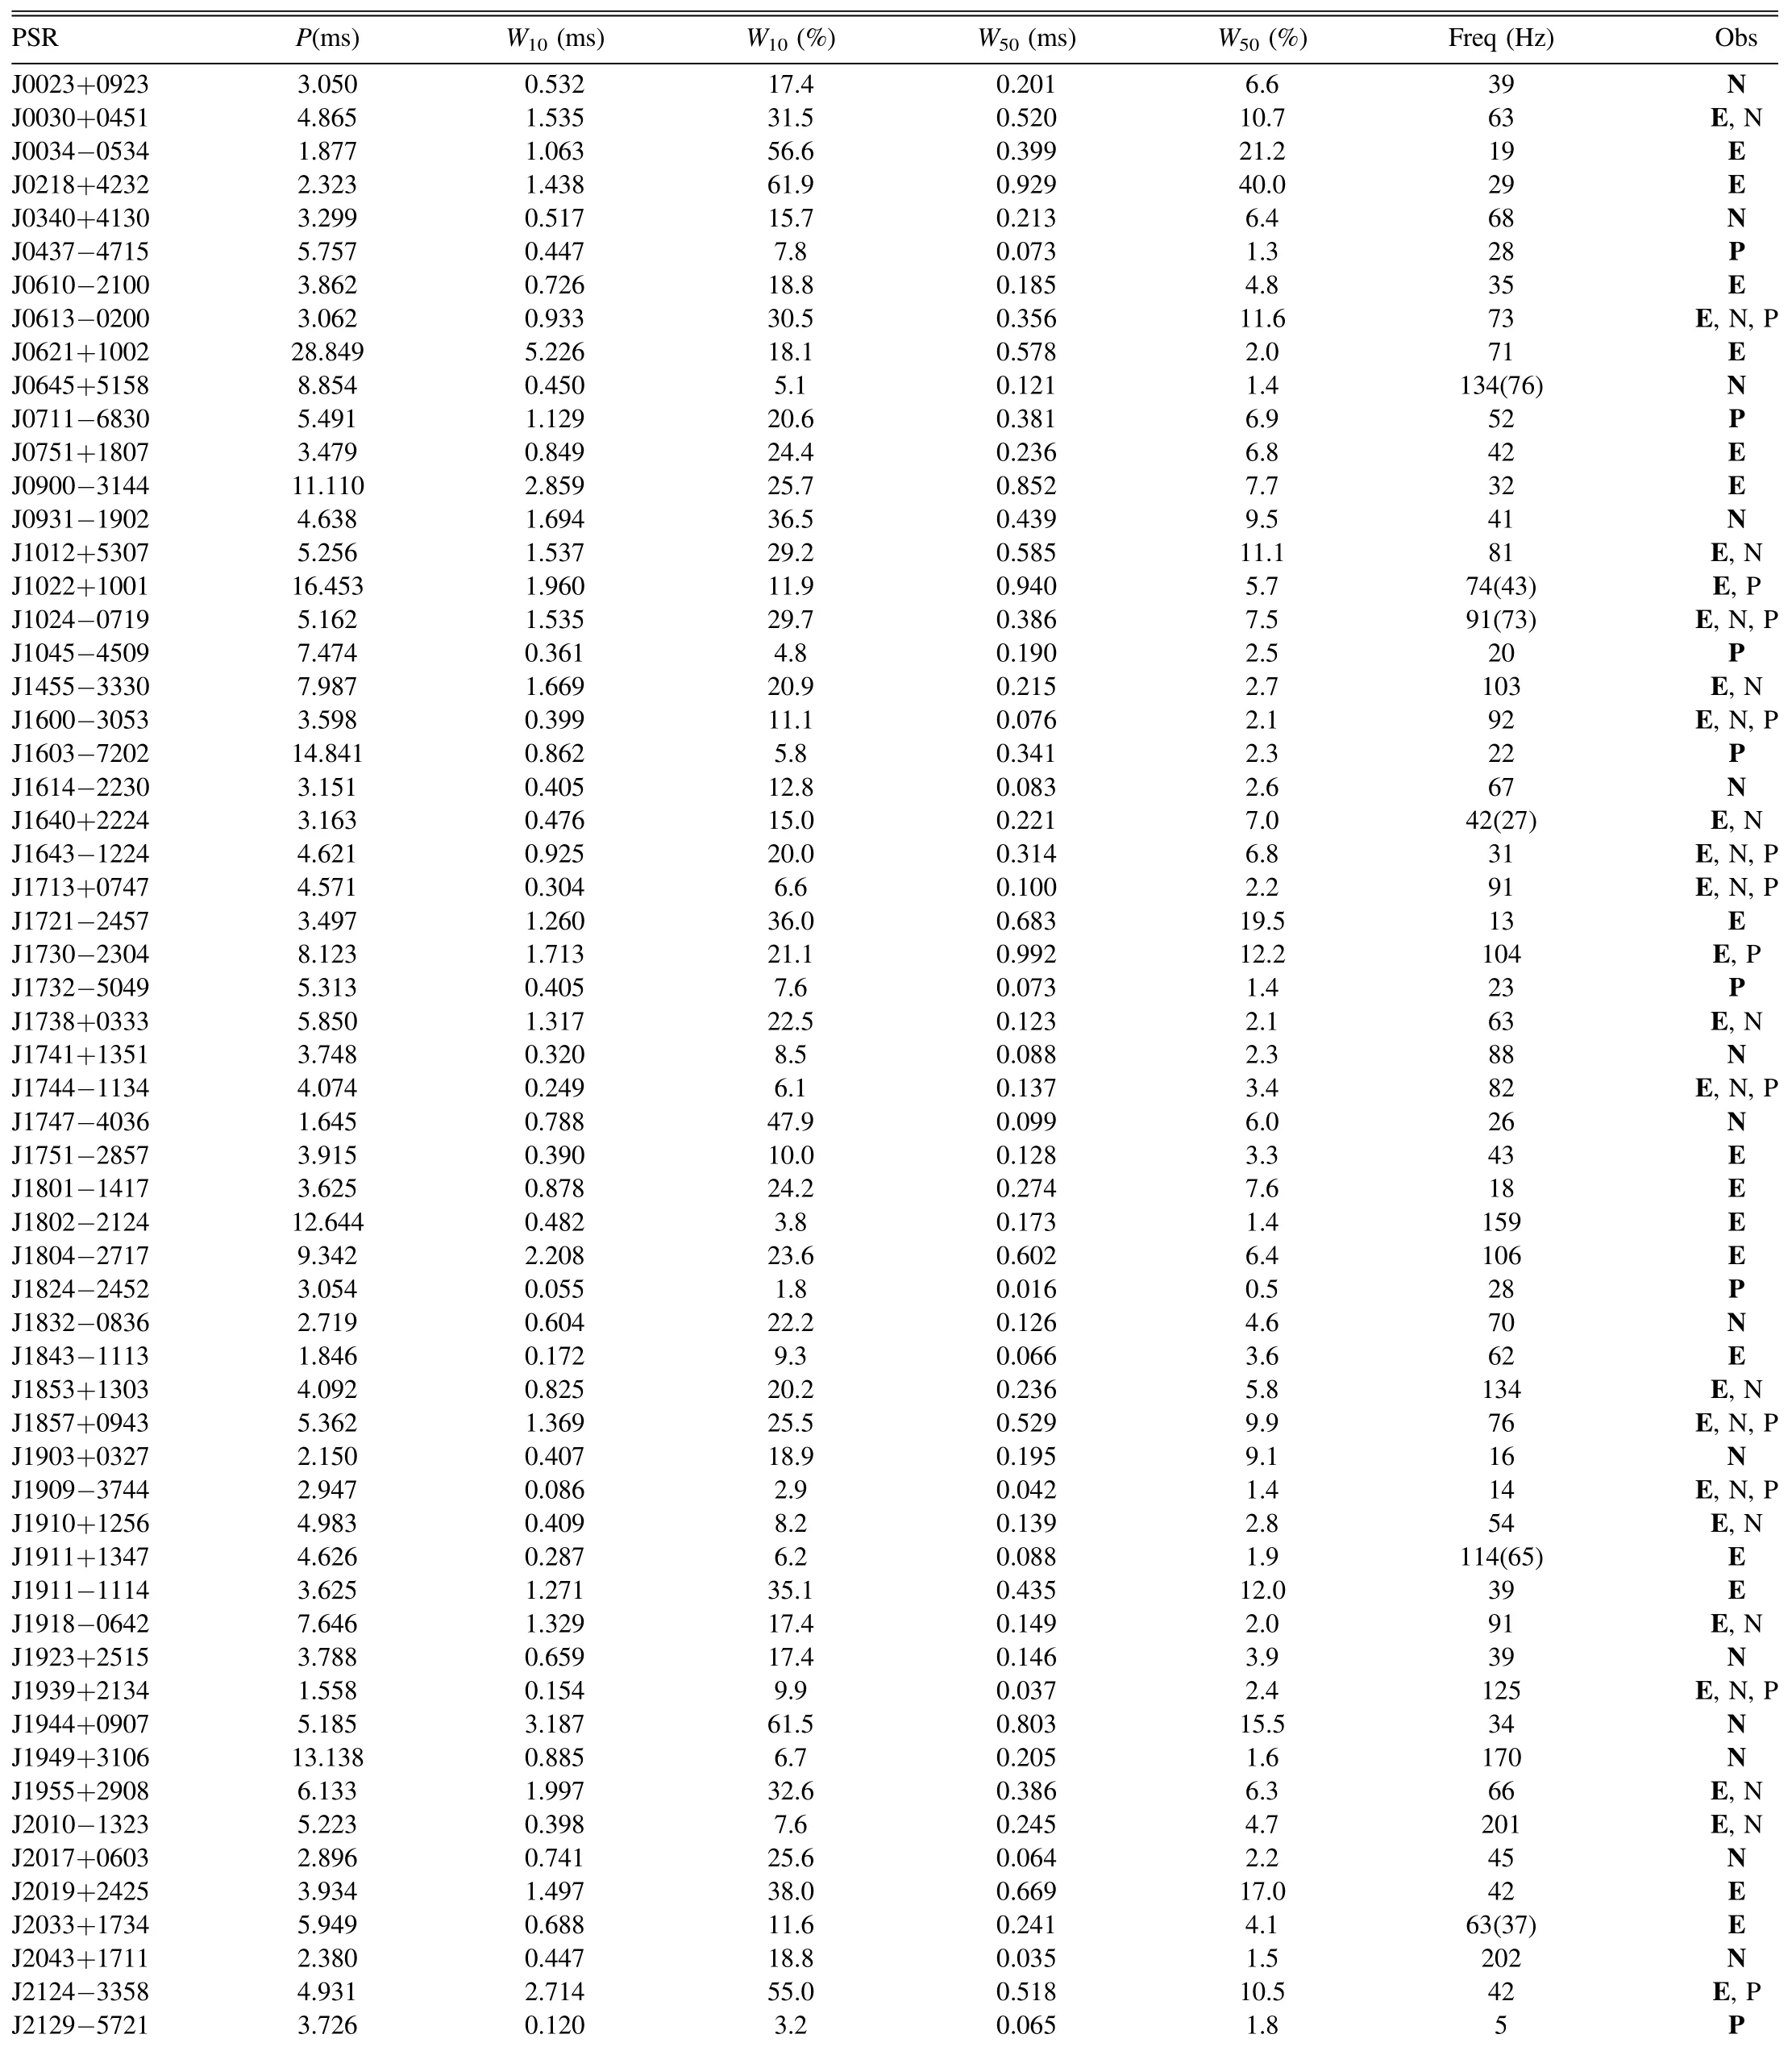
Table 1Basic Parameters for the Pulsar Profiles in our Sample
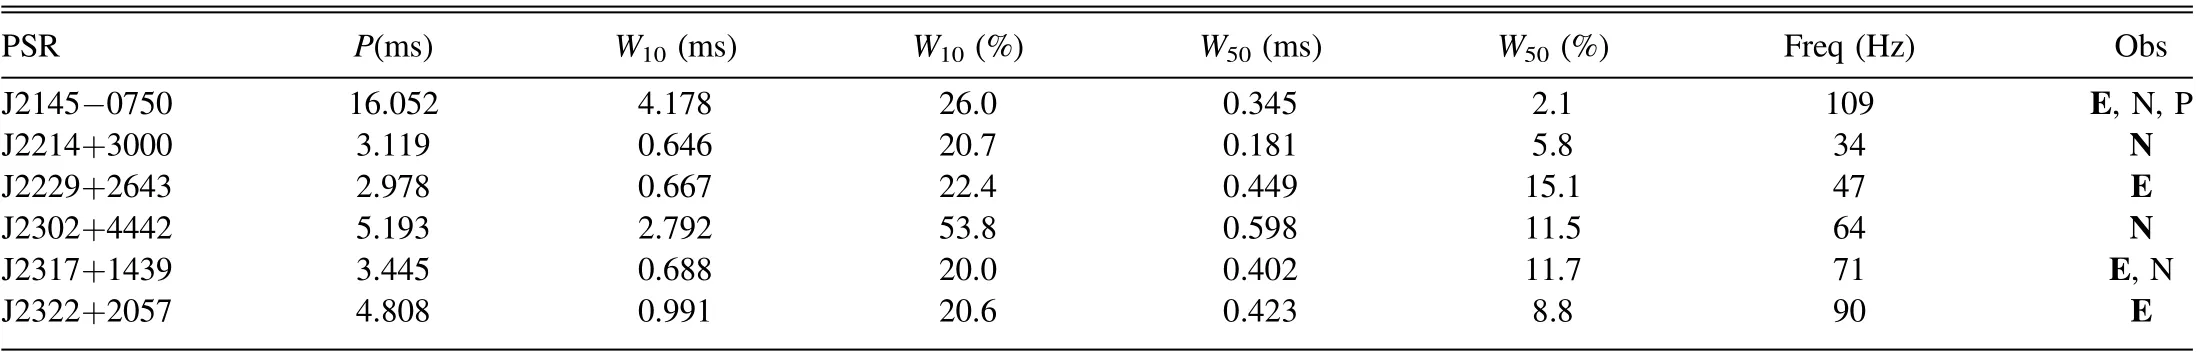
Table 1(Continued)
As a comprehensive set of tools for handling pulsar data,PSRCHIVE currently supports eight different template-matching methods(van Straten et al.2012).Below,we briefly outline the main characteristics of each method:
PGS: Fourier phase gradient shift.First described by Taylor(1992), this popular algorithm leverages the “shift theorem”of the Fourier shift, stating that the Fourier transform of a profile and a shifted copy of the profile differ solely by a linear phase gradient.The phase difference in the time domain can be determined by fitting for the gradient in the Fourier domain.A notable strength of this scheme is that the measurement precision is independent of phase resolution(Taylor 1992).However, its main weakness is the underestimation of TOA uncertainty in the low-S/N regime(Arzoumanian et al.2015).
FDM: Fourier domain Markov chain Monte Carlo.This scheme is identical to the PGS method in determining phase shift,but applies a one-dimensional Monte Carlo simulation when determining uncertainty, rather than a χ2minimization used in PGS.Theoretically, FDM can provide more reliable uncertainties for low S/N observations.
GIS: Gaussian interpolation shift.This method involves a standard cross-correlation of two profiles in the time domain.GIS fits a Gaussian curve to the discrete crosscorrelation function of two profiles and performs interpolation between each phase bin.The offset required to double the χ2is defined as the uncertainty (Hotan et al.2005).The timing precision of the approach can exceed 10% of a phase bin and is less susceptible to noise contamination (Hotan et al.2005).
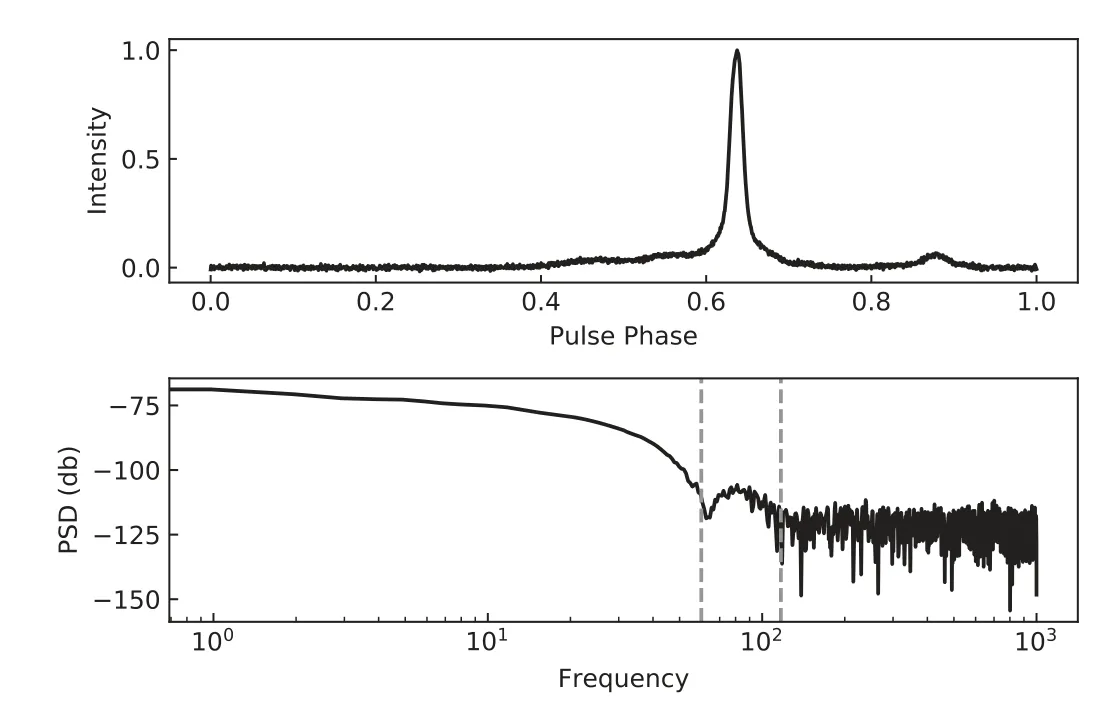
Figure 1.Pulse profile and PSD plots for PSR J1911+1347.The upper panel displays the averaged pulse profile,created using the EPTA data set,while the lower panel presents the PSD of PSR J1911+1347, consisting of 1000 frequency bins.A pair of dashed lines in the lower panel mark the determined corner frequencies.
PIS: Parabolic interpolation shift.PIS fits a parabolic function to the pulse profile and determines the location of the peak of the parabola.Although it is a computationally efficient and straightforward method, it is less accurate since it assumes that the pulse profile has a symmetric, parabolic shape.
SIS:Sinc interpolation shift.Similar to PIS,SIS interpolates the pulse profile using a sinc function and determines the location of the peak of the interpolated profile as the ToA.Theoretically,SIS is a more precise method for interpolating the pulse profile compared to PIS, but it necessitates careful adjustment of parameters (such as the order of the sinc function and the number of interpolation points).
ZPS:Zero padding interpolation shift.This technique involves zero-padding the pulse profile in the time domain and then carrying out a fast Fourier transform (FFT) to interpolate the profile in the frequency domain.The location of the maximum of the interpolated profile after the inversed FFT is taken as the ToA.This method is computationally more demanding than other interpolation methods and also requires meticulous parameter selection.
COF: Center of flux.The COF method operates by measuring the position of the center of the flux of a pulse profile.As it is based on the assumption that the pulse profile shape remains stable over time.This method may not yield accurate ToAs if the pulse profile changes.
RVM: Rotating vector model magnetic meridian.RVM is a geometric model employed to describe the polarization of electromagnetic radiation (Radhakrishnan & Cooke 1969).The RVM magnetic meridian is used to predict the position angle of the linearly polarized radiation emitted by the pulsar as a function of the pulse phase.By comparing the predicted position angle with the observed position angle,RVM can be utilized to determine the TOA of the pulse.RVM can provide high-precision measurements of ToA for stable pulsars, but can also introduce systematic errors due to inaccurate prediction of the pulsar’s magnetic field geometry.
In this paper, we initially analyze seven of these methods,15The RVM method requires polarization information to determine ToAs.Since our profiles obtained from the IPTA data set are all polarizationaveraged, RVM is not included in this study.through simulations of two sets of template data.Specifically,we begin with two noise-free templates: one is a simple narrow Gaussian profile,and another is a broader Gaussian profile with a shape feature.Varying levels of white noise are then injected to form observations of diverse S/N.We investigate ToA uncertainties as a function of the S/Ns for all seven templatematching methods.The results are displayed in Figure 2.As demonstrated, PIS consistently underestimates the uncertainty of the ToAs compared to other methods,particularly in the high-S/N regime, and the uncertainty obtained by the ZPS method is independent of S/N and thus completely unreliable.Additionally,SIS marginally performs better than ZPS and PIS, but its overall performance is essentially the same as the results obtained by the PGS algorithm.Consequently, in the subsequent detailed investigation, we will only discuss the other four templatematching methods, i.e., PGS, FDM, GIS, and COF.
3.Simple Gaussian Profiles
Before exploring the ToA uncertainties in various complex pulse profiles derived from real data, we employ simple Gaussian profiles, either with or without unique features in the on-pulse and off-pulse regions.A noise-free PSRFITSformatted profile is generated using the paas plugin in the PSRCHIVE software package.The corresponding Gaussian white noise is subsequently introduced into the PSRFITS file via the PSRCHIVE python interface and the numpy module,in order to attain the specified S/Ns.
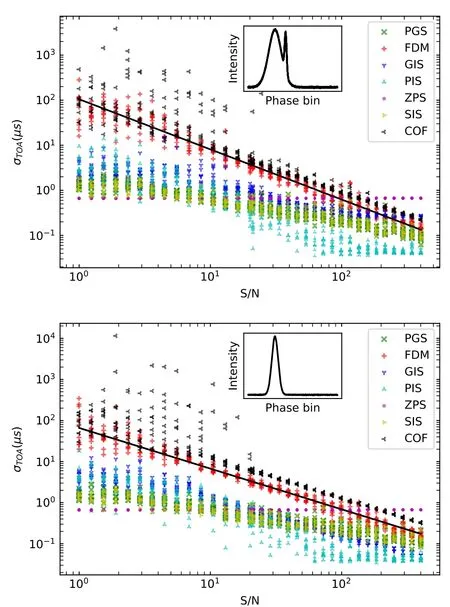
Figure 2.ToA uncertainties for two simulated Gaussian profile as a function of observations’S/N.In both panel,seven template-matching methods are shown with distinct colors and markers, as outlined in the legends.The upper panel displays the results obtained from a wide Gaussian profile with a notch,whereas the lower panel shows results obtained from a narrow Gaussian profile.The inset within each panel displays the corresponding template,possessing an S/N of 5000.
Initially, as depicted at the top of Figure 3, we examined pulse profiles with only a single Gaussian component.The PGS, COF and GIS timing algorithms are represented by distinct colors and markers in each panel, while the FDM timing algorithm is shown as red boxes.Outliers of the boxes are also presented,as indicated in the legend.Each panel’s inset depicts the standard profile of the template, all of which have an S/N of 5000.The solid black line in each panel represents a slope-fixed fit of FDM data at high S/N(>10),which has been extrapolated to the low S/N region.
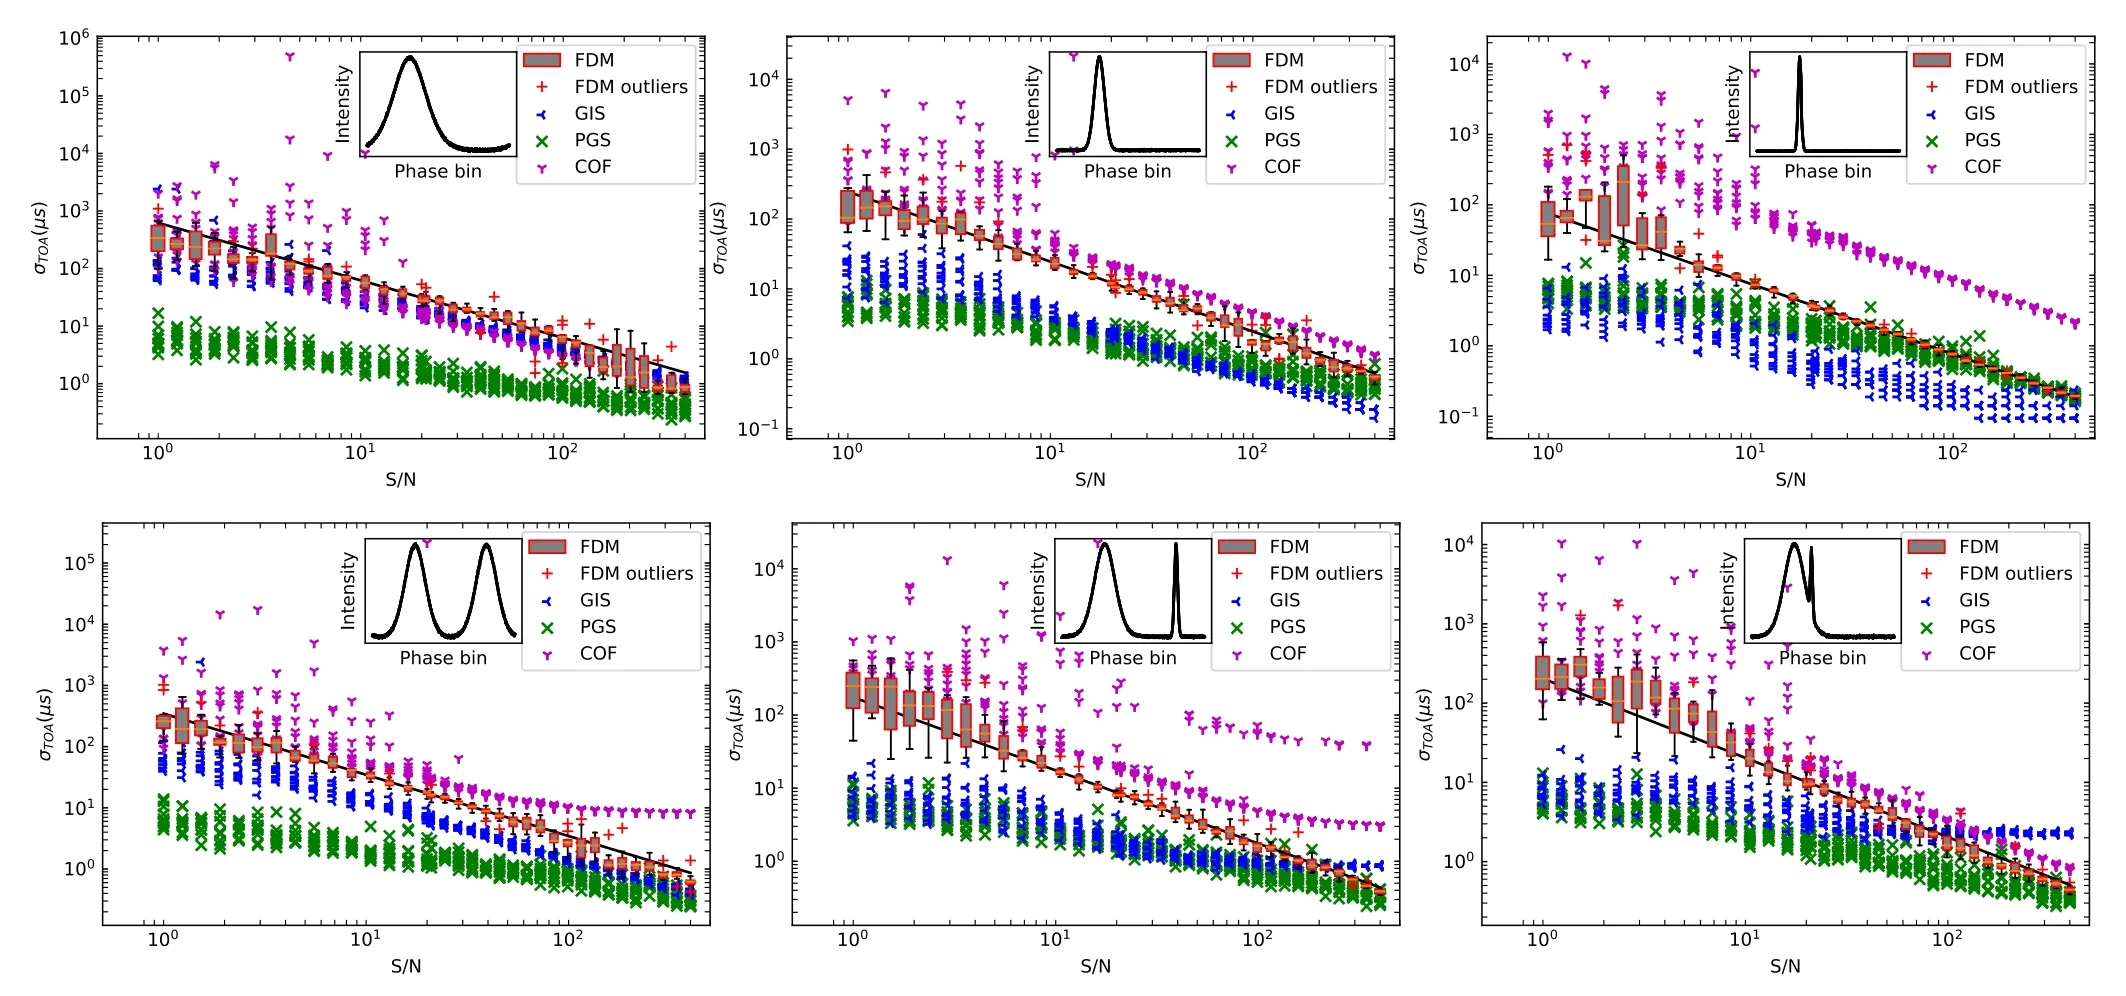
Figure 3.ToA uncertainties for various simple Gaussian profiles as a function of observations’S/N.In each panel,the PGS,COF,and GIS timing methods are shown with different colors and markers, while the FDM timing algorithm is presented with box plots in red color.Outliers of the box plots are shown, as indicated in the legend.The inset within each panel shows the profile of the standard template,which has an S/N of 5000.The solid black line in each panel represents a slope-fixed fit of FDM with S/N > 10, and extended to the low S/N region.
In Figure 3, we first investigated the impact of the overall width of the profile: the top row of Figure 3 displays a simple Gaussian pulse profile that is broad in the first column,average in the second column and narrow in the third column.Examining how the ToA uncertainties scale with the S/N of the simulated observations (on the X-axis), we observe that PGS does not scale as sharply as theoretically expected,suggesting that this algorithm either overestimates ToA uncertainties in the high-S/N regime or underestimates them in the low-S/N.It is worth noting that this behavior considerably improves for narrower profiles, particularly in the high-S/N regime.COF and GIS both seem to provide reliable scaling relations, but the absolute size of the returned ToA uncertainties are significantly affected by the width of the profile: for the same S/N, COF returns a much larger uncertainty if the profile is sharp, whereas GIS does the opposite, returning smaller ToA uncertainties for narrow profiles compared to wide profiles.In clear contrast to other methods,ToA uncertainties returned by FDM generally adhere to the expected scaling relationship and do not vary greatly depending on the profile’s width.
For further study, we also investigate profiles with two Gaussian components, as illustrated in the second row of Figure 3.Two independent wide Gaussian components, one narrow Gaussian component combined with a wide Gaussian component, and a broad pulse with a narrow notch, are shown from left to right.The profile with two broad Gaussian components yields similar results as the profile with a single broad component above, except that the COF method converges to a constant ToA uncertainty at S/N of ∼100 and above.For profiles with both broad and narrow components, GIS and PGS produce similar ToA uncertainties for low-S/N observations, but at high S/Ns, the ToA uncertainties determined with the GIS method converge to a constant.Surprisingly, ToA uncertainties determined by the PGS method at intermediate S/N for the profile with a notch component do not display the improved scaling evident for the single,narrow pulse profile on the top row.Instead,the PGS results appear to be dominated by the broad pulse component, remaining constant across the bottom row.
Subsequently, further simulations were conducted to examine the influence of the S/N of the template on the ToA uncertainties.We selected two Gaussian pulse profiles, one broad and one narrow,and then varied the S/N of the template to analyze the effect on the four template-matching methods.As depicted in Figure 4, we established the S/N ratios of the templates at 500, 1000, and 10,000, respectively, and then observed the variation of ToA uncertainty with the observations’ S/N and the different template-matching methods.
This comparison reveals that for the GIS method, the S/N of the template profile has no bearing on the scaling of the returned ToA uncertainties,but it does influence the absolute level of their uncertainties if the template profile is broad.However,for narrow template profiles the template S/N appears to have no effect.The ToA uncertainties of COF are,by definition,not impacted by the S/N of the template profile since this method does not utilize a template profile but instead calculates the center of flux of the observations.With regard to the third algorithm, PGS does not exhibit any noticeable effect from the template S/N.The results for FDM remain constant for sharp profile shapes, however for broad profiles, the scaling of ToA uncertainty with observations’S/N displays a break in the FDM case, suggesting an underestimation of ToA uncertainties in the high-S/N regime.The observational S/N at which this break transpires seems to rely on the template S/N and is thus more problematic for templates with low S/N.Specifically,it appears that the break occurs at an S/N approximately an order of magnitude lower than the template S/N, implying that the FDM algorithm would necessitate a template profile with S/N at least a factor of ten above the S/N of any single observation.

Figure 4.The ToA uncertainties for two types of simple Gaussian profiles,as functions of template S/N and four selected template-matching methods.The top row displays the results obtained using a broad template,while the bottom row displays results obtained using a narrow profile.In both rows,the S/N of each template was set to 500, 1000, and 10,000, from left to right.
4.EPTA Profiles
In this section, we start discussing the impact of diverse template-matching algorithms on real data, and we find an interesting phenomenon when choosing an appropriate S/N of the templates.We noticed that FDM exhibits instability in some specific cases.With certain pulsars, for instance, PSR J1721−2457, we find that FDM exhibits a noticeable jump at the junction between medium and high S/Ns (see Figure 5).This jump is largely related to the duty cycle of the pulse profile, the sharpness of the features and the S/N of the template.By comparing with other pulsars,we can see that the jump becomes pronounced when the duty cycle of the pulse profile is large and there are no particularly sharp features.Moreover,by employing a higher S/N of the template for these pulsars,we find that the jump smooths out as the S/N of the template increases, and vanishes when the S/N of the template is greater than approximately 5000.
For a more specific investigation, we present results for all 65 pulsars, with pulse profiles obtained from IPTA Data Release 2 (Perera et al.2019), we present results for all 65 pulsars in Figure A1.The captions are akin to Figure 3,except that the S/N of the templates are all set to 10,000 here.The plots were arranged in ascending order based on pulsar name.
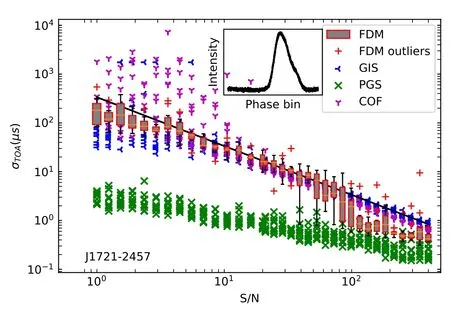
Figure 5.ToA uncertainties for PSR J1721−2457 as a function of observations’S/N and template-matching method,S/N of the template in this plot is set to 1000.A significant jump of ToA uncertainties appears in the median S/N region.
It is evident that the pulse profile has a considerable impact on the ToA uncertainties.In the majority of cases, such as PSRs J0610−2100 and J1614−2230,FDM offers a substantial advantage in determining ToA uncertainty, and accurately reflects the theoretically anticipated scaling with observations’S/N.Naturally, if the S/N of an observed profile with extremely sharp features is very low, as in the case of PSRs J1730−2304 and J2043+1711, FDM will also tend to overestimate the ToA uncertainty, as demonstrated in the previous simple Gaussian simulation.
In another case, PGS yields ToA uncertainties that progress with observations’ S/N in a similar manner for all examined pulsars: the gradient of this relationship is more gentle than anticipated theoretically, implying that either low-S/N observations have underestimated ToA uncertainties,or high-S/N observations have overestimated them.The sole exception to this pattern occurs with pulsars possessing very pronounced features:for those pulsars, ToA uncertainties of high-S/N observations exhibit the predicted trend,and in fact,align remarkably well with the ToA uncertainties derived by FDM.Even within this specific domain, however, ToA uncertainties variations are smaller for FDM than for PGS, suggesting that the FDM algorithm delivers even more dependable outcomes than PGS.
Regarding the third template-matching method,namely GIS,circumstances become somewhat more intricate.First, GIS generally appears to marginally underestimate ToA uncertainty at low S/N, frequently positioning itself between the PGS and FDM results.As the S/N progressively increases, the ToA uncertainty calculated by GIS initially steepens toward the theoretically expected scaling law, but subsequently plateaus entirely for intermediate to high-S/N observations.Additional simulations reveal that the S/N at which the GIS ToA uncertainties level off is unaffected by the S/N of the template,but is strongly influenced by the pulse profile shape.Specifically, for shorter duty cycles and pulsars with sharper features in the profile, ToA uncertainties plateau more swiftly.Prime examples include PSRs J1802−2124 and J1022+1001.In contrast, PSRs J1721−2457 and J0218+4232, for instance,possess a larger duty cycle and lack pronounced features.For this category of pulsar the ToA uncertainties produced by GIS scale impressively with observations’S/N and are comparable to, or competitive with, those yielded by FDM.
The fourth template-matching method we investigated,COF,consistently presents a ToA uncertainty greater than that provided by any of the other techniques,though its scaling with S/N closely aligns with the theoretical expectation.Another case is that, for pulsars with substantial duty cycles, e.g.,PSR J1721-2457, COF results closely approach FDM outcomes.However, at low S/Ns, COF persistently exhibits a more considerable scatter than FDM.In addition,in the context of multi-peak profiles, such as PSRs J1832−0836 and J2124−3358, it can be noticed that as observations’ S/N improves,the ToA uncertainty tends to stabilize, leading to a reduced linear correlation with the S/N of observations.
Lastly, we discovered no evident link between the template,template-matching method and corner frequency.Nonetheless,we observed a strong negative correlation between the PGS performance and the pulse profile’s duty cycle.For example,as the W50proportion gradually increases, the discrepancy between the ToAs obtained by PGS and the model prediction begins to grow,and a larger deviation emerges at moderate S/Ns.The ToA uncertainty also becomes more dispersed compared to the FDM method.Consequently, we believe that PGS is unsuitable for pulsars with a large duty cycle in the pulse profile.
5.Conclusions
High-precision pulsar timing experiments necessitate investigation into the reliable estimation of ToA uncertainty.The pulse profile’s shape,the template,the S/N of the observations,and the choice of template-matching method all influence the determined ToA uncertainty, and consequently, pulsar timing precision and low-frequency GW detection sensitivity.
Through simulations,we assessed the impact of template shape,the S/N of the observations, and the selection of templatematching algorithms on the accuracy of ToA uncertainties.We subsequently analyzed 65 real pulse profile shapes and conclude that the ToA uncertainty can be more accurately obtained.
In general, the FDM is distinctly more dependable than the other three timing algorithms when concentrating solely on ToA uncertainty.Its evolution with observations’S/N tends to align more consistently with theoretical expectations, and the ToA uncertainties acquired are less dispersed.Conversely, the PGS, GIS, and COF approaches either deviate significantly from the theoretical scaling or substantially scatter ToA uncertainties.
However in a few instances, such as when the pulse duty cycle is large, observations’ S/N is low or the pulse profile is smooth, GIS may determine a more accurate ToA uncertainty.Additionally, FDM encounters a ToA uncertainty jump in a specific S/N region, which is likely related to the characteristics of Markov chain Monte Carlo.
Crucially, we have demonstrated that FDM requires a template with an S/N at least an order of magnitude greater than the S/N of any of the observations.If this is not the case,it either risks underestimating the ToA uncertainty of the brightest observations or risks overestimating the ToA uncertainties of fainter observations, or a combination thereof.This is particularly relevant for pulse profiles with wide duty cycles and few or no sharp features.In practical terms(for nonscintillating pulsars), this means that FDM necessitates the combination of at least 100 observations into the added template.
Acknowledgments
We would like to express our gratitude to J.-M.Grießmeier for providing valuable suggestions.Additionally, we extend our thanks to the anonymous RAA referees for offering constructive feedback to enhance the quality of the article.J.P.W.V.acknowledges support by the Deutsche Forschungsgemeinschaft (DFG) through the Heisenberg program (Project No.433075039).
Appendix ToA Uncertainties versus Observation S/N and Template-matching
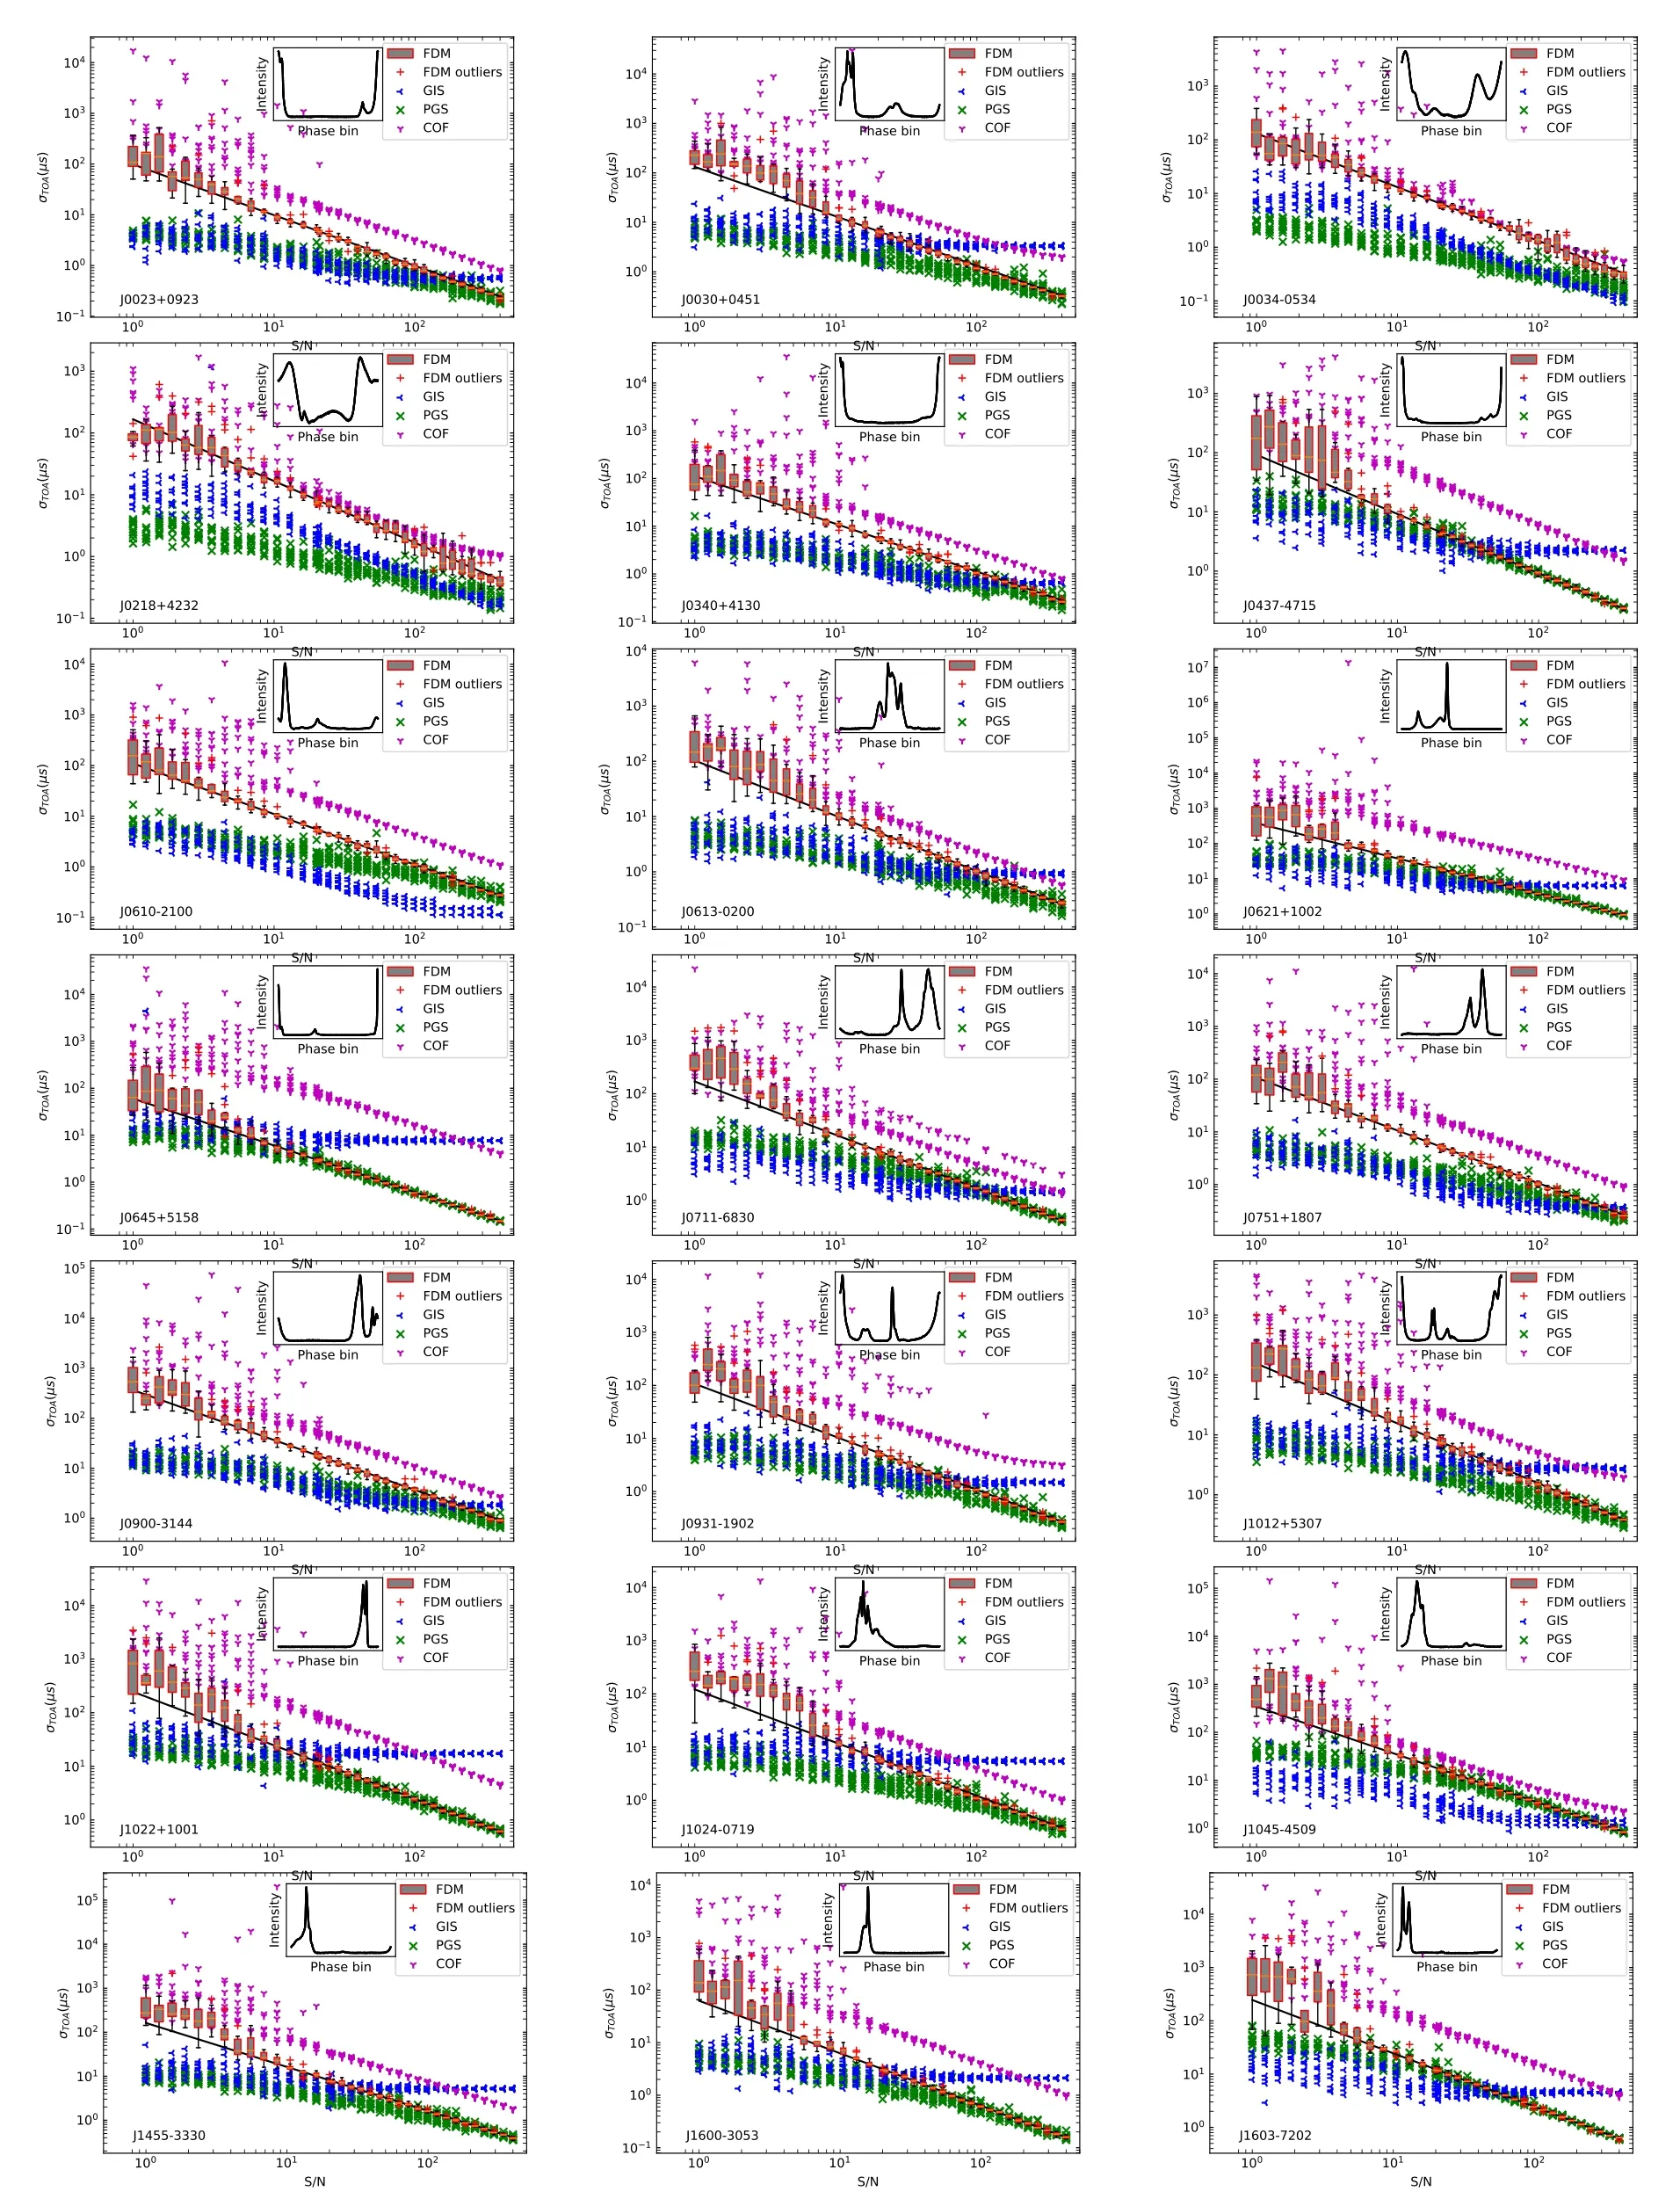
Figure A1.The ToA uncertainties for 65 MSP profiles were calculated as a function of the observation’s S/N and template-matching methods.Each panel displays the PGS,COF,and GIS timing methods using different colors and markers,while the FDM timing algorithm is presented using red box plots.Outliers of the box plots are shown in the legend.The inset within each panel displays the profile of the standard template, which has an S/N of 10,000.The solid black line in each panel represents a slope-fixed fit of the FDM method, with S/N > 10, extended to the low S/N region.
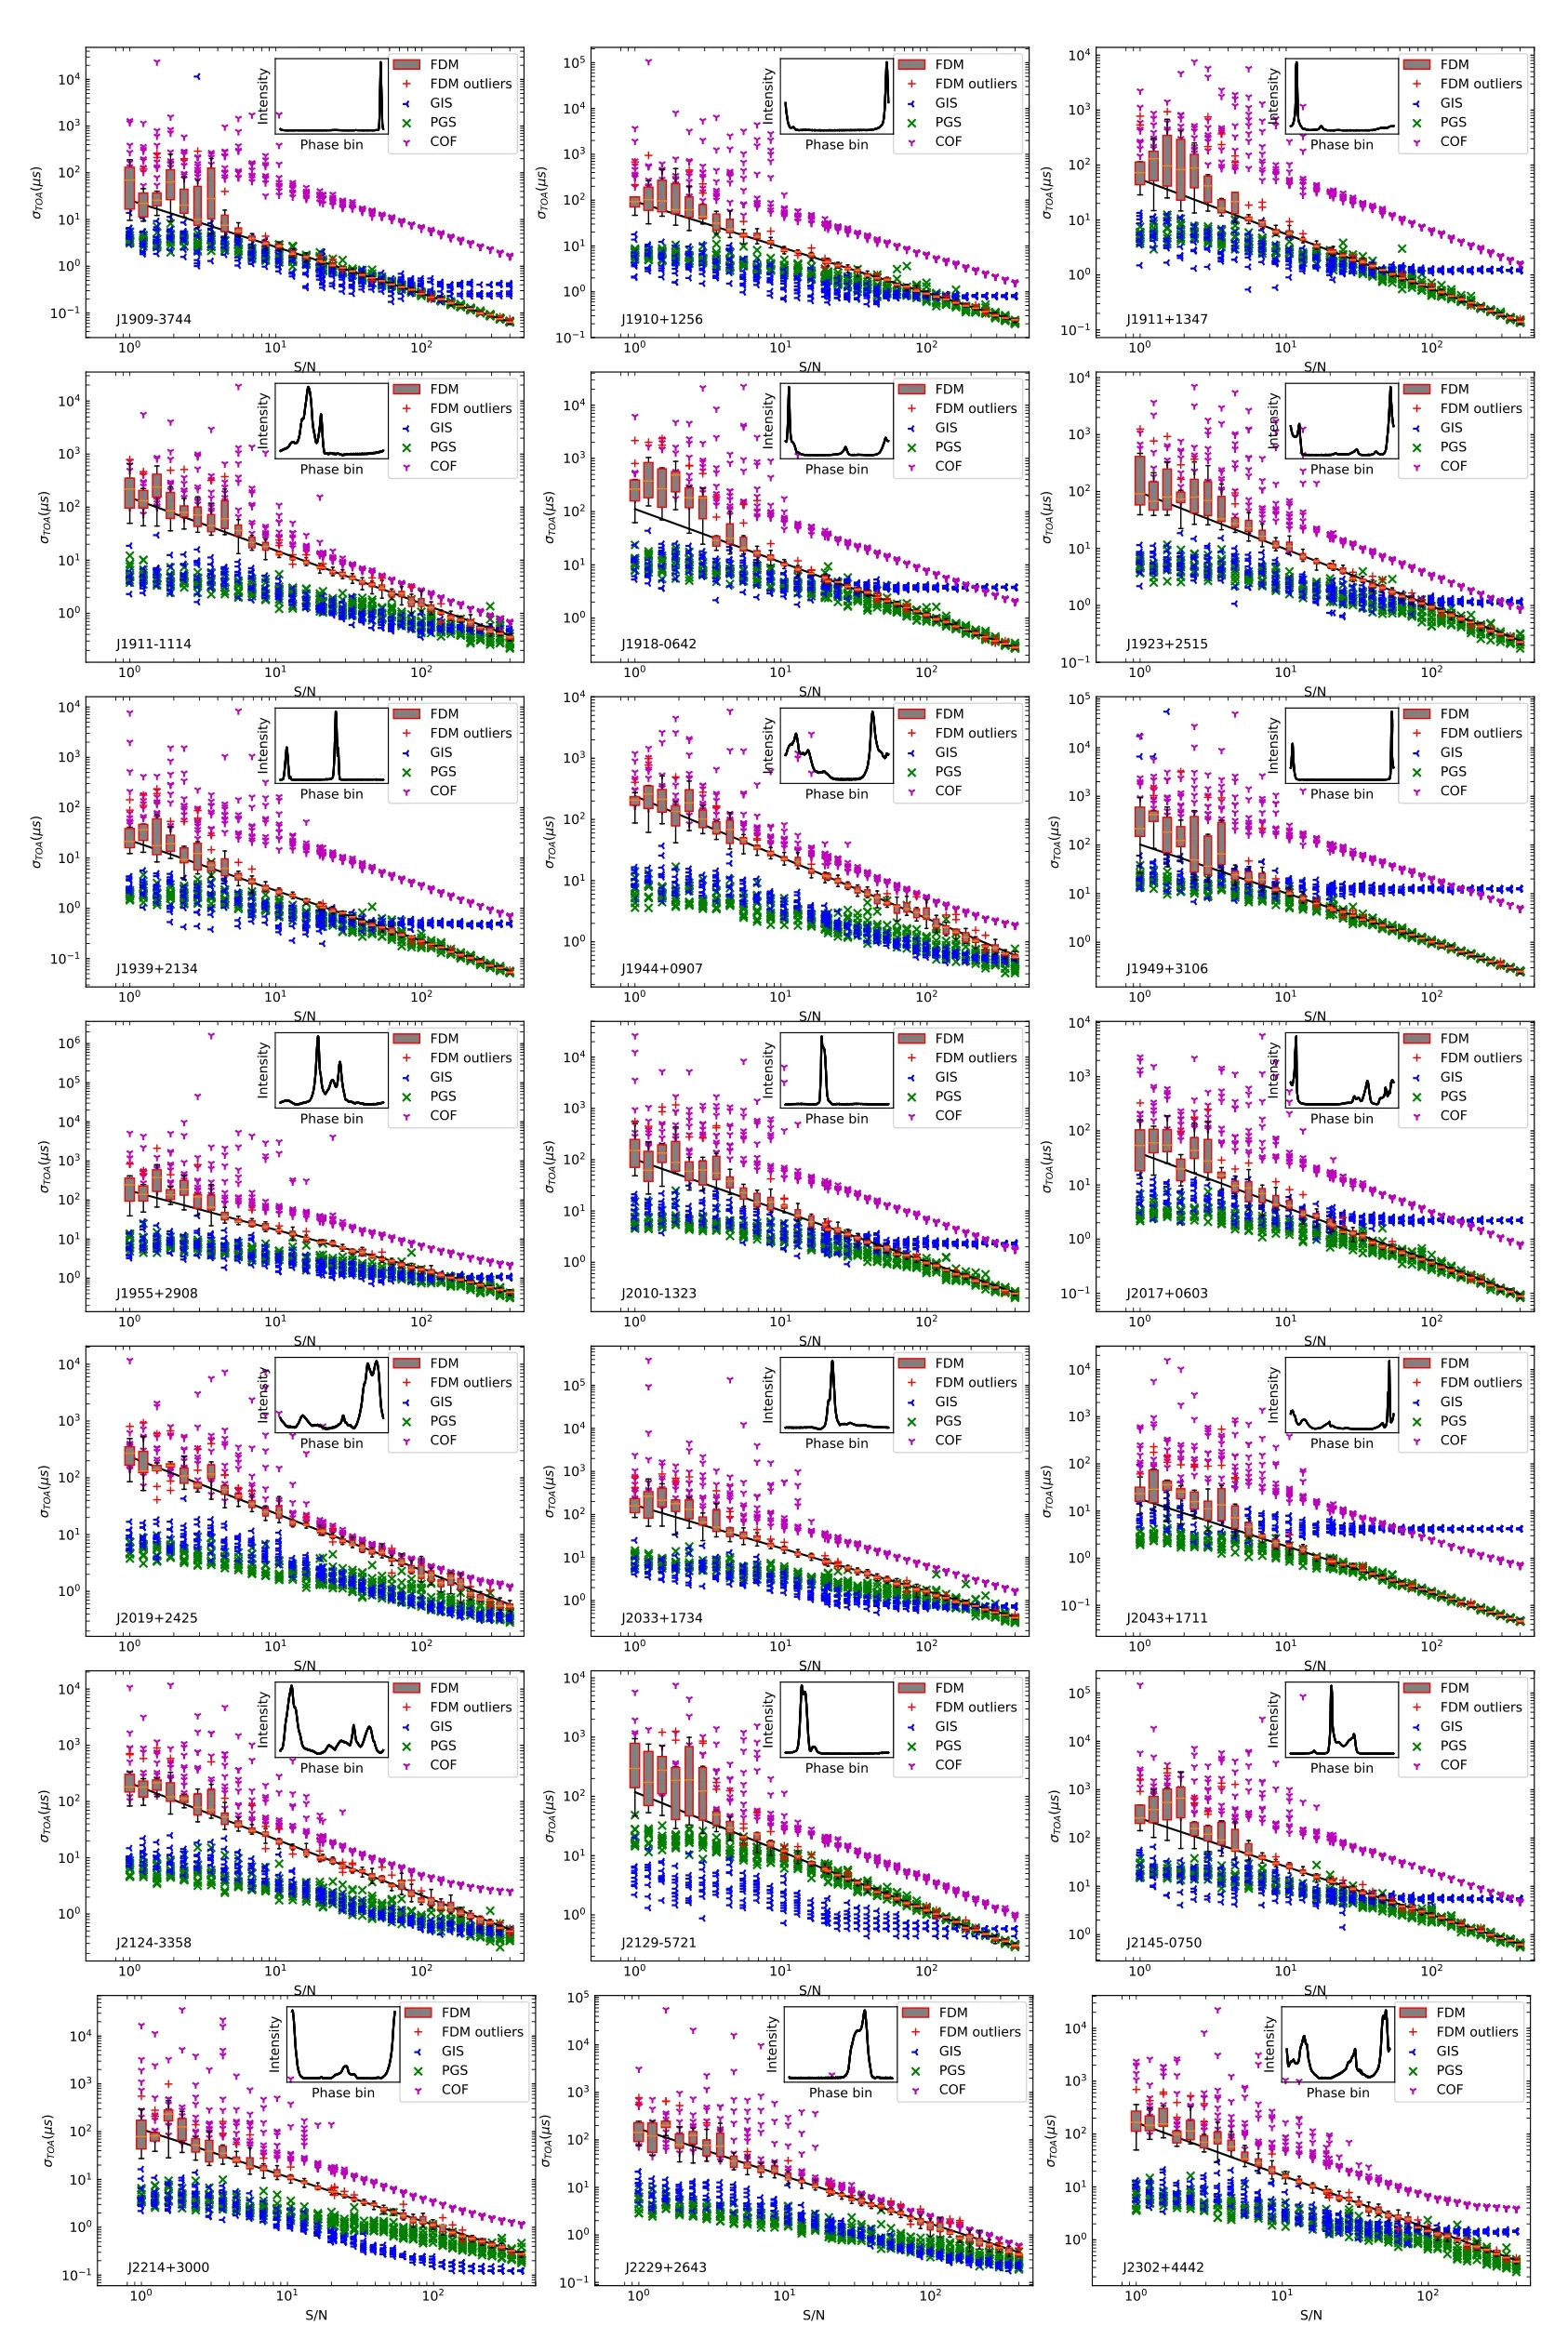
Figure A1.(Continued.)
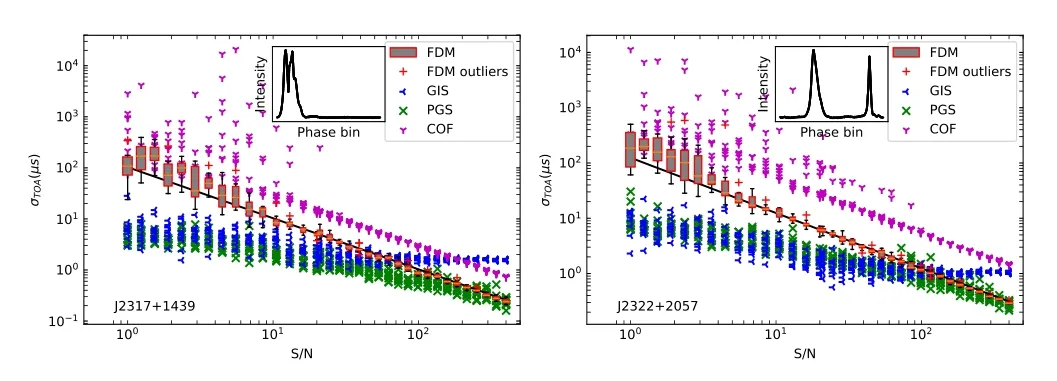
Figure A1.(Continued.)
ORCID iDs
杂志排行

Research in Astronomy and Astrophysics的其它文章
- A Revised Graduated Cylindrical Shell Model and its Application to a Prominence Eruption
- Predicting Gravitational Waves from Jittering-jets-driven Core Collapse Supernovae
- Redshift Dependence of the Low-energy Spectral Index of Gamma-Ray Bursts Revisited
- On the Nature of Long Period Radio Pulsar GPM J1839-10: Death Line and Pulse Width
- A Novel Imaging Method Based on Reweighted Total Variation for an Interferometer Array on Lunar Orbit
- PyMsOfa: A Python Package for the Standards of Fundamental Astronomy(SOFA) Service