Feasibility study of assessing cotton fiber maturity from near infrared hyperspectral imaging technique
2024-01-13LIUYongliangTAOFeifeiYAOHaiboandKINCAIDRussell
LIU Yongliang , TAO Feifei, YAO Haibo* and KINCAID Russell
Abstract Background Fiber maturity is a key cotton quality property, and its variability in a sample impacts fiber processing and dyeing performance.Currently, the maturity is determined by using established protocols in laboratories under a controlled environment.There is an increasing need to measure fiber maturity using low-cost (in general less than $20 000) and small portable systems.In this study, a laboratory feasibility was performed to assess the ability of the shortwave infrared hyperspectral imaging (SWIR HSI) technique for determining the conditioned fiber maturity,and as a comparison, a bench-top commercial and expensive (in general greater than $60 000) near infrared (NIR)instrument was used.
Keywords Near infrared spectroscopy, Near infrared hyperspectral imaging, Fiber maturity, Seed cotton, Partial least squares regression
Introduction
Cotton has been grown in over 100 countries/regions primarily for its natural textile fiber (Mollaee et al.2020).Cotton fiber starts from protodermal cells on the outer integument layer of cotton seeds.Fiber maturity,quantified by the degree of secondary cell wall thickening, is a key yield trait and also an essential fiber quality attribute.Maturity is linked directly to fiber breakage and entanglement (neps) during mechanical processing, yarn processing and textile performance, and dye uptake in textile products (Anthony et al.1988; Gordon 2007; Kelly et al.2015; Kim et al.2019; Long et al.2021).For example, recently Long et al.(2021) related fiber properties to the ring spun yarn performance on cotton from two consecutive seasons (the 2010/2011 season and the 2011/2012 season), and reported an 8.8% difference in fiber maturity and a 17.3% difference in yarn tenacity(cN·tex-1) between two seasons.Their fiber maturity on average was 0.76 from the 2010/2011 season and 0.83 from the 2011/2012 season, and this difference impacted yarn tenacity with 15.37 cN·tex-1from the 2010/2011 season fibers and 12.92 cN·tex-1from the 2011/2012 season fibers.
Fiber maturity is measured on cotton lint (i.e., cotton fiber after the ginning process has removed the cotton seeds) by the established procedures practiced in the cotton industry.Current-in-use fiber maturity measurements include the referenced cross-sectional image analysis microscopy(IAM) (Guo et al.2014; Hequet et al.2006; Thibodeaux and Evans 1986; Xu and Pourdeyhimi 1994), advanced fiber information system (AFIS) (Bradow et al.1996; Paudel et al.2013), and Cottonscope (ASTM 2021; Kim et al.2020; Paudel et al.2013; Rodgers et al.2012, 2015).These measurements are performed under tightly controlled laboratory environmental conditions of (21 ± 1)°C temperature and(65 ± 2)% relative humidity (RH).
To perform cotton fiber maturity measurements by the above methods, the cotton fiber attached to cotton seeds(or seed cotton) have to be harvested first in the field,then they are ginned at gin facilities prior to shipping the resultant fiber samples to a fiber testing laboratory for routine analyses.Clearly, from cotton field harvesting to cotton ginning to laboratory test, fiber maturity determination is a lengthy and tedious process involving fiber shipment and conditioning that might take days to have fiber maturity available (Zumba et al.2017), because fiber ginning (or production) facilities and laboratory quality test laboratories are not in close proximity.Hence, there is an increased interest in rapid and accurate analysis of cotton fiber maturity using low-cost (in general less than$20 000) and small portable systems.There have been a few works in this area; most have been led by researchers at the Agricultural Research Service (ARS) of the United States Department of Agriculture (USDA) (Rodgers et al.2010, 2017; Zumba et al.2017).These investigators have explored the feasibility of using portable near infrared (NIR) instruments to measure fiber maturity in and outside the laboratory.The principle is based on diffused NIR spectral reflectance that occurs when NIR light interacts with fiber sample, and also on NIR spectral intensities that originate from the overtones and combinations of fundamental group vibrations (i.e., C-H,O-H, C-O) in fiber cellulose (a major component in cotton fiber).NIR method is an indirect method for fiber maturity, since it relies on IAM, AFIS, or Cottonscope maturity values for NIR applications.In these pioneer studies, Rodgers and colleagues mainly compared portable NIR devices to bench-top instruments using welldefined and clean lint fibers, while consistently keeping a good contact between the sample and the NIR probe/detector.Depending on availability of fiber maturity reference measurements over the years, they used fiber maturity references from Fineness and Maturity Tester(FMT) measurements in 2010 (Rodgers et al.2010) to cross-sectional IAM tests (Rodgers et al.2017) and Cottonscope tests in 2017 (Zumba et al.2017).In addition to lint fiber, they collected NIR spectra of individual clean and seed cotton bolls using portable NIR devices,prior to mixing the bolls for the fiber maturity reference measurement and to taking the NIR spectral average.In order to evaluate portable NIR performance, they proposed several end-state criteria that included the number of outliers ≤ 30% (≥ 70% prediction method agreement between the reference method result and NIR-determined result).Their investigation showed the potential of predicting cotton fiber maturity within an agreement of ± 0.10 maturity units compared with other portable NIR measurements.It was found that the portable NIR instruments did not perform as well as bench-top NIR instruments in controlled condition and with consistent fiber contact.
Shortwave infrared hyperspectral imaging (SWIR HSI)technique has evolved as a non-destructive and rapid analytical tool for agricultural and food safety and quality inspection (Park and Lu 2015; Tao et al.2020), because it provides not only the spectral information of any pixel in an image but also the spatial information of an image at target wavelength.In the past 10 years, SWIR HSI has found promising applications in detecting cotton trash or non-lint components and in identifying different types of raw cotton (Al Ktash et al.2020; Ni et al.2020; Zhang et al.2016, 2017).To our best knowledge, SWIR HSI has not been applied to the evaluation of cotton fiber maturity, although there was a report of using multispectral sensors (or imaging) for cotton fiber micronaire property that reflects fiber maturity and fineness (Sui et al.2008).
To address the need of applying SWIR HSI or similar sensing measurements to fiber maturity in fiber research and testing laboratories, this study compared the result of expensive NIR spectrometer on well-prepared and clean fibers to that of SWIR HSI system on locule fibers in seed cotton at a laboratory environment.Seed cotton harvested by cotton mechanical harvesters contains approximately 7% (machine-picked) and 32.5% (machinestripped) foreign or non-lint materials (Hardin and Byler 2013), and it is a challenge to perform NIR fiber maturity analysis on seed cotton directly when foreign matter at the surface of a sample is apparent, as exampled in Fig.1(a).The main objective of this study was to compare partial least squares (PLS) regression model performance for predicting fiber maturity from both optical NIR spectra of lint samples and SWIR HSI spectra of locule fibers still attached to their seeds at a laboratory environment.Our rationale for comparing fiber maturity analysis between NIR instrument and SWIR HSI system is:
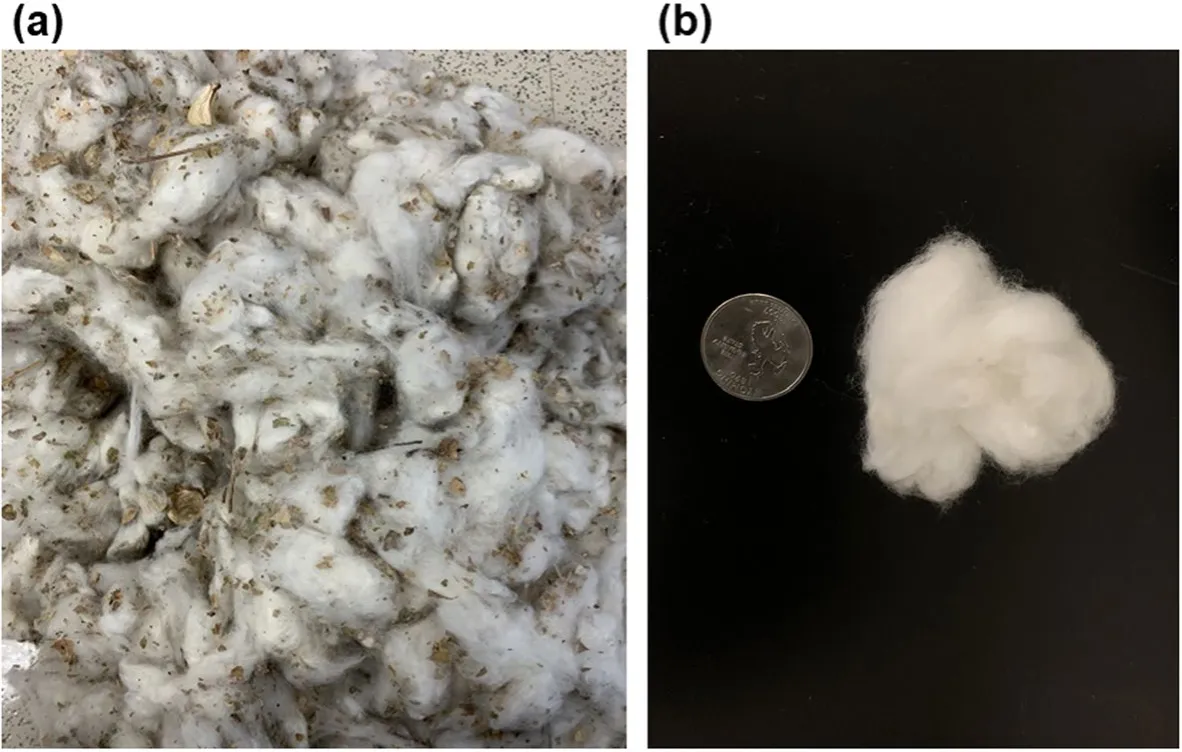
Fig.1 a Example of seed cotton with the presence of non-lint materials such as broken hulls, branches, and leaf pieces that are entangled with locule fibers.b Selected single locule fiber sample with cotton seed attached still, but without non-lint material; a U.S.25-cent coin (24.26 mm in diameter) was included to compare the shape and size of locule fiber sample
(1) Optical NIR models were developed from welldefined fibers and their maturity values were determined following the cross-sectional IAM procedure.IAM maturity determination requires a bundle of fibers to be selected and combed, embedded in a medium, cut into thin sections, and mounted on a microscope slide, prior to acquiring and analyzing fiber cross-sectional images.Following the image analysis with a piece of dedicated software, it is possible to estimate the parameters including the fiber secondary cell wall area (Aw, cross-sectional area minus lumen area) and the perimeter of the outside of the fiber (P2), and further to calculate fiber characteristics such as the circularity (θ = 4πAw/(P2)2), maturity ratio or maturity (M= θ/0.577) for each cross-sectional fiber as well as the average maturity and maturity distribution in a sample.In general, IAM fiber maturity test is a tedious, labor intensive, and slow process, hence it is impractical for measuring a large number of fiber samples.For the NIR spectral collection, a consistent pressure was applied to keep the fiber sample surface flat, and each NIR spectrum consisted of ~ 2 800 datapoints from 1 000 to 2 500 nm.
(2) SWIR HSI models were created from locule fibers in seed cotton and their respective fiber maturity values were acquired using the Cottonscope method.Unblended cotton lint is a mixture of locule fibers at different maturity levels, due to the fiber-to-fiber maturity variation within locules in a single boll and also among bolls from differing plant position and differing field areas (Ayele et al.2018; Turner et al.2015).By focusing on fiber samples from individual locules in seed cotton,it is anticipated to have an accurate locule fiber maturity value and also to exclude the impact of non-lint materials (exampled in Fig.1 (a)) on SWIR HSI model efficiency at this stage.In the Cottonscope reference measurement,a fiber bundle was cut into snippets, then ~ 20 000 individualized snippets were analyzed for the fiber maturity by using a polarized microscopy.Comparison of IAM maturity to Cottonscope maturity indicated a good overall agreement between the two methods for the 104 welldefined cottons (Paudel et al.2013; Rodgers et al.2012).Unlike the flat sample surface presented in the optical NIR measurement, locule fiber samples were in a fluffy state, presenting a rough surface during the SWIR HSI acquisition.A SWIR HSI spectrum includes 156 datapoints in the region of 1 000 to 2 500 nm, which is much less than that of the NIR spectrum discussed above.
Materials and methods
Well-defined cotton fibers, IAM maturity reference measurement, and NIR spectral collection
One hundred and four sub-samples from a pool of welldefined cotton fibers, known as the 104 reference materials collected by Texas Tech University for cotton fiber maturity measurements (Hequet et al.2006) were used.They were well homogenized and clean fibers representing two main cotton types (Upland and Pima), various growth locations (U.S.domestic and foreign countries),and a wide range of fiber maturity.Maturity values(MIAM) were obtained by the cross-sectional IAM protocol with the use of the FIAS software developed by XU Bugao (Hequet et al.2006).
NIR spectra in reflectance mode were acquired on a Foss XDS rapid content analyzer (Foss NIRSystems Inc., Laurel, Maryland, USA).Approximately 10.0 g of cotton fibers were pressed into a Foss coarse granular cell with internal dimensions of 3.8 cm wide X 15.2 cm long X 4.8 cm depth.Following the granular cell moving across the optical window and stopping at 8 locations,each spectral scan covered a large surface sampling area of approximately 36 cm2.To keep fiber surface flat for a good contact between the sample and the optical window during entire experiment, a 750 g of extra weight(~ 0.18 PSI, pound-force per square inch) was loaded on top of the fiber samples consistently.The background was recorded with the use of an internal ceramic reference tile prior to sample scan.The log10(1/Reflectance)or log10(1/R) readings were collected over the 400~2 500 nm wavelength range at 0.5 nm interval and 32 scans at a laboratory environment.Three spectra were taken by sub-sampling different portions in a sample within 5 min and the mean spectrum was used for each sample.
Locule fibers in seed cotton
Ten commercial Upland seed cotton samples, from 8 cultivars (Deltapine 1646 (DP1646), Dyna-Gro 3385(DG3385), Fiber Max 1830 (FM1830), Phytogen 350(PHY350), Phytogen 430 (PHY430), Phytogen 444(PH444), Stoneville 4848 (ST4848), and Stoneville 5471(ST5471)), were collected at modules in the field randomly from 3 U.S.States (Mississippi, Missouri, and New Mexico) in the 2019 crop year.For each sample, 10 locules were randomly selected across a sample box containing more than 5 lbs of seed cotton, in which fibers were mingled together between locules as well as with nonlint material (Fig.1 (a)).Following the removal of visible trash portions manually, locule fiber samples, with cotton seed presence and > 1.0 g in weight each (Fig.1 (b)),were imaged first as detailed in the following paragraph.Before taking the images, all seed cotton locule fiber samples were conditioned for a minimum of 24 h at a laboratory environment and then scanned at this laboratory.
SWIR HSI collection, image processing, and ROI (Region of interest) spectra of locule fibers
Next, a line-scanning SWIR hyperspectral imaging system in the spectral region of 1 000~2 500 nm was used(Tao et al.2020).It comprises an imaging spectrograph(Micro-Hyperspec®SWIR, Headwall Photonics Inc., Bolton, Massachusetts, USA), a 16-bit mercury cadmium telluride (MCT) detector coupled with a 25-mm focal length lens, halogen illumination source, and a computer.The imaging system has a spectral resolution of 9.6 nm,and the camera has a resolution of 384 (spatial dimension) X 166 (spectral dimension) pixels.
Hyperspectral images were acquired in reflectance mode from both sides of a locule fiber sample in the fluffy state.Each image took 13 s to acquire and included two locule samples with an exposure time of 10 ms and a pixel size of 778 × 384, and each pixel has a dimension of 0.273 4 mm (x-axis) and 0.254 1 mm (y-axis).Prior to the collection of fiber images, white and dark reference images were taken to correct the influence of non-uniform light intensity distribution and dark current of the imaging system.The white reference image was acquired from a white reflectance reference standard and the dark reference image was collected by covering the camera lens completely with its opaque cap.The relative reflectance (R) intensities of fiber samples were calculated from the equation:R= (Isample-Idark)/(Iwhite-Idark), in whichIsample,Idark, andIwhiterepresent the intensities from sample image, dark reference image, and white reference image, respectively (Tao et al.2020).The sample moving speed of 19 mm·s-1was calculated via the system control software.
To separate fiber pixels from background pixels in ENVI software (L3Harris Geospatial, Broomfield, Colorado, USA), a wavelength with the highest reflectance at 1316.82 nm was selected to enhance the largest contrast between the sample and the background.A band thresholding process was utilized to create a binary mask of all pixels with reflectance values of at least 0.10 at the wavelength of 1 316.82 nm.Pixels within the masked area were used to create a unique region of interest (ROI) for each of the locule sample contained within an image.After averaging two ROI reflectance spectra obtained from two sides of the individual sample, resultant mean reflectance spectra were converted to absorbance spectra for all samples before exporting them for analysis.
Locule fiber cottonscope maturity reference determination
After taking SWIR HSI scans, these locule fiber samples were measured for fiber maturity (MCS) by the Cottonscope (Cottonscope®Pty Ltd, Western Australia, Australia) as described previously (Kim et al.2020; Rodgers et al.2012, 2015).Standard manufacturer’s operational procedures were followed with the use of Cottonscope software version 2.08.All samples were conditioned for a minimum of 24 h prior to measurements and measured at standard conditions of (21 ± 1) °C temperature and(65 ± 2)% RH.Succeeding the removal of cotton seeds from each locule manually, remain fibers were cut into approximately 0.7 mm snippets using a dual-blade cutter.Then, a mass of 50.0 mg ± 0.3 mg of snippets was placed into the Cottonscope water bowl that contained 125 g of water solution with a surfactant, and snippets were individualized to begin the measurement.Each Cottonscope measurement analyzes 20 000 snippets, and a total of 3 measurements were taken for individual locule fiber samples before utilizing the average of 3 replicates for analysis.During the experiments, the USDA Agricultural Marketing Service (AMS) micronaire calibration cotton samples (GM-39 and DM-9) were used to check instrumental performance daily (Kim et al.2020).
NIR MIAM and SWIR HSI MCS model development
Both NIR spectra and SWIR HSI spectra were imported into GRAMS IQ application in Grams/AI (Version 9.1,Thermo Fisher Scientific, Waltham, Massachusetts, USA)for separate PLS regression model development.Both NIRMIAMand SWIR HSIMCSvalues were determined on 104 reference materials and 100 locule fibers, respectively, as described in previous paragraphs.On the order of the smallest to largest inMIAMvalue, 70 spectra (or samples) were selected for calibration equation development and the remaining 34 spectra (every 3rd sample in the order) were used for model prediction.Similarly,from the smallest to largest inMCSvalue, 67 spectra were selected for calibration equation development and 33 spectra were used for model validation.To optimize the accuracy of the prediction models, the spectra were subjected to different combinations of spectral pretreatments (e.g., mean centering (MC), multiplicative scatter correction (MSC), standard normal variate (SNV),and the first and second derivatives).Full (one-sampleout rotation) cross-prediction method was used, and the number of optimal factors chosen for the regression equation generally corresponded to the minimum of the predicted residual error sum of squares (PRESS).The model accuracy and efficiency were evaluated in the calibration and prediction set on the basis of coefficient of determination (RC2,RP2), root mean square error of calibration (RMSEC) and prediction (RMSEP),as well as the number (or percentage) of samples being predicted accurately.A sample was considered to be predicted accurately if the difference between NIR predicted and referenced maturity value was within the 95% agreement range of bias ± 1.96*RMSEP (Bland and Altman 1986).The higherRP2(Chicco et al.2021), lower RMSEP,and greater percentage of correctly predicted samples,the better and more robust the optical and imaging NIR systems response to fiber maturity.BothP-values at confidence level of 95% andF-test were calculated using respective Regression andF-Test function under Data Analysis in Microsoft®Excel®for Office 365.
Results and discussion
MIAM prediction by NIR spectra
Figure 2 shows representative log10(1/R) spectra (1 000∼2 500 nm) of cotton fibers with differentMIAMranges.These spectra were obtained by averaging the spectra of consecutiveMIAMvalues in the respective range of < 0.70, 0.70–0.80, 0.80–0.90, 0.90–1.00, and> 1.00.Spectra of cotton fibers with lowMIAMvalue have common NIR bands with those of fibers having highMIAMindex, but there are overall intensity increases in entire spectral region withMIAMrising.Spectral intensity variations suggest the capability of NIR technique to monitor changes in fiber maturity through quantitative multivariate data analysis.Notably, spectral difference between two mean spectra (representingMIAM= 0.90 to 1.00 vs.MIAM> 1.00) is indiscernible, revealing insignificant spectral intensity changes among highMIAMfibers due to less variation in cellulose amount, a major fiber composition.This pattern is consistent with Fig.4 that is from different cotton samples, different maturity measurements, and different NIR instruments.Various functional groups in fiber cellulose are responsible for characteristic bands in this region and their assignments are summarized in Table 1 (Burns and Ciurczak 2001).The weak bands in 1 150∼1 300 nm region are mainly from the second overtones of CH stretching modes in water-bonded and hydrogen-bonded cellulose, while their first overtones appear in 1 675∼1 860 nm region.Absorptions in 1 300∼1 400 nm region are assignable to combination bands of the CH vibrations mostly, and also include the extended wing as low as 1 125 nm from the neighboring broad and the intense band at 1 450 nm.These bands in the 1 400∼1 675 nm region are due to the overlap of the first overtones of the OH stretching modesin hydrogen bonded forms from both fiber cellulose and water or moisture adsorbed in fiber.The strong bands centered at 1 940 and 2 105 nm are most likely attributed to the combination of OH stretching and deformation mode from moisture in fiber and the combination of OH and CO stretching vibrations of water-bonded and hydrogen-bonded cellulose, respectively.Intense absorptions over 2 200 nm are primarily from combination bands in water-bonded and hydrogen-bonded cellulose.Although the 1 940 nm band is the moisture band in cotton fiber, other absorption bands are a collective contribution of all chemical components in a sample,including fiber cellulose and moisture.Since moisture fluctuations may influence the NIR spectra, all samples were equilibrated in the laboratory for 24 h prior to all measurements.
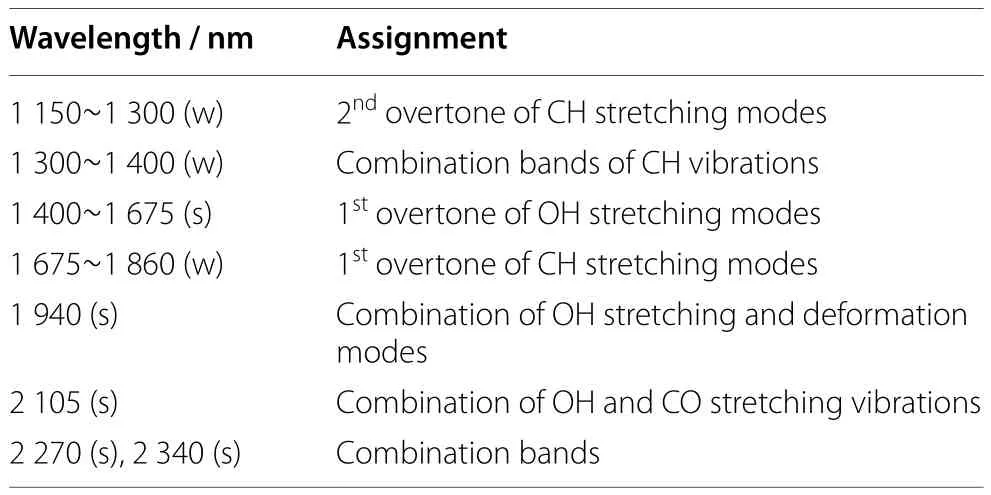
Table 1 NIR band assignment of cotton fibers (s = strong, w =weak)
Range and standard deviation (SD) of referencedMIAMvalues in calibration and prediction sets are summarized in Table 2.Within the goal to create a set of reference cotton for maturity measurement (Hequet et al.2006),variations ofMIAMvalues in Table 2 could represent the variability of fiber maturity in commercial cotton bales and cotton breeding programs.
PLS models were developed from different combinations of spectral pretreatments in the 1 000∼2 495 nm region by cutting moisture band (1 860∼2 010 nm), and the optimal result from the MC + MSC + FD spectral pretreatment is given in Table 2.This model produces anRc2of 0.828 andRp2of 0.739 as well as an RMSEC of 0.041 and RMSEP of 0.044.A scatter plot of NIR predicted against measuredMIAMin prediction set is given in Fig.3A (P< 0.001).F-test results showed a non statistically significant difference in the variances of predicted and measuredMIAMindex (P= 0.19).Meanwhile,Bland–Altman plot in Fig.3B showed the visualization of individual samples in comparison with the 95% limits of agreement between the predicted and referenced(or actual)MIAMproperty in the prediction set.The 95%agreement ranges are bias ± 1.96*RMSEP, in which thebias is the difference between the averages of the predicted and referencedMIAMvalues while RMSEP is the root mean square error of the prediction.The number of outliers, i.e., the samples outside the agreement ranges, is 1, indicating that around 97.0% ((34 - 1)/34*100%) of validation samples are in agreements at α = 0.05.Similarly,the number of outliers in calibration samples is 3, meaning an over 97.0% agreement.

Table 2 Statistics in calibration and prediction sets for MIAM or MCS property from NIR or SWIR HSI spectra

Fig.3 A Comparative correlation between NIR predicted and referenced MIAM in prediction set (n = 34) from 1 000∼2 495 nm without the moisture 1 940 nm band; (B) Bland-Altman plot of NIR predicted and referenced MIAM property
MCS prediction by SWIR HSI spectra
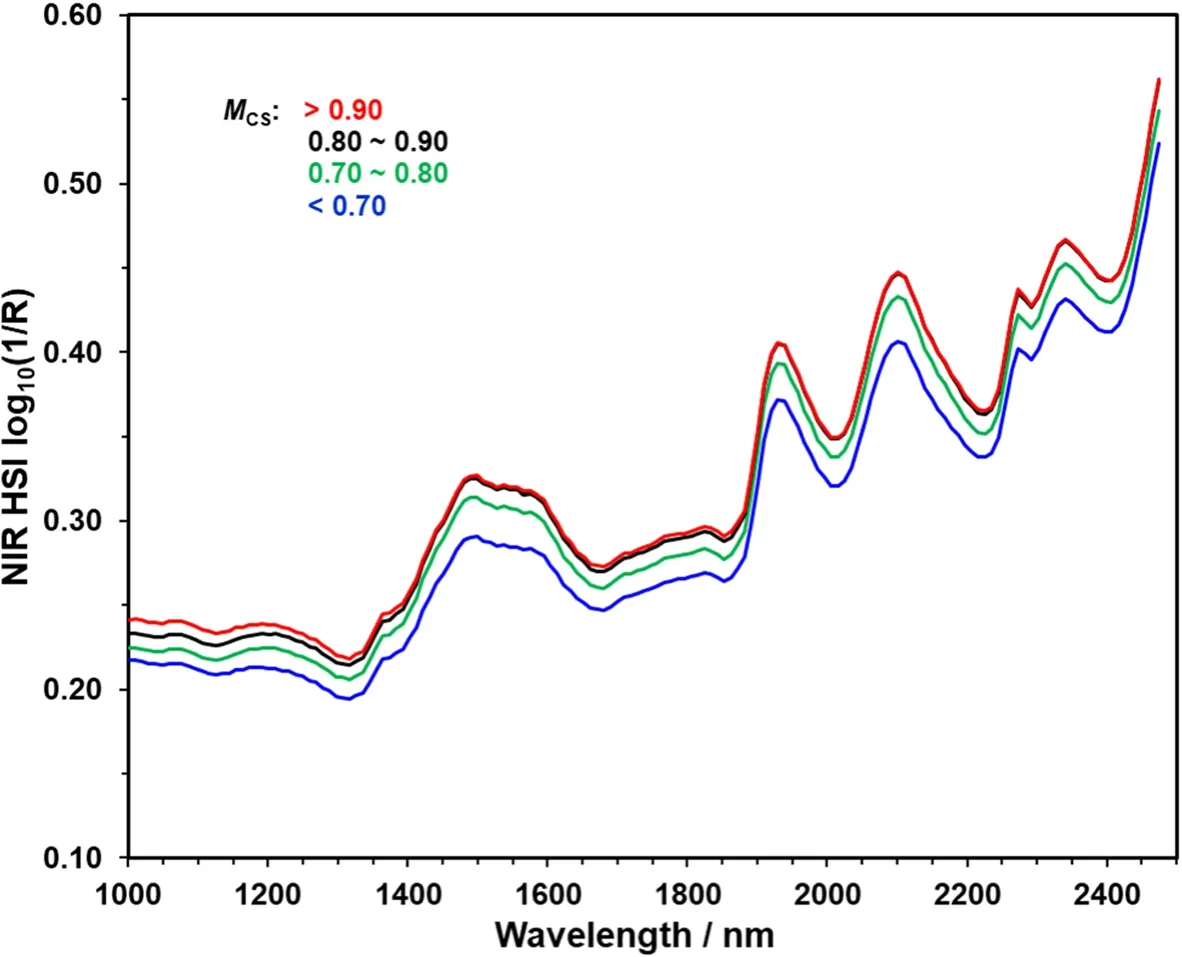
Fig.4 SWIR HSI log10(1/R) spectra of locule fibers with cotton seed presence in different MCS intervals, by averaging the spectra of neighboring MCS values in respective range of < 0.70, 0.70–0.80, 0.80–0.90, and > 0.90, from bottom to top
As expected, SWIR HSI log10(1/R) spectra (1 000∼2 500 nm) of locule fibers with cotton seed presence in Fig.4 resemble NIR log10(1/R) spectra of cotton fibers in Fig.2 well.Figure 4 shows characteristic cotton fiber NIR bands from 1 350 to 1 650 nm, 1 875 to 2 000 nm, 2 020 to 2 200 nm, and 2 240 to 2 400 nm with absorption peaks at 1 485/1 560, 1 940, 2 105, and 2 275/2 345 nm.However, the difference in baselines or baseline shift of two types of NIR spectra is distinctive between Fig.2(< 0.10 at 1 100 nm) and Fig.4 (> 0.20 at 1 100 nm).This shift was not unexpected, because optical NIR spectra were acquired from a flat sample surface, whereas SWIR HSI spectra were collected from a fluffy fiber sample with a rough surface.Nevertheless, these NIR spectra reflect the diffused reflectance from fiber samples’ surface.Effect of the baseline shifts on spectral modeling power can be minimized significantly by trying different several statistical analysis strategies, such as derivatives and MSC.Similarity of the NIR curve in Fig.4 to those in Fig.2 suggests that the SWIR HSI technique has an equivalent power detecting cotton fiber maturity as the NIR.
Compared with the range (0.570 to 1.087) and SD(0.099) within calibration samples for the 104 reference materials in Table 2, both the range (0.530 to 0.970)and SD (0.076) of calibration set for the 100 locule fiber samples in Table 2 decreased.For example, the lowend of range changes to 0.530 for the 100 locule fibers from 0.570 for the 104 reference materials, the high-end of range becomes 0.970 for the 100 locule fibers from 1.087 for the 104 reference materials, and SD reduces to 0.076 for the 100 locule fibers from 0.099 for the 104 reference materials.This is not surprising, since the 104 reference samples were created subjectively to cover a large maturity range (Hequet et al.2006).For the 104 reference materials, Paudel et al.(2013) showed a dynamicMCSrange of 0.47 to 1.11 as compared with theMIAMrange of 0.57∼1.09, indicating a difference of 0.10(MIAM-MCS) between the lowestMIAMand the lowestMCSand also of -0.02 (MIAM-MCS) between the highestMIAMand the highestMCS.MCSon the 100 locule fiber samples were observed to be lower thanMIAMon the 104 reference materials in Table 2, echoing theMCSandMIAMobservation on the same 104 reference materials by Paudel et al.(2013).Even on partial (93) of this 104 reference materials, Rodgers et al.(2012) reported a moderateR2of 0.65 and a slight bias (standard deviation of differences (SDD) = 0.062) betweenMCSandMIAM,however, they did not specify theMCSorMIAMrange.The authors (Rodgers et al.2012) further ascribed these discrepancies to (i) sample inhomogeneities in natural cotton fiber and (ii) errors inMIAMdetermination (limited number of specimens, image detection bias, fiber bundle sectioning).These researchers also noted the lowerMCSvalues for samples at higherMIAMvalues,due to errors inMIAMdetermination of immature versus dead fibers.Finally, they concluded a very good method agreement between Cottonscope and IAM method for fiber maturity.Despite of different fiber samples,the pattern of fiberMIAMfrequency (%) on the 104 reference materials is similar to that of fiberMCSfrequency(%) on 100 locule fiber samples (Fig.5), implying that random selection of the 100 locule fiber samples from 10 cotton cultivars in this study is appropriate.
To correlate SWIR HSI spectra with correspondingMCSvalues, different combinations of ROI spectral pretreatments in the 1 001∼2 474 nm region without the moisture 1 940 nm band (1 860∼2 010 nm) were attempted and the optimal result is inserted in Table 2.
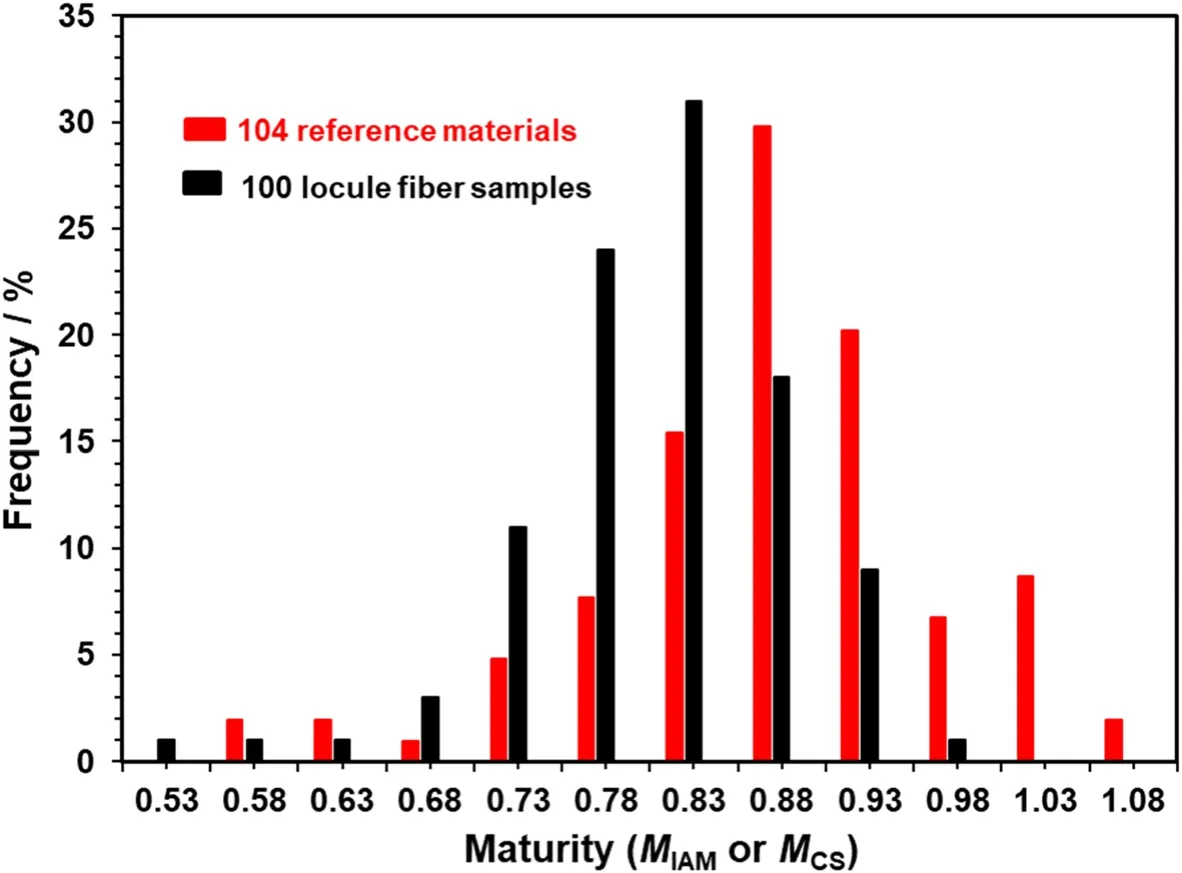
Fig.5 Comparison of fiber maturity frequency (%) on the sample set of 104 reference materials against 100 locule fiber samples (■).Curve was obtained for each sample set, after classifying the MIAM or MCS values into 20 bins (bin width, 0.05) and counting the frequency number of each bin
for comparison.This model suggests an overall agreement of ≥ 97.0% in 67 calibration and 33 prediction samples that are within the 95% agreement ranges, and also an RMSEC of 0.031 and RMSEP of 0.046.Figure 6 A and 6B show a correlation plot between SWIR HSI predicted against actualMCS(P< 0.001) and a Bland–Altman plot in prediction set, respectively.Difference in the variances of predicted and measuredMCSvalue was not statistically significant (P= 0.30).
It is of interest to examine theMCSvariation at a single locule level within a cultivar (or a sample).Table 3 summarizes theMCSaverage, standard deviation (SD), and range on 10 samples, showing a variation ofMCSaverage from 0.730 to 0.891 for 10 samples and aMCSrange from 0.530 to 0.970 at single locule level among 10 samples.As expected in Table 3, samples with similarMCSaverage could show different maturity ranges.For example, the pair of PHY350 vs.PHY444 revealed a similarMCSaverage of 0.831 vs.0.828 but a differentMCSrange of 0.747 to 0.893 and 0.684 to 0.970, respectively.MCSfrequency in Fig.7 suggested a clear difference between the two cultivars, with a maximumMCSfrequency atMCS= 0.82 and a narrowMCSinterval for PHY350 cultivar and for PHY444, atMCS= 0.73 and a wideMCSinterval.Comparatively, DP1646 dryland and PHY430 showed a commonMCSmean (0.785 vs.0.794) andMCSrange (0.733 to 0.827 vs.0.733 to 0.833), and also a similarMCSfrequency.

Table 3 Comparison of MCS avg ± SD and range on 10 seed cotton samples from cottonscope measurement
Data in Table 2 indicated consistent prediction abilities in the aspect of RMSEP (0.044 from NIR optimal model and 0.046 from SWIR HSI model) and percentage of samples within the 95% agreement range(> 97.0% from NIR and SWIR HSI model) between optical NIR and SWIR HSI system, despite the facts that (1)different types of reference values were taken (MIAMvs.MCS), (2) different spectral datapoints or instrumental resolution were used (2 750 datapoints in optical NIR vs.155 in SWIR HSI), and (3) different sampling methods were adopted (flat surface in optical NIR vs.fluffy fibers in SWIR HSI).On the other hand, a lowerRP2value (0.518) from SWIR HSI model than that (0.739)from NIR model might be due to a reduced SD value(0.085 in NIR models vs.0.064 in SWIR HSI models).Like the 104 reference materials developed for fiber maturity measurement, more diverse cotton cultivars from different locations and crop years are necessary to validate the SWIR HSI method.Therefore, result reveals a potential of SWIR HSI instrument for rapid and accurate measurements of fiber maturity at a laboratory environment, in which cotton samples were conditioned to the same equilibrium of both temperature and RH prior to be imaged under this condition.Also,the surface status of seed cotton should be considered in future work.
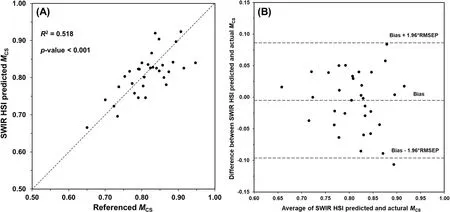
Fig.6 A Comparative correlation between SWIR HSI predicted and measured MCS in prediction set (n = 33) from 1 001∼2 474 nm without the moisture 1 940 nm band.B Bland-Altman plot of SWIR HSI predicted and referenced MCS property
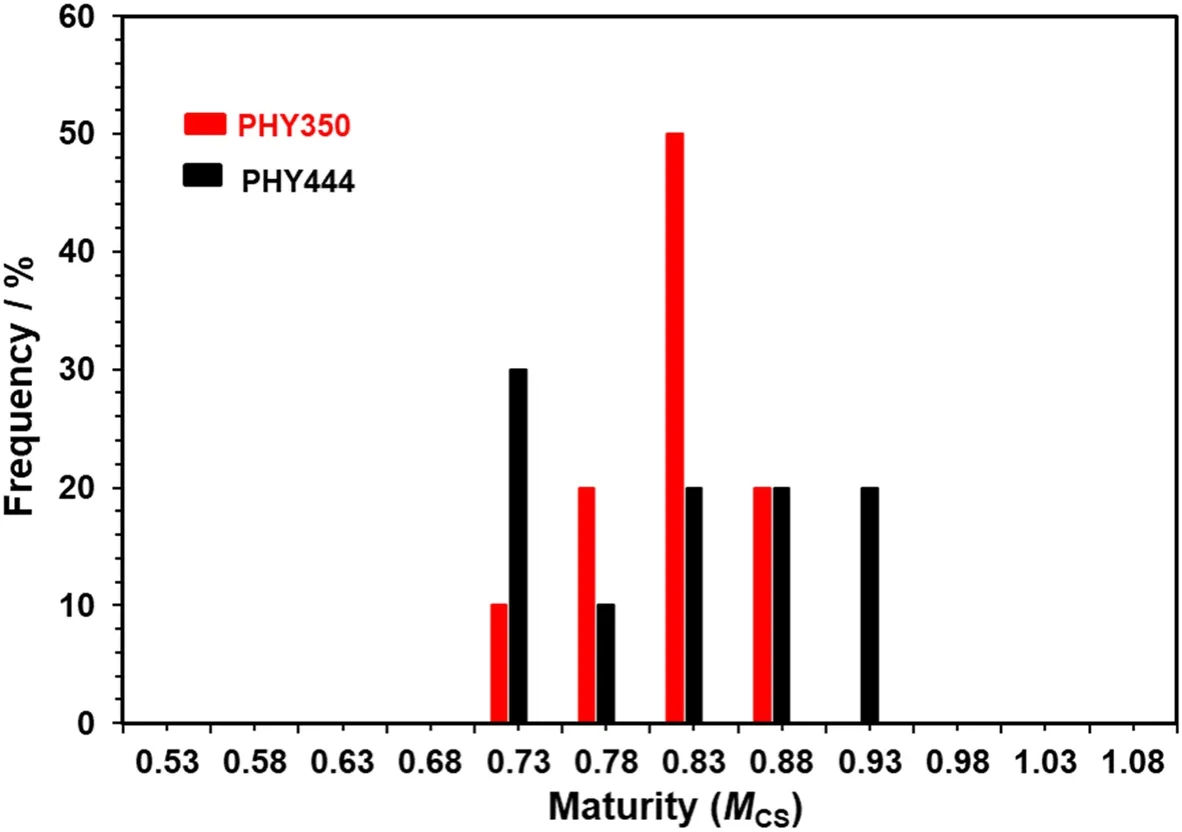
Fig.7 Comparison of measured MCS frequency (%) between PHY350and PHY444 (■)
Both fiberMIAMandMCSmodels were established on conditioned samples using the 1 000∼2 495 nm NIR region excluding the 1 860∼2 010 nm moisture absorptions, clearly this NIR region is the minimum of the moisture effect but impacted by water-bonded cellulose.An earlier investigation (Vogt et al.2011) indicated that exclusion of the 1 935 nm moisture band (or cutting out the 1 900∼2 000 nm region) had almost no impact on fiber micronaire (an indicator of fiber maturity and fineness component) prediction.In a separate study of 30 commercial cotton bales (Knowlton 1996), result revealed the equilibrium moisture content(EMC) ranging from just under 6.7% to just over 7.2%by the oven-dry method, and also showed relatively low EMCs for high micronaire cotton at a controlled condition of 70 °F (or 21 °C) and 65% RH.Relative to a small change in EMC value from 6.7% to 7.2% (a change of 7.5%), micronaire varied largely from 3.50 to 5.20 unit(a change of 48.6%).This reported data suggested a less change in moisture content within samples at controlled environment.
Conclusion
Result of SWIR HSI system on fiber Cottonscope maturity reference of locule fiber samples in seed cotton was compared with that of a bench-top NIR instrument on fiber IAM maturity reference of well-defined cotton fiber samples.NIR spectral consistence was observed between two different spectral measurements, with common NIR bands and shapes apparent.Despite the differences in maturity reference measurements, spectral datapoints, and sampling methods between optical NIR and SWIR HSI techniques, satisfactory, consistent and comparable prediction results were observed on conditioned samples, with RMSEP < 0.044 from NIR optimal model and < 0.046 from SWIR HSI models as well as the percentage of correctly predicted samples > 97.0% at α = 0.05 from NIR and SWIR HSI models.These results indicated a potential of lowcost SWIR HSI technique in estimating fiber maturity rapidly and non-destructively at a laboratory.Further research is needed to apply the method outside the laboratory and to transfer the models between sample types as well as between instruments.
Acknowledgements
Authors wish to acknowledge Dr Thibodeaux D in providing the 104 reference materials information, Dr Delhon C in providing seed cotton samples, and Ms King H and Moraitis J in supporting Cottonscope measurement.Authors also thank Prof Xu B, Prof Li C, Dr Delhom C, Dr Pelletier M, and Dr Funk P for professional insight to improve the manuscript.Mention of a product or specific equipment does not constitute a guarantee or warranty by the U.S.Department of Agriculture and does not imply its approval to the exclusion of other products that may also be suitable.
Authors’ contributions
Liu Y and Yao H conceived the research.Liu Y was responsible for all cotton samples, optical NIR and Cottonscope measurements, and Kincaid R performed SWIR data collection.Liu Y, Tao F, and Yao Y conducted data analysis and prepared the manuscript.All authors read and approved the final manuscript.
Funding
This research was supported partially by the USDA-ARS Research Project #6054-44000-080-00D.
Availability of data and materials
All data used or generated are included in the manuscript.
Declarations
Ethics approval and consent to participate
Not applicable.
Consent for publication
Not applicable.
Competing interests
Authors do not have competing interests.
Received: 16 August 2023 Accepted: 27 October 2023

杂志排行
Journal of Cotton Research的其它文章
- Biocontrol potential of entomopathogenic nematode, Heterorhabditis indica against pink bollworm, Pectinophora gossypiella (Saunders)(Lepidoptera: Gelechiidae)
- Enhancing waterlogging tolerance in cotton through agronomic practices
- Mepiquat chloride priming confers the ability of cotton seed to tolerate salt by promoting ABA-operated GABA signaling control of the ascorbate–glutathione cycle
- Effects of mepiquat chloride and plant population density on leaf photosynthesis and carbohydrate metabolism in upland cotton
- Risk of control failure to insecticides malathion, profenophos + cypermethrin mixture, and fipronil in boll weevil (Coleoptera:Curculionidae) populations from Bahia, Brazil
- Are yarn quality prediction tools useful in the breeding of high yielding and better fibre quality cotton (Gossypium hirsutum L.)?
