Effects of mepiquat chloride and plant population density on leaf photosynthesis and carbohydrate metabolism in upland cotton
2024-01-13LUOHaihuaZHANGZhengxianWUJianfeiWUZhenjiangWENTianwangandTANGFeiyu
LUO Haihua, ZHANG Zhengxian, WU Jianfei, WU Zhenjiang, WEN Tianwang* and TANG Feiyu*
Abstract Background Mepiquat chloride (MC) application and plant population density (PPD) increasing are required for modern cotton production.However, their interactive effects on leaf physiology and carbohydrate metabolism remain obscure.This study aimed to examine whether and how MC and PPD affect the leaf morpho-physiological characteristics, and thus final cotton yield.PPD of three levels (D1: 2.25 plants·m-2, D2: 4.5 plants·m-2, and D3: 6.75 plants·m-2) and MC dosage of two levels (MC0: 0 g·ha-2, MC1: 82.5 g·ha-2) were combined to create six treatments.The dynamics of nonstructual carbohydrate concentration, carbon metabolism-related enzyme activity, and photosynthetic attributes in cotton leaves were examined during reproductive growth in 2019 and 2020.
Keywords Gossypium hirsutum L., Mepiquat chloride, Plant population density, Carbohydrate metabolism, Photosynthesis
Introduction
Upland cotton (Gossypium hirsutumL.) is a leading fiber crop worldwide with an indeterminate growth habit.Modern crop production requires high plant population density (PPD) and compact plant architecture (Mao et al.2014).Cotton plants tend to produce excessive vegetative growth when grown in a fertile, well-irrigated, and suitable environment (Reddy et al.1990, 1992), which leads to increased population shading (Mao et al.2014).Mepiquat chloride (N, N-dimethylpiperidinium, MC) and PPD are two common agronomic practices to manage cotton growth.They are commonly used to create compact plants with short limbs conducive to mechanical harvest(Nichols et al.2003; Wilson et al.2007; Mao et al.2014).
MC is a gibberellin biosynthesis inhibitor (Rademacher 2000), which is widely utilized for controlling excessive vegetative growth, such as the reduction of plant height, leaf area, the number of main-stem nodes, and internode length, thus resulting in more compact plant stature (Reddy et al.1990, 1992; Gu et al.2014).Other physiological responses to MC application include that the contents of leaf chlorophyll, soluble sugar, and starch were enhanced (Reddy et al.1996; Zhao and Oosterhuis 2000; Tung et al.2018a), and promoted early maturity(York 1983; Owen Gwathmey and Chism Craig 2003;Pettigrew and Johnson 2005).The effects of MC on photosynthesis and yield have been inconsistent among previous studies.Reddy et al.(1996) reported that net photosynthetic rate decreased by 25% in MC-treated leaves, and in another experiment Reddy et al.reported(1995) that net photosynthetic rate reduced by 30% due to the application of 30 μg·g-1MC.Tung et al.(2018a)found that photosynthesis reduced by 1% ~ 28% with increasing MC dosage.Conversely, Zhao and Oosterhuis (2000) observed that MC application improved leaf CO2exchange rate.Hodges et al.(1991) reported that MC increased the canopy gross photosynthesis on the second day post foliar MC spray.Yield response to MC has been erratic, ranging from positive (York 1983;Cathey and Meredith 1988; Biles and Cothren 2001;Nichols et al.2003; Siebert and Stewart 2006; Mao et al.2015; Zhao et al.2017; Shi et al.2022) to negative (York 1983; Cathey and Meredith 1988; Ren et al.2013; Tung et al.2018a, b) to none (Pettigrew and Johnson 2005).The cotton yield response largely depends on the rate and timing of MC application (Reddy et al.1995), environmental factors, moisture and fertilizer availability(Reddy et al.1992), planting date (Cathey and Meredith 1988; Pettigrew and Johnson 2005), planting density,and cultivar (Zhao et al.2017).Biles and Cothren (2001)reported that multiple, lower-dosage MC applications produced higher cotton yield than a single application at the early bloom stage.In most cases, MC decreases boll density and lint percentage but increases boll and seed weights (York 1983; Ren et al.2013; Mao et al.2015;Shi et al.2022).The decreased lint percentage is attributed to the enhanced seed weight (York 1983), while the increased boll weight is partly due to the appropriate distribution of harvestable bolls mostly located at the inner fruiting positions on the middle-lower sympodia(Mao et al.2015).
PPD effects on cotton growth and yield have been investigated extensively in past decades (Galanopoulou-Sendouka et al.1980; Bednarz et al.2005; Dong et al.2006; O’Berry et al.2008; Wrather et al.2008; Khan et al.2017; Shah et al.2017).Cotton yield remains stable across a wide range of plant densities of 3.3 to 10.5 plants·m-2through the manipulation of either yield components (boll density and boll weight) or dry matter accumulation and partitioning (Dai et al.2015).Enhancing PPD typically increases boll density but decreases boll weight, and lint percentage is little affected (Bednarz et al.2005; Dong et al.2006, 2012; Dai et al.2015).Leaf senescence is delayed through increasing PPD (Dong et al.2012; Dai et al.2015; Luo et al.2018).High PPD under deficit irrigation can achieve a comparable yield to medium PPD under regular irrigation through increasing plant biomass and harvest index (Zhang et al.2016).The late-planted cotton with higher PPD produced a yield equal to the early-planted cotton with lower PPD (Dong et al.2006).High PPD can reduce the nitrogen rate by 20% ~ 30% from the traditionally recommended rate without compromising cotton yield, which is probably attributed to the delayed leaf senescence and enhanced N use efficiency (Luo et al.2018).
High PPD coupled with the optimal timing and dosage of MC improves cotton productivity (Ren et al.2013; Gu et al.2014; Chen et al.2021).High PPD tends to concentrate boll setting on first-position sympodial sites (Wilson et al.2007).Combined high PPD and MC application produce more bolls residing on lower(Gwathmey and Clement 2010) or low-middle sympodia (Mao et al.2015), while Chen et al.(2021) reported more bolls were at the upper and middle canopy.More concentrated boll distribution due to the combination of high PPD and MC application implies a more synchronous demand for carbohydrates (Gwathmey and Clement 2010).Therefore, leaf photosynthesis and carbohydrate dynamics in the compact, high-density cotton population are expected to be different from normal cotton populations.However, limited information is available on PPD and MC application effects on cotton leaf photosynthetic production.Tung et al.(2018a) reported the effects of MC application on leaf photosynthesis and carbohydrate metabolism in a short-season cotton production system which was characterized by late sowing, high planting density, and single fertilization.Nevertheless, the interactive effects of PPD and MC application on cotton growth and yield are lacking for full-season cotton under optimal planting.PPD and MC have been hypothesized to affect cotton yield through the regulation of leaf physiology(mainly photosynthesis-related) and carbon metabolism.To test the hypothesis, three levels of PPD (low,middle, high) and two dosages of MC application (MC free and MC application) were combined to create six cotton populations with different leaf morpho-physiological traits.The objectives of this study were to: i)examine PPD and MC application effects on cotton yield, yield components, biological yield, and harvest index; ii) explore the effects of PPD and MC application on leaf morphological and photosynthetic traits,including specific leaf weight (SLW), chlorophyll content, net photosynthetic rate (Pn); iii) determine the dynamics of nonstructural carbohydrate concentration and carbon metabolism enzyme activity in response to PPD and MC application.
Materials and methods
Experimental design
A mid-maturation upland cotton line 4003–6 was fieldgrown at the experimental station of Jiangxi Institute for Industrial Crops Research, Jiujiang, China (29°42’N,115°50’E) in 2019 and 2020.The soil type was tidal sand soil, with a neutral pH of 7.4.The upper 20 cm soil layer contained 18.6 g·kg-1of organic matter, 1.16 g·kg-1of total N, 1.04 g·kg-1of total P, 16.7 g·kg-1of total K,74.5 mg·kg-1of available N, 34.2 mg·kg-1of available P, and 327 mg·kg-1of available K.Direct seeding was adopted in 2019 and shifted to seedling transplanting in 2020 due to the full standing availability of the latter.The planting dates were May 6, 2019, and April 10, 2020,and the transplanting date was May 10, 2020.The experiment was designed as a split-split plot design with three replications, with the whole plot assigned to years, the split-plot to MC dosage, and the split-split plot to PPD.Each plot consisted of eight rows of cotton with 6.24 m in length and 9.12 m in width.The row spacing was 1.12 m.The MC application included two levels of dosage (MC0: 0 g·ha-1, MC1: 82.5 g·ha-1), conforming to a local conventional MC schedule.The application dosages were 7.5 g·ha-1at 57 and 67 days post sowing (DPS),30 g·ha-1at 81 and 91 DPS, and 45 g·ha-1at 101 and 111 DPS in 2019 and 2020, respectively.A foliar spray of pure water served as the control.PPD was classed into three levels (D1: 2.25 plants·m-2, D2: 4.5 plants·m-2, and D3:6.75 plants·m-2).The PPD gradient was designed given the local PPD recommendation of 3.75 to 4.5 plants·m-2for the conventional (non-hybrid) cotton in the Yangtze River valley region, China (Dong 2013).The interplant distance was 39.0 cm at D1, 19.5 cm at D2, and 13.0 cm at D3.Composite fertilizer 19–19-19 (19% NH4+-N, 19%phosphorus, and 19% potassium oxide) was incorporated into soils at the peak squaring (PS) stage at a rate of 225 kg·ha-1, and flowering to boll setting (FB) stage at a rate of 600 kg·ha-1in 2019 and 2020.
Sampling procedure and data collection
Four samplings were taken and adjusted to the phenological characteristics at PS (64 DPS in 2019 and 75 DPS in 2020), the first flowering (FF; 71 DPS in 2019 and 83 DPS in 2020), FB (89 DPS in 2019 and 107 DPS in 2020),and the first boll opening (FBO; 117 DPS in 2019 and 125 DPS in 2020).Within a plot, selected plants were spaced far away from each other to ensure the growth of the remaining plants was not influenced by the earlier sampling of other plants.Four individual plants in each of the plots were uprooted and washed free of soil and then immediately divided into five parts: root, main stem,branch (petiole), leaf blade, and reproductive parts.All green leaves of each sample were scanned by a scanner(Epson Expression 12000XL), and the resulting images were translated into real leaf areas using image analysis software (Image J).Afterward, those leaves were ovendried at 105 °C for 0.5 h and then at 60 °C until constant weights were achieved and then weighed.The SLW was calculated by the leaf biomass divided by the corresponding leaf area.In addition, the fourth main-stem leaf from the apex was sampled separately from each plot for analysis of physiological parameters.Cotton yield and its components were determined as described by Tang and Luo(2023).The biological yield was obtained by summing the dry weight of all plant parts at the maturity stage, and the harvest index was defined as the seed cotton yield to the biological yield ratio.
Net photosynthetic rate (Pn) and SPAD value
Pn was measured on the youngest fully expanded, healthy,and fully sunlit leaves, typically the fourth leaf from the apex using a portable photosynthesis system (L1-6400,Li-Cor, Lincoln, NE, USA) at early flowering (EF; 80 DPS in both years) and FB (103 DPS in both years), respectively.All measurements were taken between 9:00 and 11:00 on cloudless days with the photosynthetic photon flux density exceeding 1 500 μmol·m-2·s-1.SPAD values were read by a SPAD meter (SPAD 502 Plus, Konica Minolta, Japan) at the same time.Four plants in each plot were examined and the mean values were calculated.
Chlorophyll concentration
Chlorophyll (Chl) concentrations were determined as described by Li (2000) with minor modifications.Briefly, 0.1 g of fresh leaves was placed in a 2.5 mL centrifuge tube that contained a steel ball of 2 mm in diameter.After the addition of 1 mL pre-chilled ethanol (95%,v/v), the tissues were homogenized at 60 Hz for 30 s in a low-temperature grind miller (N9548, Hoder, Beijing,China) and repeated four times in a total of 2 min.The homogenate was transferred into a centrifuge tube and diluted to 10 mL with 95% ethanol, where the extraction was performed for 12 h under the condition of shade.The chlorophyll concentration in the supernatant was spectrophotometrically determined by measuring the absorbance at 665 nm and 649 nm for Chl a and Chl b.The formulas for the calculation of chlorophyll concentration were as follows: Chl a = 13.95*A665– 6.88*A649;Chl b = 24.96* A649– 7.32*A665.
Carbohydrate analysis
Nonstructural carbohydrates, such as glucose, fructose,sucrose, and starch, were extracted and quantified following previous procedures (Luo et al.2019; Chen et al.2020).Total nonstructural carbohydrate (TNC) concentration was defined as the sum of glucose, fructose,sucrose, and starch concentration.
Enzyme extraction and assay
About 0.1 g of fresh leaves were put into a 2.5 mL liquid nitrogen-frozen centrifuge tube which contained a steel ball of 2 mm in diameter.After the addition of 1 mL precooled extraction buffer (50 mmol·L-1Hepes–NaOH(pH 7.5), 2 mmol·L-1Na2-EDTA, 2.5 mmol·L-1dithiothreitol (DTT), 10 mmol·L-1MgCl2, 0.05% Triton X-100,1% (w/v) insoluble polyvinylpyrrolidone (PVP), 10%glycerol, and 0.3% (v/v) β-mercaptoethanol), the tissues were homogenized at 60 Hz for 30 s in a low-temperature grind miller (N9548, Hoder, Beijing, China) and repeated four times in a total of 2 min.Afterward, the homogenate was incubated for 1 h at a low temperature provided by ice.Vortexing was conducted at 10-min intervals, then centrifugated for 5 min at 12 000 r·min-1.The supernatants were used in sucrose synthase (SuSy) and sucrose phosphate synthase (SPS) activity assays.
SPS activity was measured as reported by Luo et al.(2019) and Chen et al.(2020) with minor modifications.Briefly, each reaction contained 20 μL buffer solution which contained 50 mmol·L-1Tris–Hcl (pH 7.0),10 mmol·L-1MgCl2, 20 mmol·L-1Glu-6-P, 20 mmol·L-1Fru-6-P, 20 μL of 10 mmol·L-1UDP-Glu, and 50 μL of extract in a total volume of 90 μL.The reaction was started by the addition of the extract, incubated at 30 °C for 10 min, and terminated with the addition of 200 μL of 2 mol·L-1NaOH and 10 min of heating at 100 °C to destroy untreated hexose and hexose phosphate.After the solution was cooled to room temperature, 1.4 mL of 30% (w/v) HCl and 0.4 mL of 0.1% (w/v) resorcinol were added and the reaction was incubated at 80 °C for 10 min.After cooling to room temperature, sucrose concentration was calculated from a standard curve measured at 480 nm.SuSy was assayed as above but with 20 mmol·L-1fructose substituting for Fru-6-P.
The activities of Ribulose bisphosphate carboxylase oxygenase (Rubisco) and Fructose-1, 6-bisphosphatase(FBPase) were measured following the procedures described in the manufacturer’s guideline of assay kits(Suzhou Comin Biotechnology Co.Ltd, Suzhou, China).
Data analysis
Treatment effects on cotton yield, biological yield, harvest index,Pn, and SPAD value were subjected to Analysis of Variance (ANOVA) using the General Linear Model procedure (GLM) in SPSS 18.0 software (Chicago,IL, USA).In the statistical analysis, MC, PPD, and year served as fixed effects and block (replicate) as a random factor.The PPD was nested within MC, which was nested within the year.For the ANOVA involved in SLW, chlorophyll concentration, nonstructural carbohydrate concentration, and carbon metabolism enzyme activity, MC,PPD, and sampling time served as fixed effects and block(replicate) as a random factor.The sampling time was nested with the PPD, while the latter was nested within the MC.The means were separated using Duncan’s multiple range tests atP≤ 0.05.For parameters where year interacted with treatments were detected, the results were presented by years.Conversely, when statistically significant interaction with the year was not identified,treatment means were averaged across years.The figures were produced using Origin 8.5 and Origin 2021b.
To evaluate the utilization efficiency of nonstructural carbohydrates in cotton leaves over reproductive growth,the notion of transformation rate (TR) was introduced.Given a specific nonstructural carbohydrate component, it can be expressed as the following formula: TR(%) = (maximum concentration – minimum concentration) / maximum concentration × 100 (Shu et al.2009;Tang et al.2014).
Results
Seed cotton yield, biological yield, and harvest index
Year effects significantly affected seed cotton yield, biological yield, and harvest index (Supplementary Table S1).The PPD effect was significant for all traits.The MC effect was significant for biological yield and harvest index.The PPD by MC interaction exhibited significant effects on seed cotton yield and biological yield.The MC application decreased the biological yield, but increased the harvest index, thus remaining the seed cotton yield equivalent to the MC-free control (Table 1).At the given PPD range, biological yield was increased, but the harvest index decreased with increasing PPD.Among the six combinations of PPD and MC, MC1D3 (the combination of the MC application and the PPD of 6.75 plants·m-2)exhibited the maximal seed cotton yield, and the biological yield followed by MC0D3, while MC1D1 possessedthe minimum values.MC1D3 enhanced the seed cotton yield, and biological yield by 6.5% ~ 38.3%, and 1.9% ~ 65.8% compared with other combinations across both years, respectively.

Table 1 Effects of the mepiquat chloride and planting density on the seed cotton yield, biological yield, and harvest index in 2019 and 2020
Pn and SPAD value
ThePn and SPAD value at the EF and FB stages were significantly affected by year and MC application(Supplementary Table S2).The PPD interaction with MC significantly affected the SPAD value, but not thePn.The PPD-by-year interaction effect was significant for thePn,but not the SPAD value.The MC application improved the SPAD value but reduced thePn at the EF and FB stages (Table 2).Among the six combinations of PPD and MC, MC1D3 exhibited the maximum SPAD value followed by MC1D2 irrespective of years and sampling stages.MC1D3 increased the SPAD value by 2.6% ~ 26.8%at the FF, and by 1.3% ~ 11.7% at the FB relative to others in both years, respectively.MC0D1 showed the highestPn, while MC1D2 had the lowestPn regardless of years and sampling stages.
Specific leaf weight
PPD and sampling time significantly affected SLW(Supplementary Table S3).Significant MC effects on the SLW were detected in 2019.The two-way or threeway interaction effects involved in sampling time were significant except for MC × sampling time in 2020.During the period of PS to FB, SLW was basally decreased with increasing PPD under either MC application or free, but the trend was reversed at the FBO (Fig.1).At the FBO stage, MC0D3 and MC1D3 displayed higher SLW compared with other treatments but there was no significant difference between MC0D3 and MC1D3.The SLW at the FBO was 56.9 g·m-2for MC0D3 and 57.1 g·m-2for MC1D3 in 2019, and 47.7 g·m-2for MC0D3 and 48.9 g·m-2for MC1D3 in 2020,respectively.
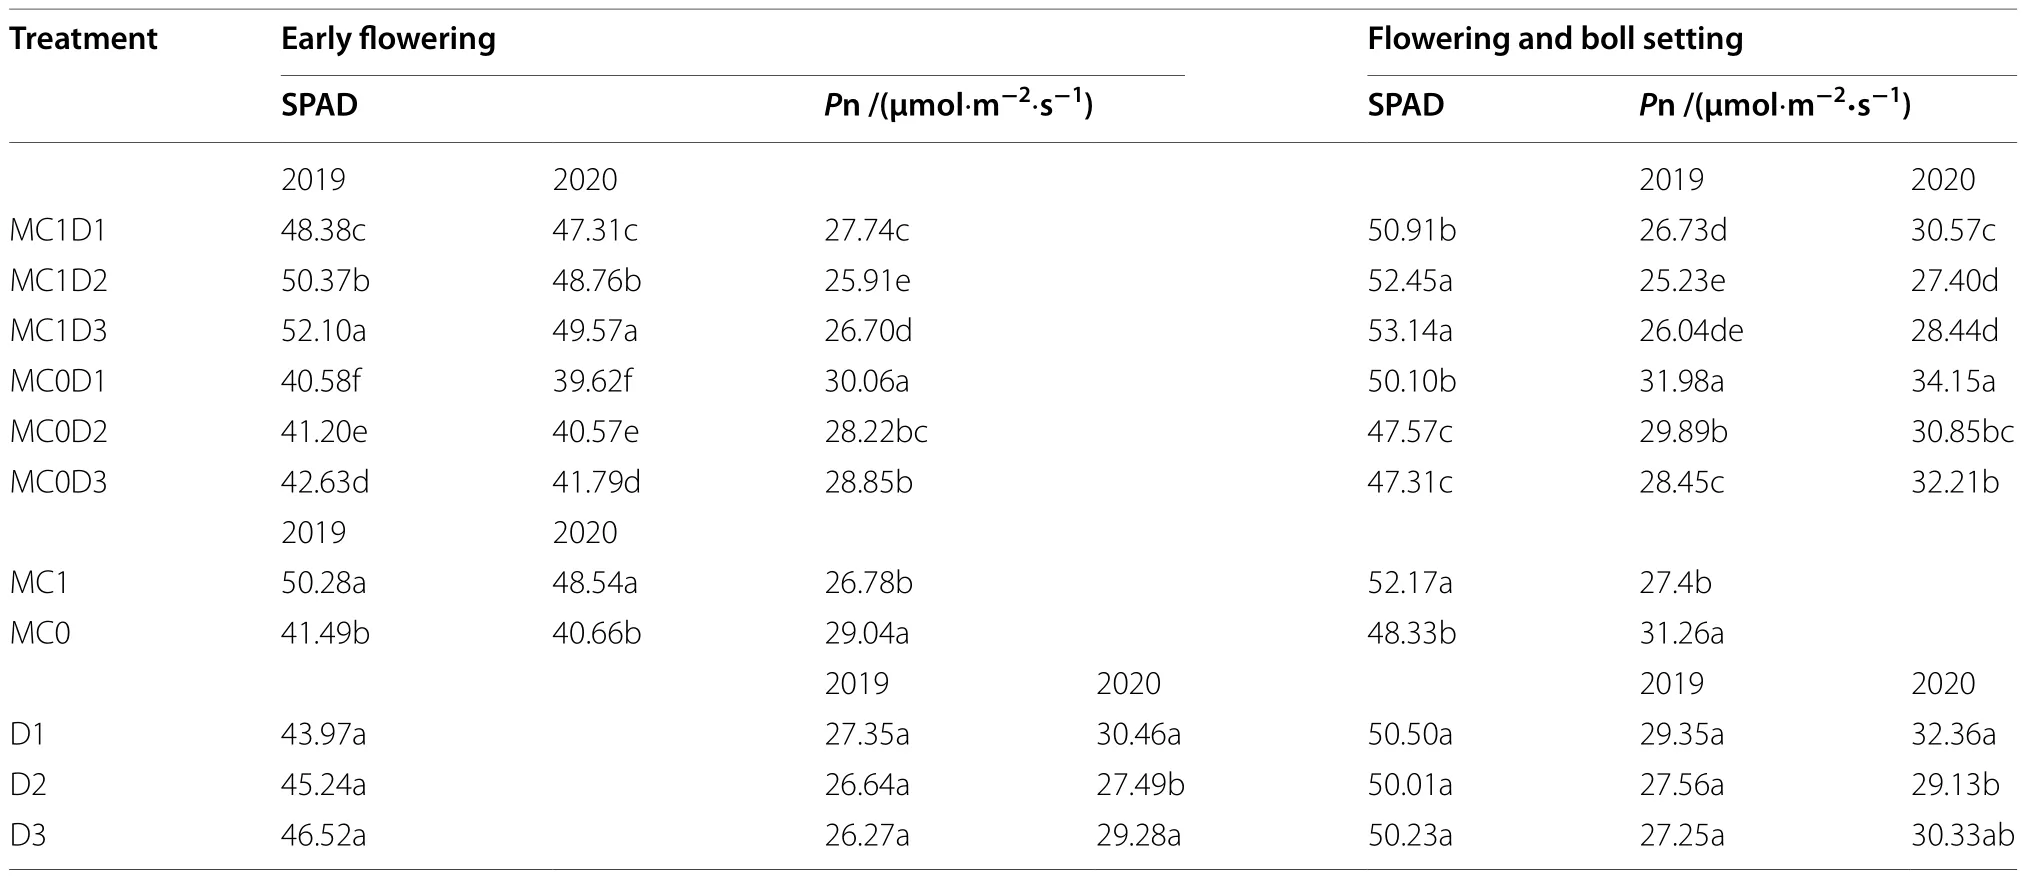
Table 2 The net photosynthesis rate (Pn) and SPAD value in the main-stem functional leaves of upland cotton at the early flowering and flowering and boll setting in 2019 and 2020
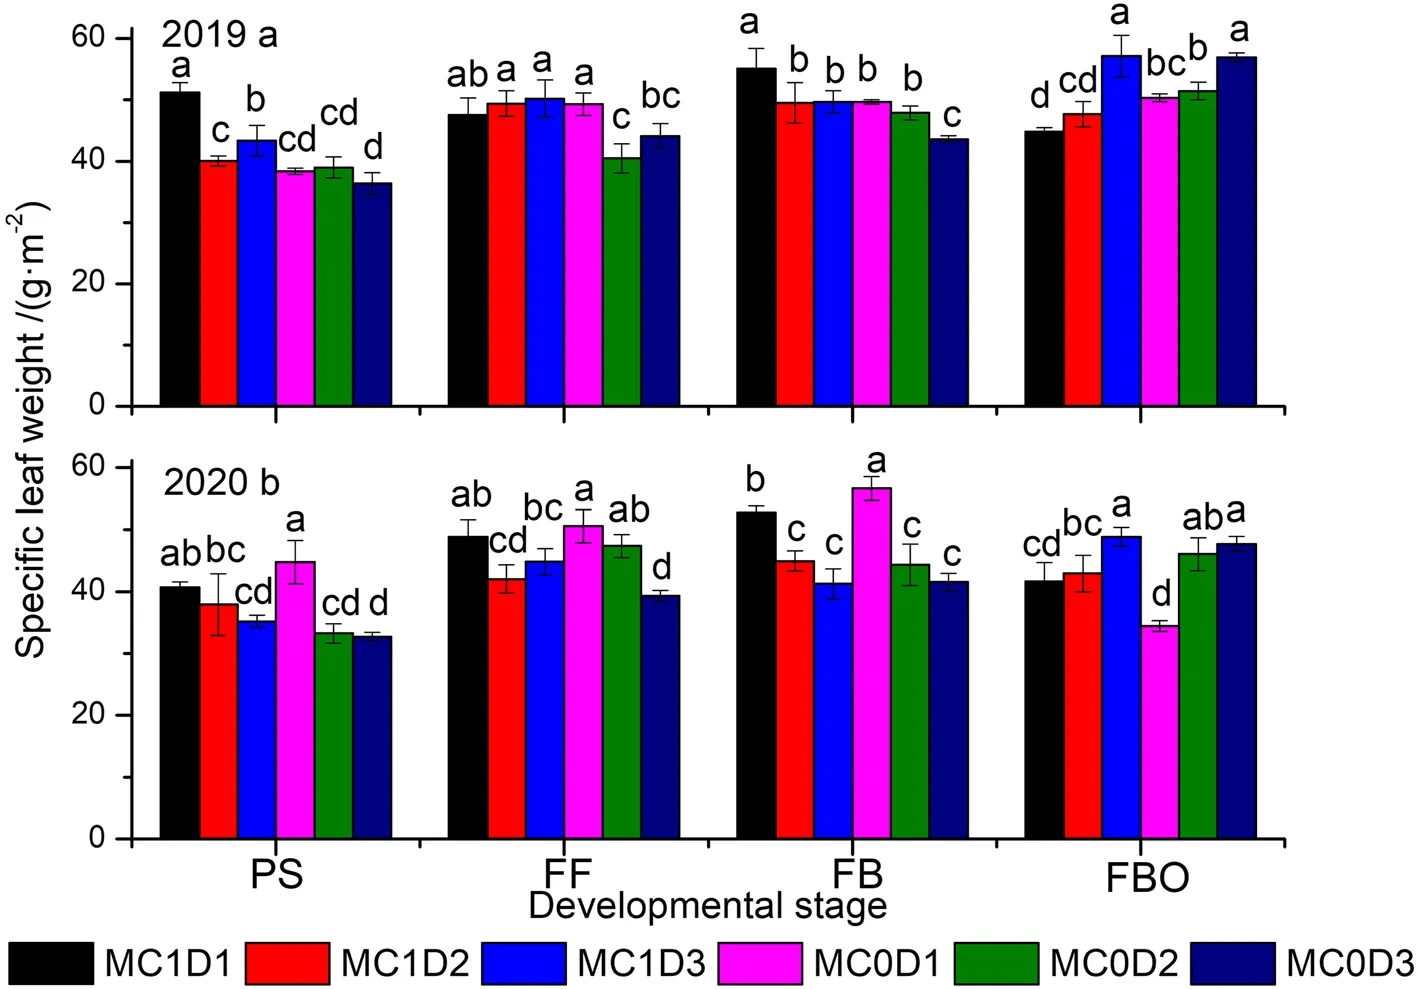
Fig.1 Dynamics of specific leaf weight (a, b) as function of developmental stage in 2019 and 2020, respectively.Each data point represents the mean ± SD (n = 3).Within the same panel, means not sharing a common letter indicate significant differences at P < 0.05.PS: peak squaring; FF:first flowering; FB: flowering and boll setting; FBO: first boll opening; MC0: no mepiquat chloride application; MC1: mepiquat chloride application;D1: plant density of 2.25 plants·m-2; D2: plant density of 4.5 plants·m-2; D3: plant density of 6.75 plants·m-2.The same as below
Chlorophyll concentration
MC, PPD, sampling time, and MC × PPD interaction significantly affected the Chl a, Chl b, and Chl a + b concentration except PPD effect on Chl a + b in 2019 (Supplementary Table S4).Each of the Chl a, Chl b, and Chl a + b showed a single-peak curve with a peak at the FB stage (Figs.2 and 3).At that stage, MC1D3 exhibited the maximum in the three parameters followed by MC1D1 in 2019, while MC1D1 ranked first followed by MC1D3 in 2020.MC1D3 increased the Chl a by 0.5%, Chl b by 7.3%,and Chl a + b by 4.0% in 2019 (Fig.2), but decreased the Chl a by 5.8%, Chl b by 1.3%, and Chl a + b by 4.4% in 2020 compared with MC1D1 (Fig.3).Furthermore, MC application-improved Chl concentration pooled across three PPD levels was observed during the whole sampling period in both years (Supplementary Table S4, Figs.2 and 3).
Nonstructural carbohydrate concentration
MC, PPD, and sampling time significantly affected the sucrose, hexose, starch, and TNC concentration except the PPD effects on the hexose concentration in 2020(Supplementary Table S5).Significant two-way interaction effects of MC and sampling time, as well as PPD and sampling time, and three-way interaction effects of MC, PPD, and sampling time were detected for all parameters except the MC × sampling time interaction on the sucrose concentration in 2020.Each of the carbohydrate components (hexose, sucrose, and starch)and TNC concentration expressed similar trend, which was characterized by a rapid increase from the PS to FF and then a sharp decline until the FBO (Figs.4 and 5).The maximum appeared at the FF and the minimum at the FBO regardless of treatment, carbohydrate type,and year.MC1D3 exhibited higher starch and TNC concentration compared with others at the FF stage.The starch concentration was elevated by 5.4% ~ 88.4%in 2019, and by 14.6% ~ 55.9% in 2020 in MC1D3 than in other treatments.The TNC concentration was increased by 7.8% ~ 52.0% in 2019, and by 13.5% ~ 39.7%in 2020 in MC1D3 relative to others.Averaged across three PPD levels, The starch concentration at the FF stage was increased by 42.5% in 2019 (P= 0.047), and by 38.0% (P= 0.012) in 2020 by the MC application.Likewise, the MC application improved the TNC concentration averaged across three PPD levels by 21.6% in 2019 (P= 0.069), and by 25.4% in 2020 (P= 0.023) compared with the MC-free control at the FF stage.
Carbohydrate metabolism enzyme activity
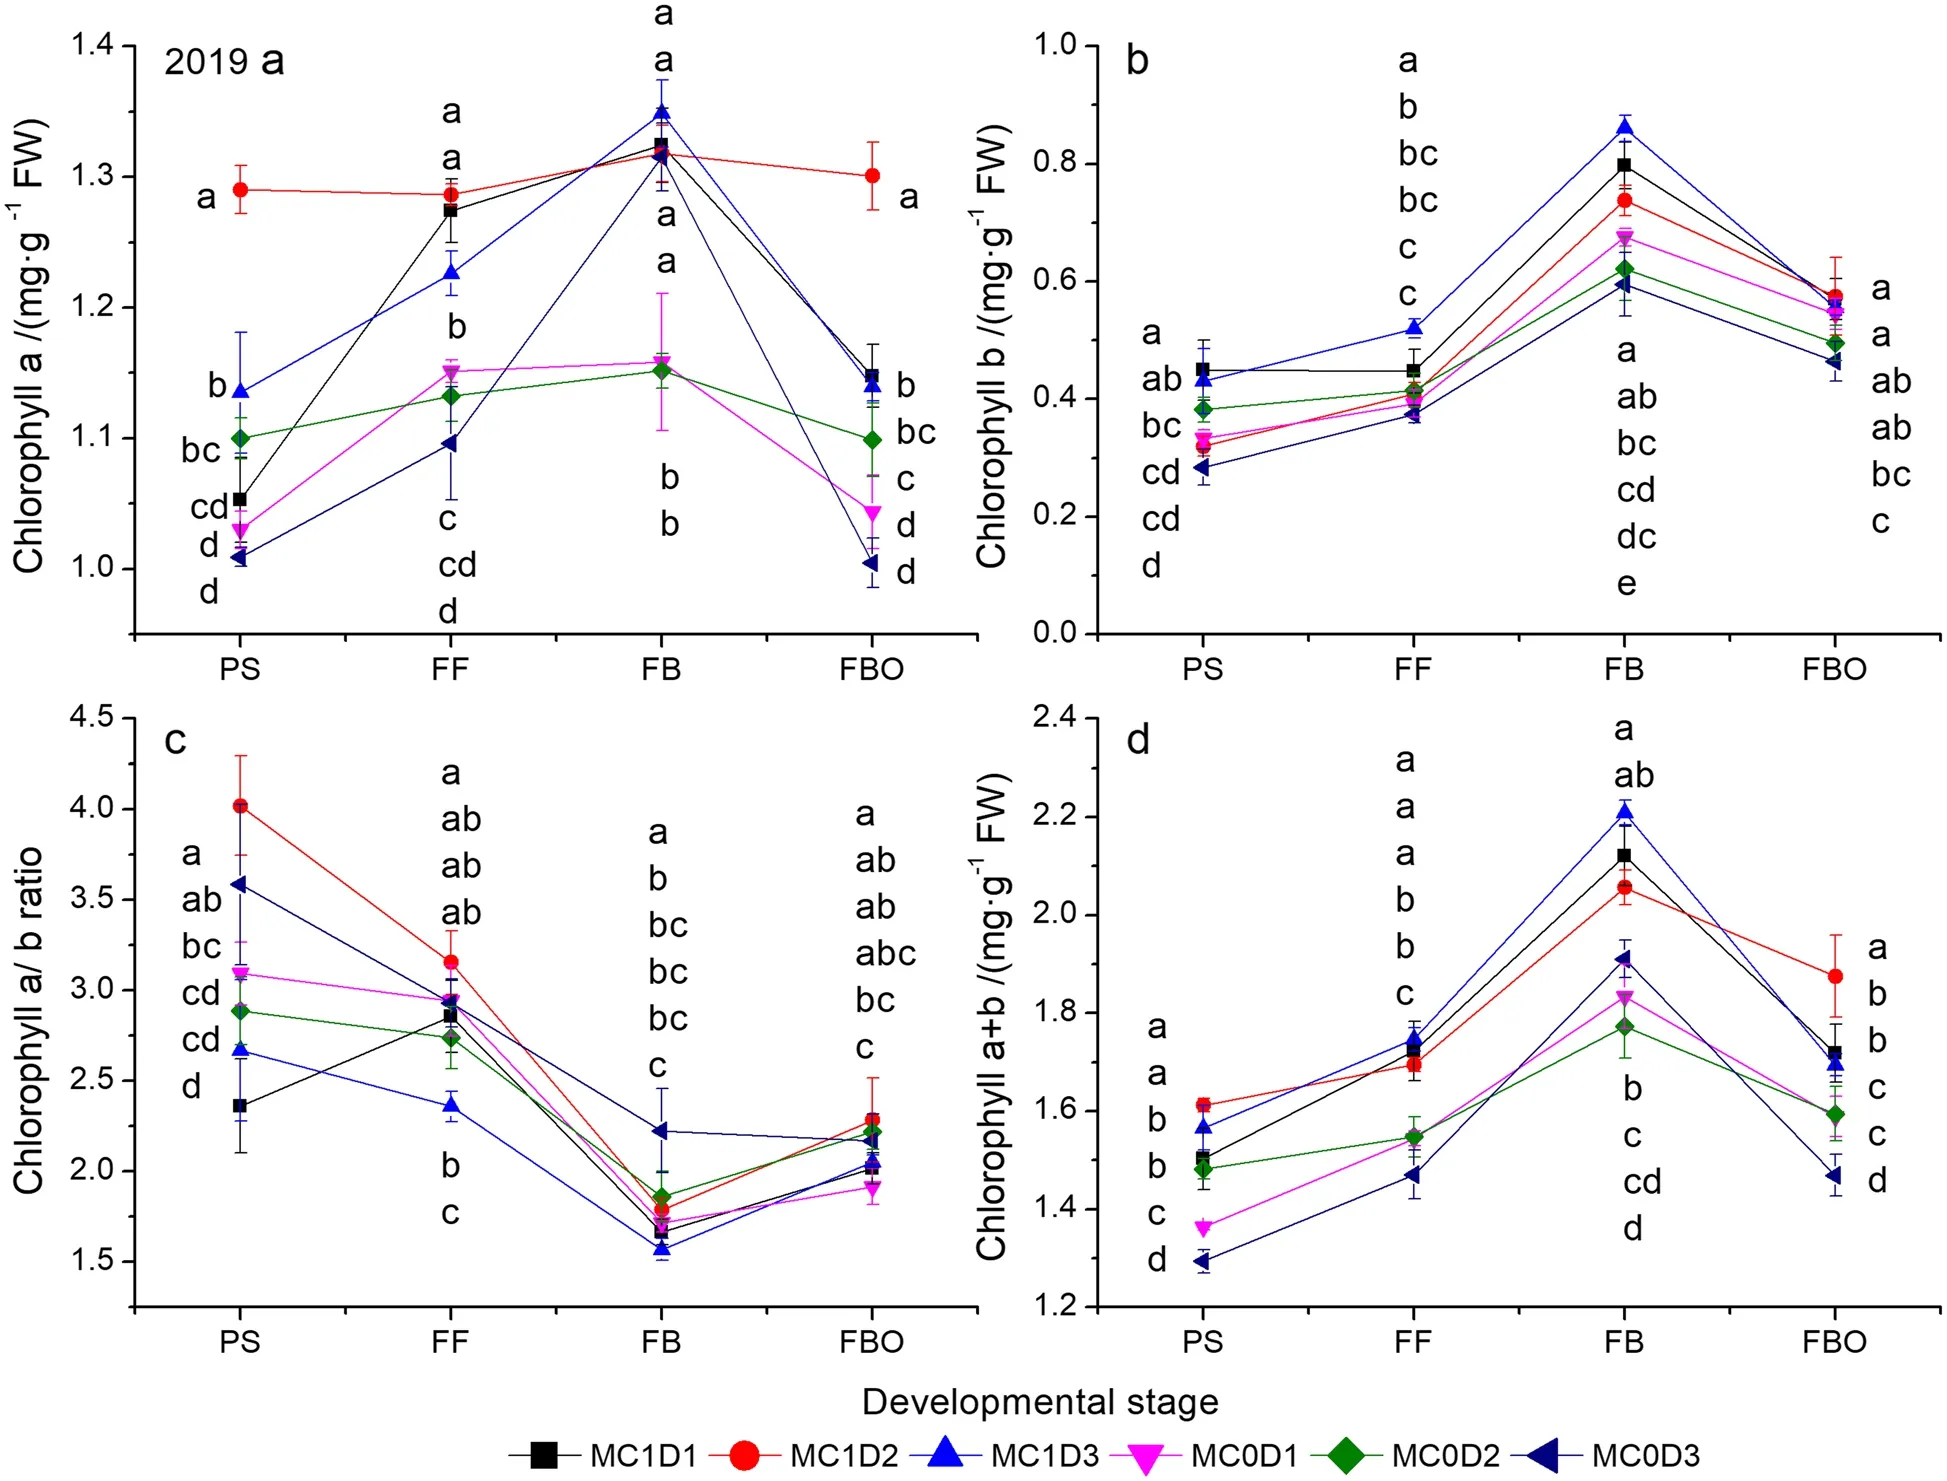
Fig.2 Changes of chlorophyll a (a), chlorophyll b (b), chlorophyll a/b (c), and chlorophyll a + b (d) concentrations as functions of developmental stage in 2019.Each data point represents the mean ± SD (n = 3).At each sampling date, data points not sharing a common letter indicate significant differences at P < 0.05
MC, PPD, and sampling time significantly affected the activities of SPS, SuSy, Rubisco, and FBPase except the PPD effect on the SuSy activity in 2019, and the MC effect on the Rubisco activity in 2020, respectively (Supplementary Table S6).The MC by PPD interaction effects were significant for the activities of SPS, SuSy, Rubisco,and FBPase except for the SPS activity in 2020.The curve of Rubisco and FBPase activities showed a singlepeak commonly at the FB stage (Figs.6 and 7).The SuSy activity was typically increased up to the FF stage and then decreased down to the FBO stage.The SPS activity declined to the FB stage and then climbed up to the FBO stage.MC1D3 exhibited the maximal Rubisco activity at the FB stage in both years, which was 8.1% ~ 43.6% higher in 2019, and 2.5% ~ 53.2% higher in 2020 than those in other treatments (Figs.6a, 7a).Moreover, MC1D3 continued to remain the maximal Rubisco activity at the subsequent FBO stage in 2020 (Fig.7a).Nevertheless,the Rubisco activity averaged across three PPD levels in the MC treatment was reduced at the PS stage in 2019 (P= 0.024) and the FF stage in 2020 (P= 0.040), but was 17.2% and 28.1% higher than those in the MC free treatment at the FBO stage in 2019 and 2020, respectively.Averaged across three PPD levels, the FBPase activity was improved by the MC application at the FBO stage in both years (P= 0.017 in 2019,P= 0.002 in 2020).However, the MC application significantly reduced the FBPase activity at the PS stage (P= 0.029) and FF stage (P= 0.007) in 2020(Figs.6b, 7b).Similarly, the MC application significantly decreased the SPS activity at the FBO stage (P= 0.001 in 2019,P= 0.053 in 2020), and the SuSy activity at the FF stage (P< 0.001 in 2019,P= 0.045 in 2020).
Nonstructural carbohydrate transformation rate

Fig.3 Changes of chlorophyll a (a), chlorophyll b (b), chlorophyll a/b (c), and chlorophyll a + b (d) concentrations as functions of developmental stage in 2020.Each data point represents the mean ± SD (n = 3).At each sampling date, data points not sharing a common letter indicate significant differences at P < 0.05
Year, PPD, PPD × MC, and PPD × MC × year effects significantly affected the TRs of sucrose, hexose, starch,and TNC concentrations (Supplementary Table S7).MC application significantly affected the TRs of starch and TNC, but not the TRs of sucrose and hexose (Supplementary Table S7, Table 3).The middle PPD of 4.5 plants·m-2had a lower TR of starch in 2019, and lower TRs of TNC in both years compared with the lower and higher PPD levels (Table 4).The TRs of starch and TNC concentrations were increased by the MC application(Table 4).Among three combinations of MC application and PPD of three levels, MC1D3 exhibited a higher TR in starch than both of others in 2020 (Table 4).The TR of starch was increased by 15.3% ~ 52.7% in 2019, and by 9.8% ~ 11.1% in 2020 in MC1D3 than those in the three MC-free treatments.
Correlations between the Rubisco activity and the Chl concentration
A linear regression model was employed to fit the relationship between the Rubisco activity and multiple Chl concentration (Fig.8).The regression fitting between the Rubisco activity and Chl a + b concentarion was better than that between the Rubico activity and Chl a concentration.Pooled across the period of the PS to FBO, the Rubisco activity was positively correlated with Chl a, Chl b, and Chl a + b concentration (Fig.8).
Correlations between the nonstructural carbohydrate concentration and the carbon metabolism enzyme activity
The SuSy activity was positively correlated with the hexose, sucrose, starch, and TNC concentration in both years (Fig.9).The correlations between SPS activity and the four nonstructural carbohydrate concentrations were significantly negative in 2020.The positive correlations between the Rubisco, and FBPase activities and sucrose,and hexose concentration were significant in 2020.There were highly significant and positive correlations between each two of those carbohydrate components and TNC in both years (P≤ 0.001).The SPS activity was negatively associated with the Rubisco and FBPase activities, while the latter two enzymes showed a significant and positive correlation in both years.
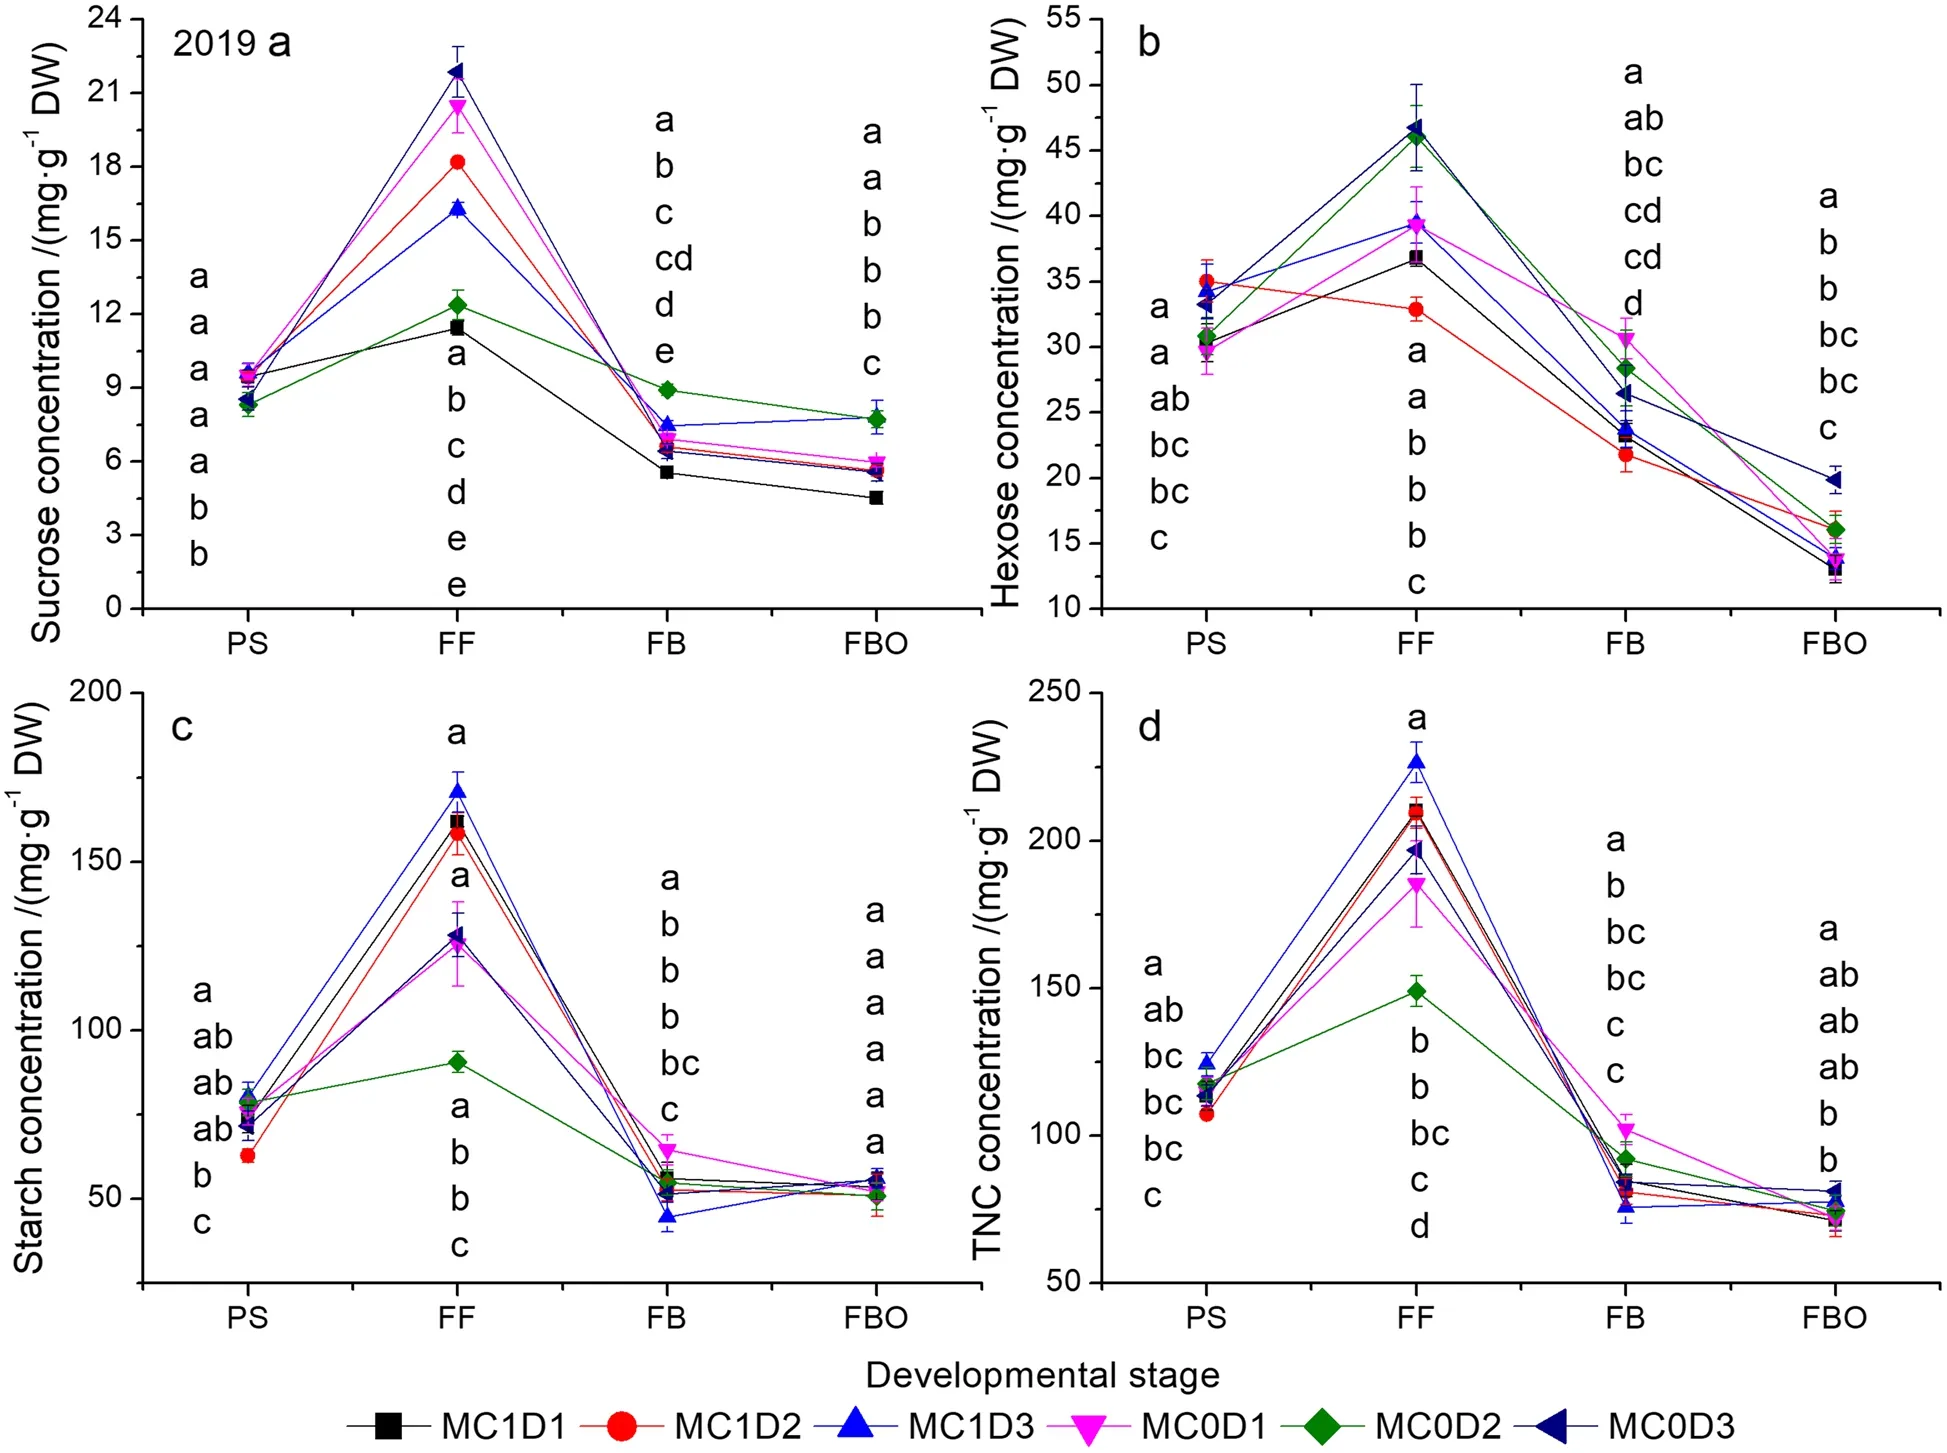
Fig.4 Changes of sucrose (a), hexose (b), starch (c), and TNC (d) concentrations as functions of developmental stage in 2019.Each data point represents the mean ± SD (n = 3).At each sampling date, data points not sharing a common letter indicate significant differences at P < 0.05.TNC:total nonstructural carbohydrate.The same as below
Discussion
Increased PPD coupled with MC application improves seed cotton yield through the enhancement of the biological yield
Cotton lint yield is determined by either three yield components (boll density per unit land area, boll weight, and lint percentage) or dry matter accumulation and partitioning.In terms of the latter, the biological yield was increased, but the harvest index decreased as the PPD level increased (Table 1), which was supported by Dai et al.(2015) and Zhang et al.(2016).The MC application decreased the biological yield but increased the harvest index in both years, thus did not alter seed cotton yield(Table 1), which agrees with Cordeiro et al.(2021) who reported that MC application improved cotton harvest index.The plausible explanation for it is that MC supply prompts more biomass allocation to reproductive organs through the inhibition of vegetative ones.Among the six combinations of PPD of three levels and MC of two levels, MC1D3 had the greatest seed cotton yield, which was largely attributed to the highest biological yield (Table 1).Also, MC1D3 displayed a maximum in lint yiled resulted from a concurrent greatest boll sensity (Tang and Luo 2023; Luo and Tang 2023).
Increasing PPD coupled with MC application delays leaf senescence as indicated by higher SLW, Chl concentration,and Rubisco activity at the FB to FBO stage
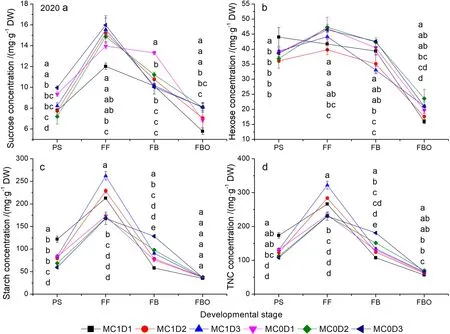
Fig.5 Changes of sucrose (a), hexose (b), starch (c), and TNC (d) concentrations as functions of developmental stage in 2020.Each data point represents the mean ± SD (n = 3).At each sampling date, data points not sharing a common letter indicate significant differences at P < 0.05
The SLW was roughly decreased with increasing PPD levels before the FBO stage, but the trend was reversed at the FBO stage (Fig.1a, b).At that time, MC1D3 exhibited the maximal SLW, being 0.3% higher in 2019,and 2.4% higher in 2020 than the second largest combination MC0D3.Pettigrew and Johnson (2005) reported an increased SLW by 4% due to MC application.Enhanced Chl concentration (either Chl a or Chl b) after cotton plants’ exposure to MC application has been well recognized (Reddy et al.1996; Tung et al.2018a).The Chl a, Chl b, and Chl a + b concentrations pooled across all PPD levels were consistently higher during the PS to FBO stages in the MC application regime than in the MC free regime (Supplementary Table S4,Figs.2 and 3).MC1D3 demonstrated the greatest Chl a, Chl b, and Chl a + b concentrations either at the FB stage in 2019 or at the FBO stage in 2020 (Figs.2 and 3).Chlorophyll concentration is an important indicator of leaf senescence (Kong et al.2016; Chen et al.2018).Rubisco is a crucial rate-limiting enzyme responsible for CO2fixation in the Calvin cycle during photosynthesis.The Rubisco activity showed a rising trend through the PS to the FB and then declined sharply down to the FBO.MC1D3 exhibited the maximum Rubisco activity at the FB stage in 2019, and at the FB and FBO in 2020.The Rubisco activity was 2.6% ~ 53.2% higher at the FB stage in both years, and 2.4% ~ 52.7% higher at the FBO stage in 2020 than those in other treatments (Figs.6a,7a).MC application-decreased Rubisco activity was observed at the early reproductive stage as indicated by lower activity at the PS stage in 2019 (P= 0.024) and the FF stage in 2020 (P= 0.040).The result accords with the studies by Reddy et al.(1996) and Tung et al.(2019)where the activity of RuBP carboxylase was decreased in MC-treated plants.However, in the late reproductive stage such as the FBO, the MC application improved the Rubisco activity by 17.2% in 2019, and 28.1% in 2020.In addition, the positive correlations between the Rubisco activity and Chl a, Chl b, and Chl a + b were detected in both years (Fig.8).Furthermore, delayed cotton leaf senescence due to increasing PPD has been observed(Dong et al.2006, 2012; Luo et al.2018).Taken together,MC1D3 was characterized by greater SLW, Chlorophyll concentration, and Rubisco activity at the late reproductive stage such as the FB and FBO stages, which should contribute to delayed leaf senescence together.
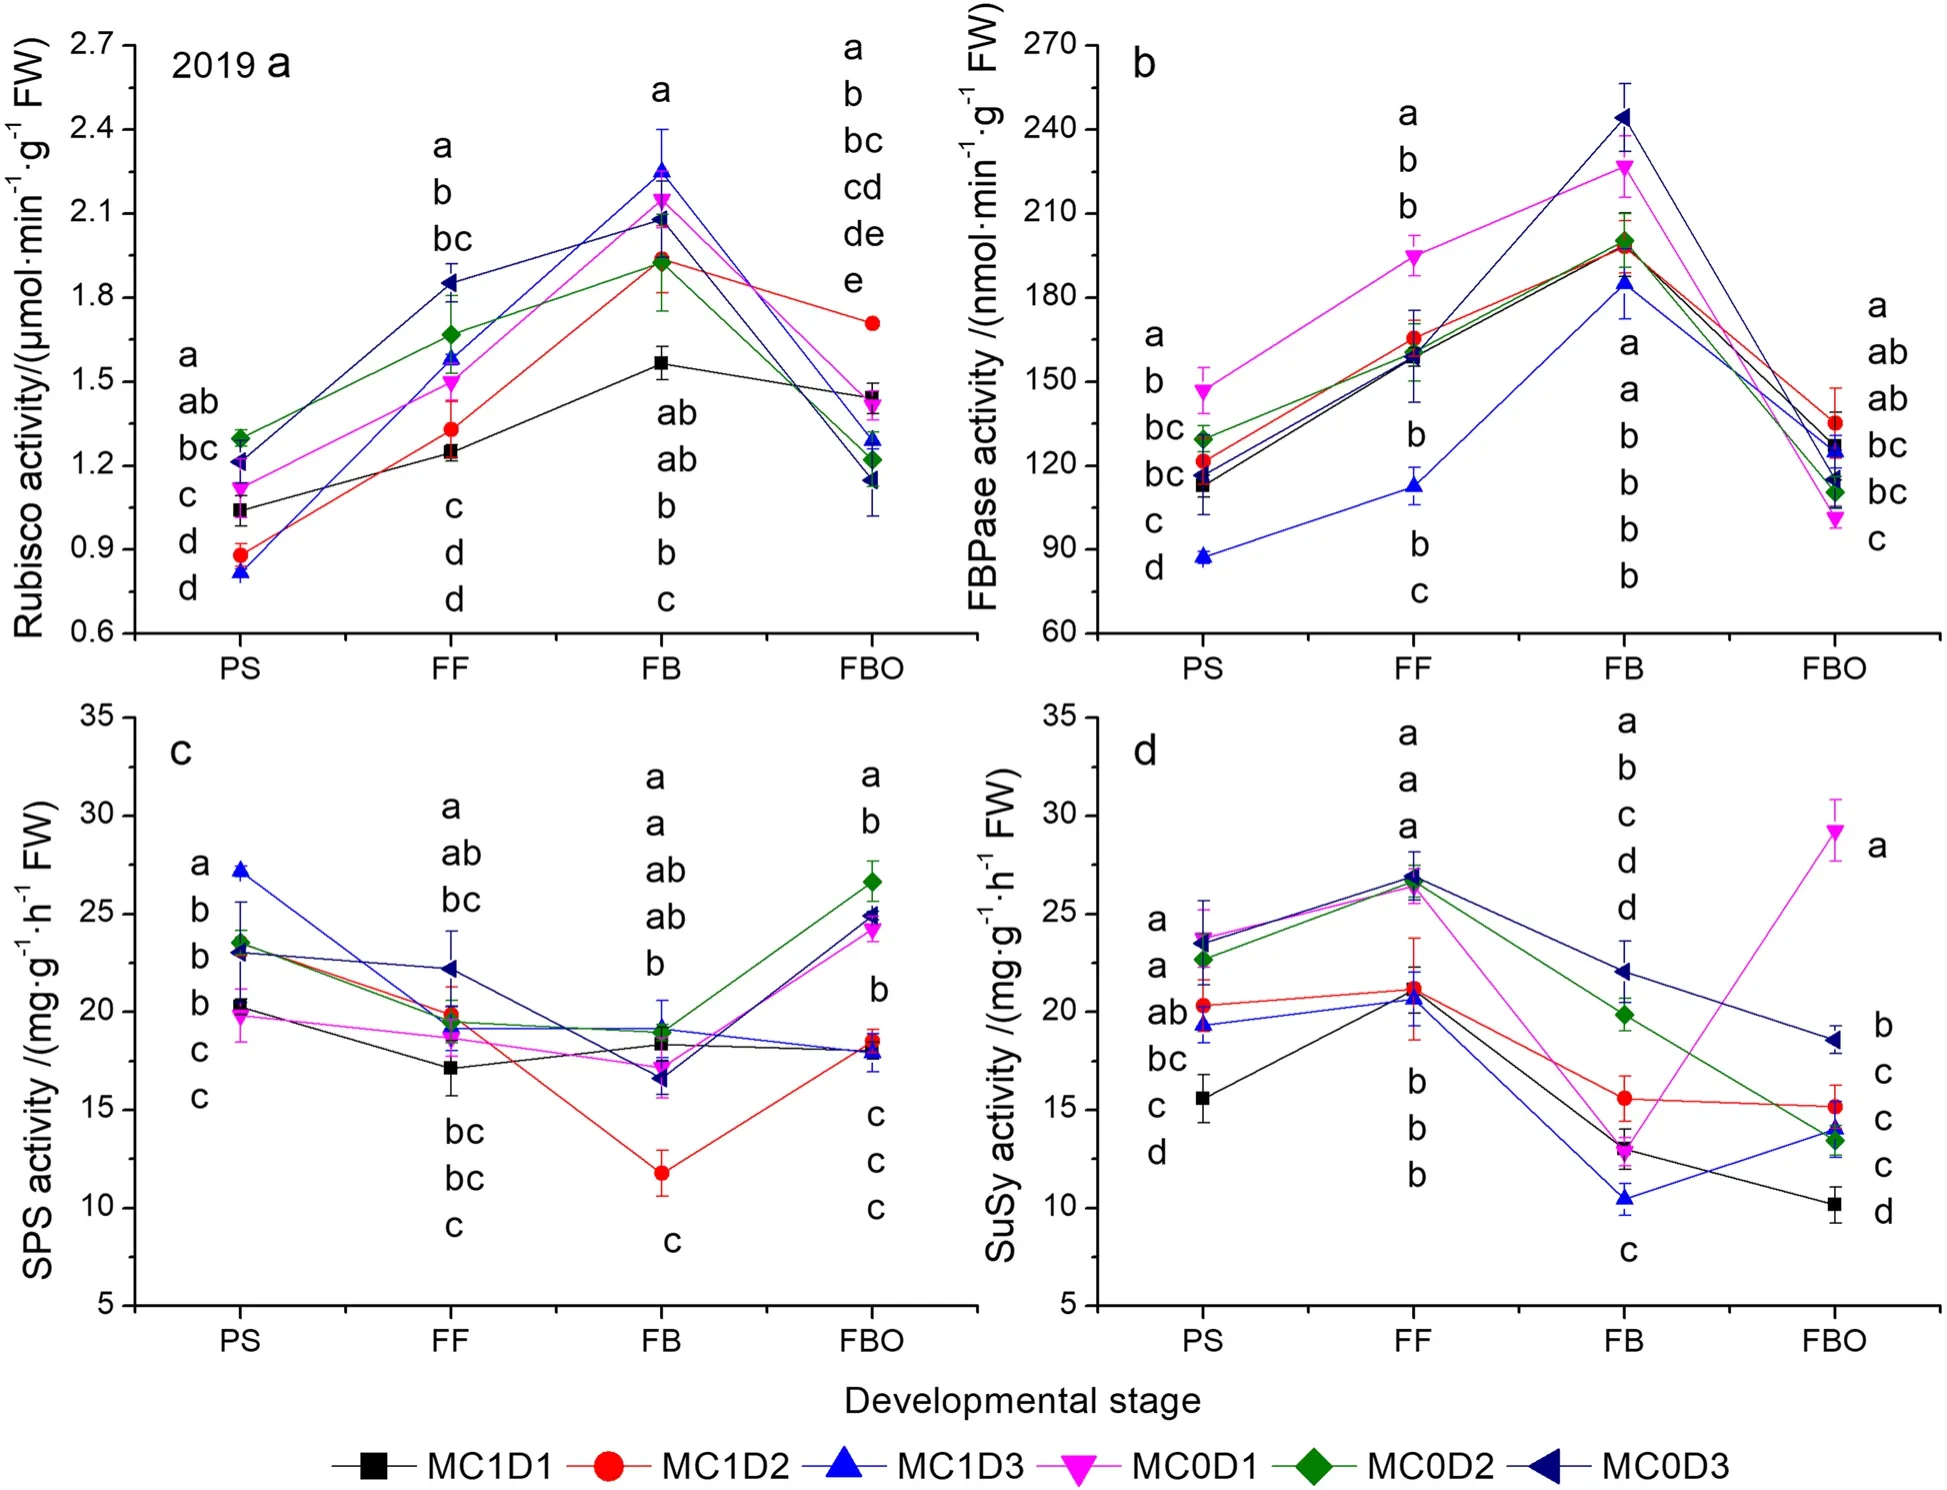
Fig.6 Changes of Rubisco (a), FBPase (b), SPS (c), and SuSy activities as functions of developmental stage in 2019.Each data point represents the mean ± SD (n = 3).At each sampling date, data points not sharing a common letter indicate significant differences at P < 0.05.Rubisco: ribulose bisphosphate carboxylase oxygenase; FBPase: fructose-1, 6-bisphosphatase; SPS: sucrose phosphate synthase; SuSy: sucrose synthase.The same as below
Increasing PPD coupled with MC application enhances starch and TNC concentrations at early reproductive growth and their utilization efficiency
All carbohydrate components and TNC concentrations peaked at the FF stage and then declined at the FBO stage (Figs.4 and 5).MC1D3 displayed higher starch and TNC concentrations at the FF stage, but no difference from or even lower than other treatments at the FBO stage over both years.Therefore, the greatest transformation rates of starch and TNC were produced in MC1D3(Table 4).The higher starch concentration of MC1D3 at the FF is expected to result in a lowerPnat that time throught the feedback inhibition of photosynthesis(Table 2, Figs.4c, 5c).On the other hand, the lowerPnmay be also the result of the decreased Rubisco activity,as supported by the observations that they were synergistically decreased in MC-treated cotton leaves (Tung et al.2018a, 2019; Reddy et al.1996).We have also found that bothPnand Rubisco activity were reduced by MC application at the FF stage in both years (Table 2, Figs.6a, 7a).An exceptional example comes from the report by Zhao and Oosterhuis (2000) who stated that MC application increased leaf CO2exchange rate.Notablely, abovePnwas measured on a single leaf rather than on a whole canopy.Canopy gross photosynthesis was enhanced within 48 h after MC application (Hodges et al.1991).MC1D3 is expected to enhance the canopy photosynthetic production on a population basis by increasing the population density as indicated by the first or second largest Leaf area index throught the whole reproductive growth phase (Tang and Luo 2023).Mao et al.(2014) found that increasing plant density significantly enhanced light use efficiency as mediated by improving light distribution in the cotton canopy.Moreover, the population photosynthetic production is potentially further elevated by the additional MC application, because the measure typically inhibits leaf expansion, and creates compact plant stature, thus allowing more light penetration to the low-middle canopy.Gonias et al.(2012) reported that radiation use efficiency was significantly enhanced by 33.2% in MC application treatment, which was probably due to changes in leaf photosynthetic capacity and light configuration throughout the cotton canopy.
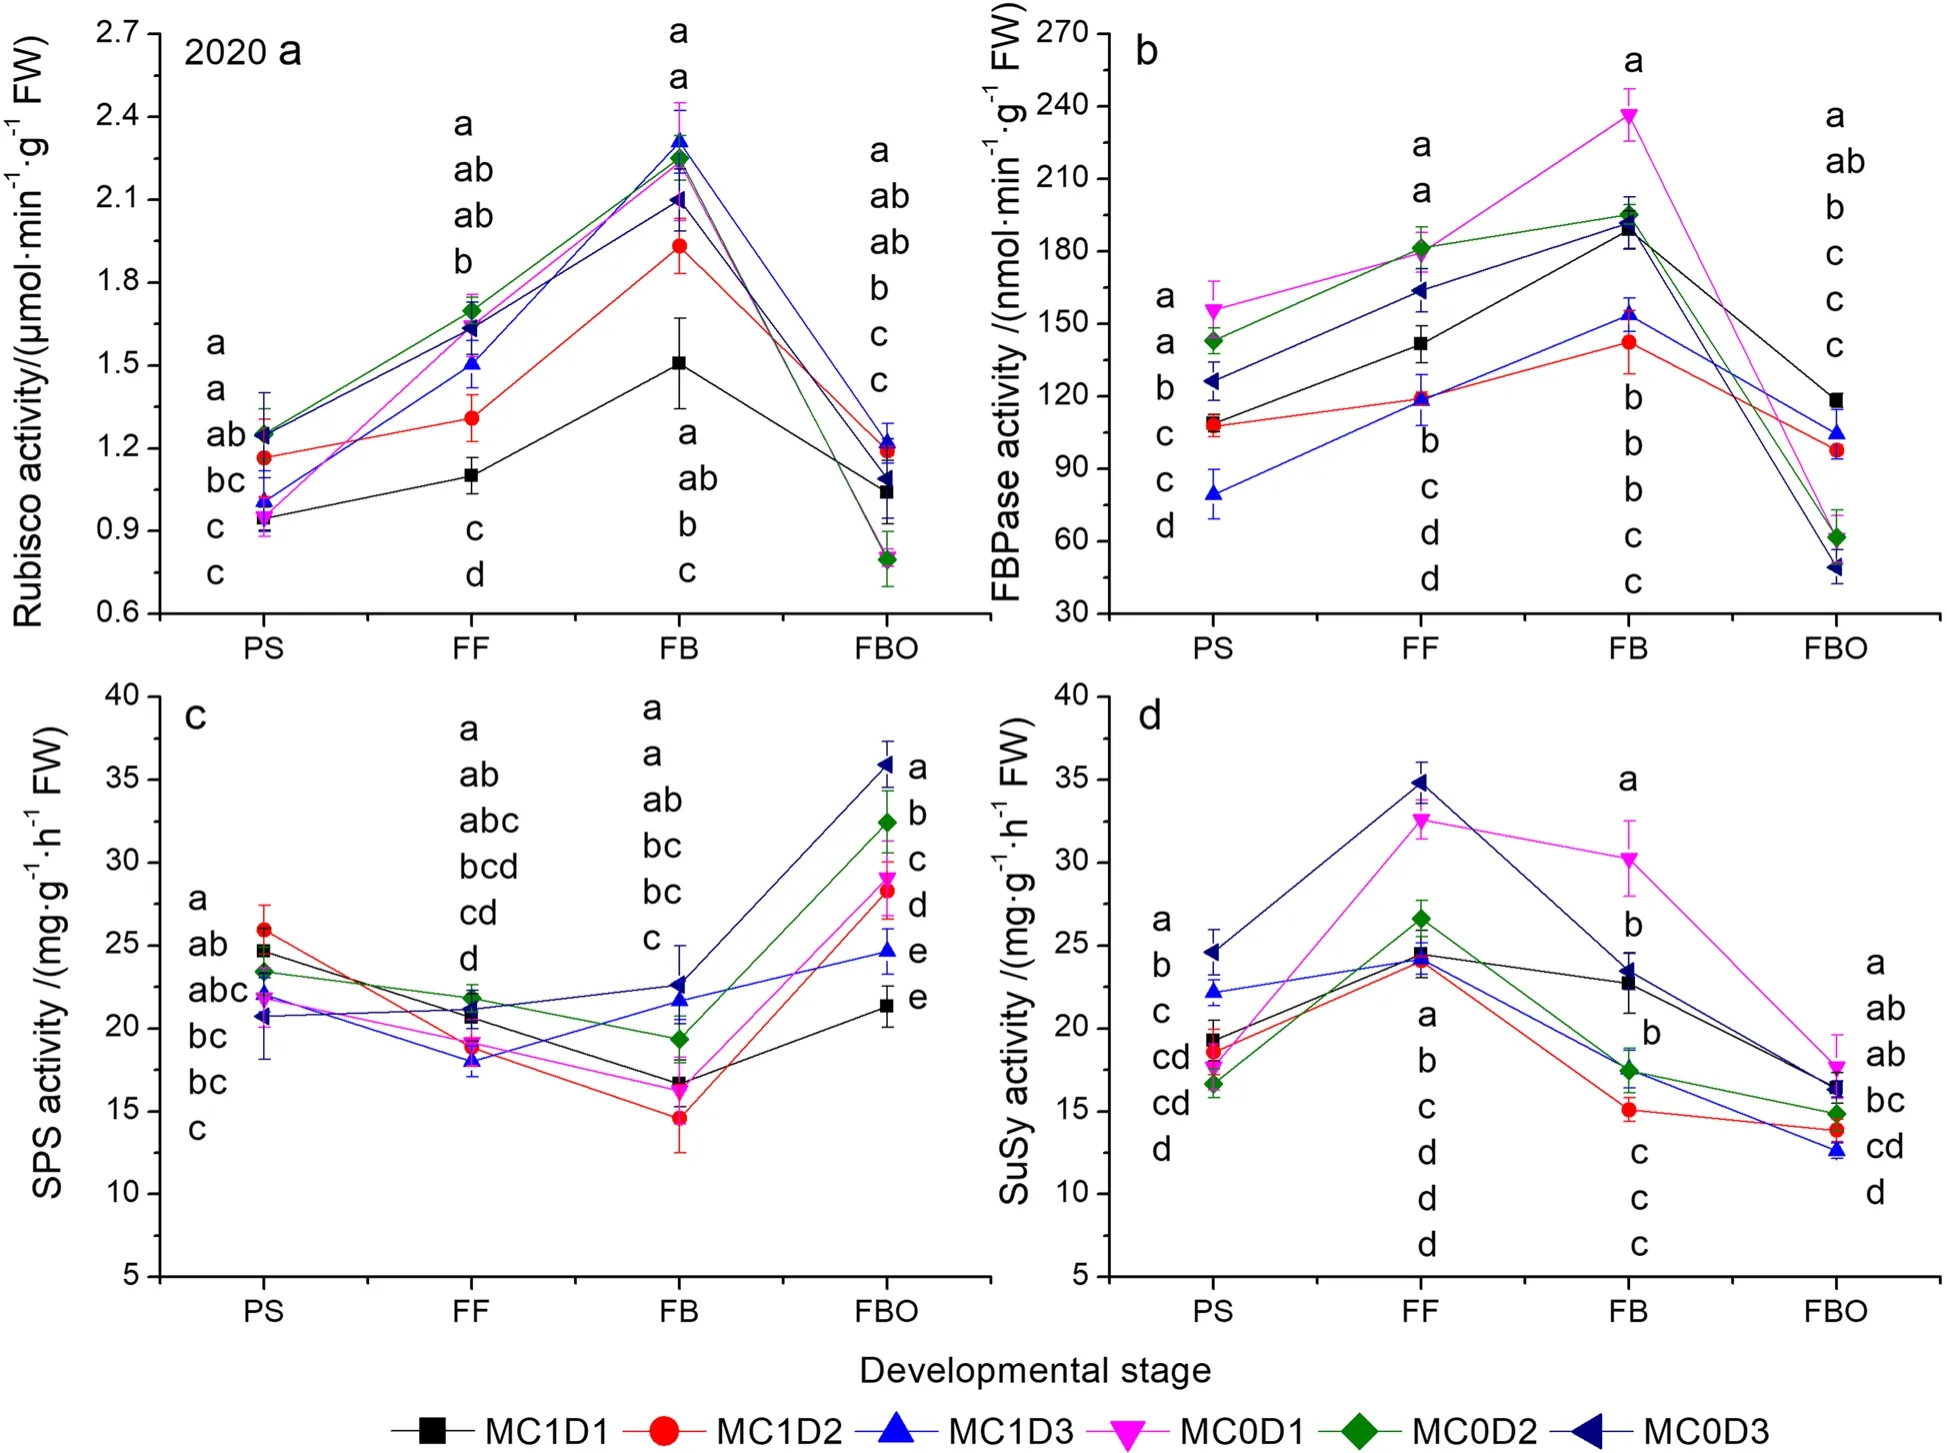
Fig.7 Changes of Rubisco (a), FBPase (b), SPS (c), and SuSy activities as functions of developmental stage in 2020.Each data point represents the mean ± SD (n = 3).At each sampling date, data points not sharing a common letter indicate significant differences at P < 0.05

Table 3 The maximum, minimum, and transformation rate of sucrose and hexose concentrations in the main-stem functional leaves of upland cotton in 2019 and 2020
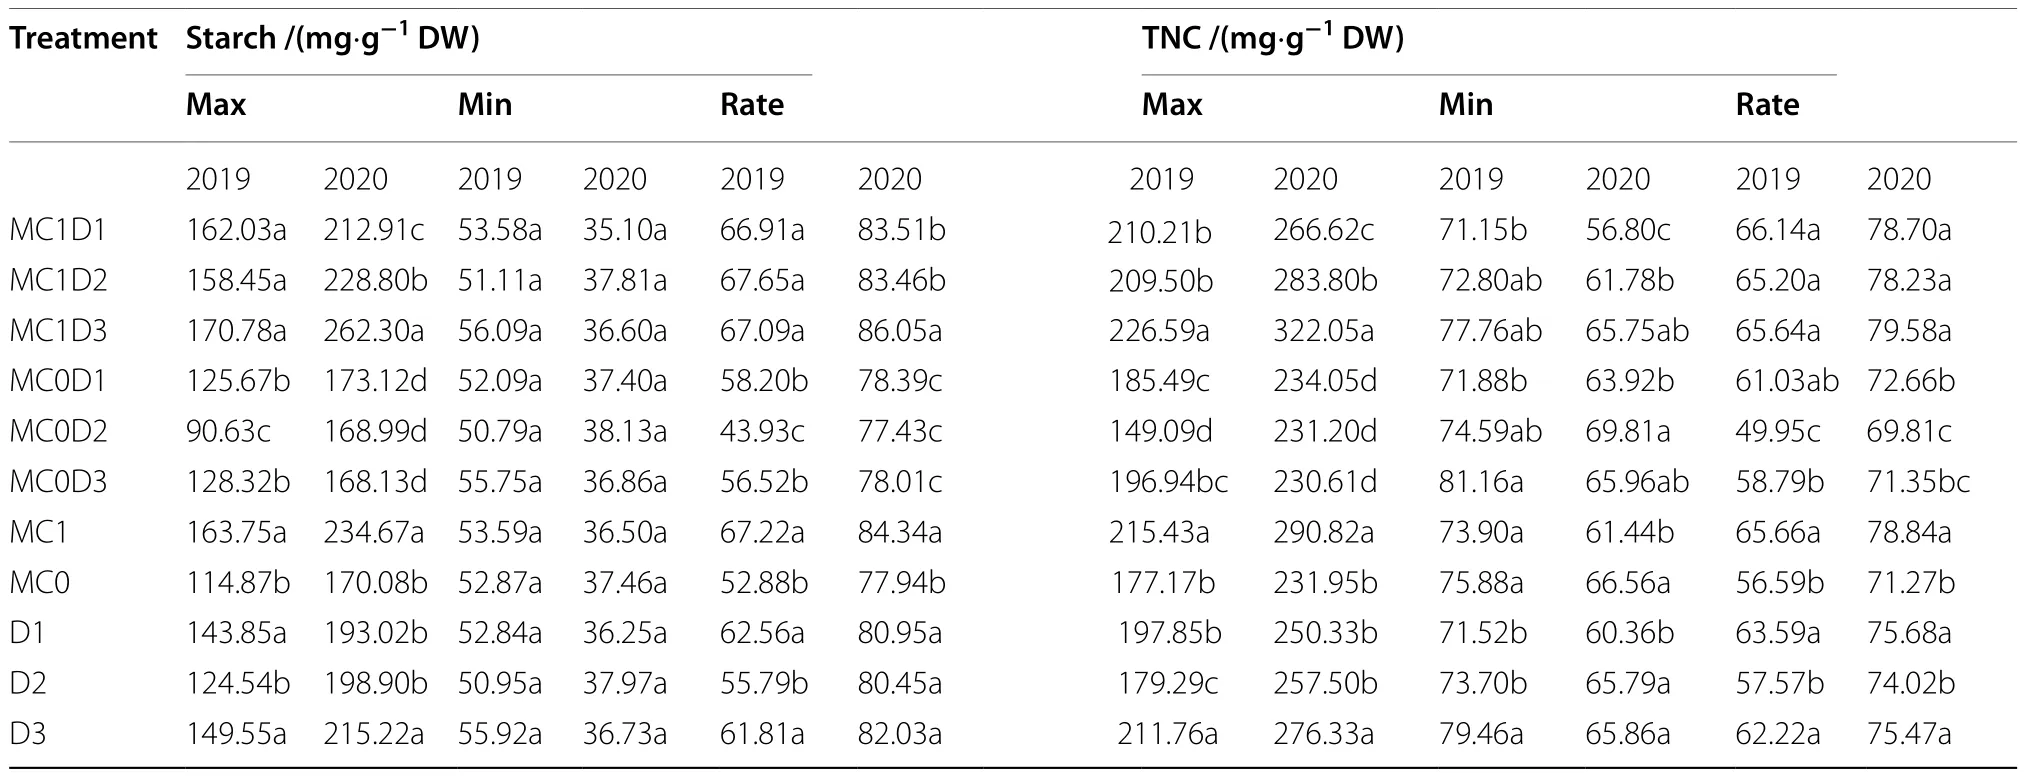
Table 4 The maximum, minimum, and transformation rate of starch and total nonstructural carbohydrate (TNC) concentrations in the main-stem functional leaves of upland cotton in 2019 and 2020

Fig.8 Correlations between Rubisco activity and Chl a, Chl b, and Chl a + b concentrations in 2019 and 2020, respectively
Starch is a predominant form of carbon reserves in plants.High starch and TNC concentration at the FF stage(early reproductive growth) in MC1D3 imply a higher carbon supply potential that is required for heavy boll load,which accords with the previous observation of a higher boll density in MC1D3 relative to other treatments in both years (Tang and Luo 2023; Luo and Tang 2023).In addition, the increased starch content induced by MC application did not affect photoassimilate export from leaves to young bolls (Zhao and Oosterhuis 2000).The combination of higher PPD and MC application is prone to render boll setting more concentrated, increasing synchronous demand for photosynthate (Gwathmey and Clement 2010; Chen et al.2021).The high transformation rate of starch throughout the FF to FBO stage in MC1D3 probably means a rapid starch degradation into soluble sugars for translocating into developing bolls, which help to synchronize boll maturation.

Fig.9 Correlations between the activities of Rubisco, FBPase, SPS, and SuSy and the concentrations of hexose, sucrose, starch, and TNC in 2019 and 2020, respectively
Conclusions
PPD of three levels (D1: 2.25 plants·m-2, D2: 4.5 plants·m-2, and D3: 6.75 plants·m-2) and MC dosage of two levels (MC0: 0 g·ha-2, MC1: 82.5 g·ha-2) were combined to create six treatments.Among them, the highest PPD of 6.75 plants·m-2combined with MC application (MC1D3) exhibited the highest seed cotton yield and biological yield.The sucrose, hexose,starch, and TNC concentration peaked at the FF stage and then declined to a minimum at the FBO stage.MC1D3 exhibited higher starch and TNC concentration compared with others at the FF stage.Since the concentration of starch and TNC at the FBO stage were either equal to or lower in MC1D3 than those in others, higher TRs were produced based on the interval of the FF to FBO stages.The high carbohydrate concentration and utilization efficiency in cotton leaves manifest a potential large source capacity with MC1D3.Higher SLW, Chlorophyll concentration, and Rubisco activity at the late reproductive stage help MC1D3 with delaying leaf senescence together.It is suggested that increasing PPD coupled with MC application improves cotton yield by enhancing leaf carbohydrate production and utilization efficiency and delaying leaf senescence.
Supplementary Information
The online version contains supplementary material available at https:// doi.org/ 10.1186/ s42397- 023- 00157-8.
Additional file 1: Supplementary Table S1.Mean squares from analysis of variance of the seed cotton yield, biological yield, and harvest index in 2019 and 2020.Supplementary Table S2.Mean squares from analysis of variance of the net photosynthetic rate (Pn) and SPAD value in the main-stem functional leaves of upland cotton at the early flowering (EF)and flowering and boll setting (FB) in 2019 and 2020.Supplementary
Table S3.Mean squares from analysis of variance of specific leaf weight in 2019 and 2020.Supplementary Table S4.Mean squares from analysis of variance of the chlorophyll concentration in the main-stem functional leaves of upland cotton in 2019 and 2020.Supplementary Table S5.Mean squares from analysis of variance of the nonstructural carbohydrate concentration in the main-stem functional leaves of upland cotton in 2019 and 2020.Supplementary Table S6.Mean squares from analysis of variance of carbon metabolism-related enzyme activities in the main-stem functional leaves of upland cotton in 2019 and 2020.Supplementary
Table S7.Mean squares from analysis of variance of the maximum, minimum, and transformation rate of nonstructural carbohydrate concentration in the main-stem functional leaves of upland cotton in 2019 and 2020.
Authors’ contributions
Luo HL: Formal analysis; investigation; methodology; validation; visualization.Zhang ZX: Investigation; methodology; validation.Wu JF: investigation; methodology.Wu ZJ: Resources.Wen TW: Project administration;writing–review and editing.Tang FY: Conceptualization; data curation;formal analysis; funding acquisition; supervision; writing-original draft;writing–review and editing.All authors have read and agreed to the published version of the manuscript.
Funding
This work was supported by the National Natural Science Foundation of China(grant no.31960385) and the Natural Science Foundation of Jiangxi, China(grant no.20212BAB215009).
Availability of data and materials
The data presented in this study are available on request from corresponding author.
Declarations
Ethics approval and consent to participate
Not applicable.
Consent for publication
Not applicable.
Competing interests
The authors declare no conflict of interest.
Received: 27 July 2023 Accepted: 24 October 2023

杂志排行
Journal of Cotton Research的其它文章
- Are yarn quality prediction tools useful in the breeding of high yielding and better fibre quality cotton (Gossypium hirsutum L.)?
- Risk of control failure to insecticides malathion, profenophos + cypermethrin mixture, and fipronil in boll weevil (Coleoptera:Curculionidae) populations from Bahia, Brazil
- Feasibility study of assessing cotton fiber maturity from near infrared hyperspectral imaging technique
- Mepiquat chloride priming confers the ability of cotton seed to tolerate salt by promoting ABA-operated GABA signaling control of the ascorbate–glutathione cycle
- Enhancing waterlogging tolerance in cotton through agronomic practices
- Biocontrol potential of entomopathogenic nematode, Heterorhabditis indica against pink bollworm, Pectinophora gossypiella (Saunders)(Lepidoptera: Gelechiidae)
