Development and validation of machine learning models for nonalcoholic fatty liver disease
2024-01-02HongPngShoJiDunLingPnMiYunWngJiLingChnYiChongWngShuKunYo
Hong-Y Png ,Sho-Ji Dun ,Ling Pn ,Mi-Yun Wng ,Ji-Ling Chn ,Yi-Chong Wng ,Shu-Kun Yo ,∗
a Graduate School of Beijing University of Chinese Medicine,Beijing 10 0 029,China
b Department of Gastroenterology,China-Japan Friendship Hospital,Beijing 10 0 029,China
c Phase 1 Clinical Trial Center,Deyang People’s Hospital,Deyang 6180 0 0,China
d School of Public Health,Tongji Medical College,Huazhong University of Science and Technology,Wuhan 430030,China
e Center of Integrated Traditional Chinese and Western Medicine,Beijing Ditan Hospital,Capital Medical University,Beijing 100102,China
Keywords: Nonalcoholic fatty liver disease Machine learning Predictive factors
ABSTRACT Background: Nonalcoholic fatty liver disease (NAFLD) had become the most prevalent liver disease worldwide.Early diagnosis could effectively reduce NAFLD-related morbidity and mortality.This study aimed to combine the risk factors to develop and validate a novel model for predicting NAFLD.Methods: We enrolled 578 participants completing abdominal ultrasound into the training set.The least absolute shrinkage and selection operator (LASSO) regression combined with random forest (RF) was conducted to screen significant predictors for NAFLD risk.Five machine learning models including logistic regression (LR),RF,extreme gradient boosting (XGBoost),gradient boosting machine (GBM),and support vector machine (SVM) were developed.To further improve model performance,we conducted hyperparameter tuning with train function in Python package ‘sklearn’.We included 131 participants completing magnetic resonance imaging into the testing set for external validation.Results: There were 329 participants with NAFLD and 249 without in the training set,while 96 with NAFLD and 35 without were in the testing set.Visceral adiposity index,abdominal circumference,body mass index,alanine aminotransferase (ALT),ALT/AST (aspartate aminotransferase),age,high-density lipoprotein cholesterol (HDL-C) and elevated triglyceride (TG) were important predictors for NAFLD risk.The area under curve (AUC) of LR,RF,XGBoost,GBM,SVM were 0.915 [95% confidence interval (CI):0.886–0.937],0.907 (95% CI: 0.856–0.938),0.928 (95% CI: 0.873–0.944),0.924 (95% CI: 0.875–0.939),and 0.900 (95% CI: 0.883–0.913),respectively.XGBoost model presented the best predictive performance,and its AUC was enhanced to 0.938 (95% CI: 0.870–0.950) with further parameter tuning.Conclusions: This study developed and validated five novel machine learning models for NAFLD prediction,among which XGBoost presented the best performance and was considered a reliable reference for early identification of high-risk patients with NAFLD in clinical practice.
Introduction
Nonalcoholic fatty liver disease (NAFLD) is a clinical pathological syndrome characterized by excessive fat accumulation in hepatocytes,independent of alcohol-related causes and identified liver injury.With an adult prevalence rate of about 25.24%,NAFLD has become the most prevalent liver disease worldwide as the rate of obesity rises [1].People with NAFLD have higher risk to develop liver cirrhosis,hepatocellular carcinoma,and miscellaneous diseases including type 2 diabetes mellitus,cardiovascular disorders and chronic kidney diseases,which in turn affect their health and life quality and increase social economic burden [2,3].According to the Markov model built by Younossi et al.more than 64 million people have NAFLD in the USA,with direct medical costs over 103 billion USD annually [4].In China,the economic burden caused by NAFLD is unclear,but the population with NAFLD is estimated to reach 314.58 million by 2030 [5].There are numerous undiagnosed and untreated NAFLD patients,due to deficiency of diagnostic tools and effective drugs.Without timely improvement of the status quo and public health strategies,both the prevalence and incidence of hepatocellular carcinoma in China will be the highest in the world [6].Therefore,it is crucial to explore the associated risk factors and effective practical screening approaches for NAFLD to lower the morbidity and mortality,and the economic burden.
As technology advances,artificial intelligence has made breakthroughs in the medical field.As a core technology of artificial intelligence,machine learning could be utilized to acquire knowledge more efficiently and develop multi-factor predictive model more accurately compared to traditional statistical model.Machine learning is particularly useful in analyzing massive high-dimensional clinical data [7].However,previous studies [8–10]provided limited machine learning references for predicting NAFLD.Based on the patients with histologically confirmed NAFLD,Canbay et al.[8]developed a machine learning model to differentiate between nonalcoholic fatty liver (NAFL)and nonalcoholic steatohepatitis (NASH) with age,glycosylated hemoglobin (HbA1c),gamma-glutamyl transpeptidase,adiponectin and caspase-cleaved serum CK-18 (M30);the area under curve(AUC) is 0.734 [95% confidence interval (CI): 0.657–0.811].Using the patients with biopsy-proven NAFLD,Perakakis et al.[9]developed a model to differentiate NASH,NAFL,and health status with lipids,hormones and glycans.The model presented an AUC of 0.92 with 20 variables and an AUC of 0.83 with 10 variables for NAFL,while it presented an AUC of 0.96 with 20 variables and an AUC of 0.98 with 10 variables for NASH.However,liquid chromatography-mass spectrometry is needed to measure those variables,which is unavailable in regular settings and therefore unfeasible in clinical practice.Ma et al.[10]developed a model to predict NAFLD with alanine aminotransferase/aspartate aminotransferase (ALT/AST),white blood cells,alpha-L-fucosidase,hemoglobin,triglyceride (TG) and gamma-glutamyl transpeptidase.The AUCs for logistic regression (LR),random forest (RF) and support vector machine (SVM) are 0.814,0.837 and 0.810,respectively.However,previous studies draw conclusions from comparatively small and poor representative samples.In addition,some measurements used in those studies are difficult to obtain,which limits the clinical application to some extent.
Visceral adiposity index (VAI),a novel index of body fat and a research hotspot,is calculated with body mass index (BMI),waist circumference (WC),TG and high-density lipoprotein cholesterol(HDL-C),and has become a hot topic of research in obesity-related diseases.All these measurements are commonly used and readily accessible in clinical practice.A study [11]suggests that VAI is better to reflect individual’s fat distribution and visceral adipose accumulation than BMI or WC alone and is considered a significant indicator of visceral adipose function and insulin sensitivity.It has been proven that NAFLD development is closely associated with insulin resistance,dyslipidemia and obesity,especially abdominal obesity.And the relationship between VAI and NAFLD has been studied widely in recent years.A four-year prospective cohort study [12]suggests that VAI level is an independent risk factor for NAFLD and has a level-incidence relationship with the likelihood of developing NAFLD.
Therefore,our study intended to develop five machine learningbased prediction models including LR,RF,extreme gradient boosting (XGBoost),gradient boosting machine (GBM),and SVM using participants’ VAI data,as well as to compare the performance of these models for predicting the risk of NAFLD.
Patients and methods
Study cohort for prediction model
A total of 594 participants were consecutively enrolled into our study in the Center of Annual Health Checkup in China-Japan Friendship Hospital from September 2018 to May 2019.The inclusion criteria included: (1) 18–60 years old;(2) signing of informed consent form.Exclusion criteria: (1) heavy drinking history (weekly alcohol consumption ≥210 g for male or ≥140 g for female during the last 10 years based on the alcohol use disorders identification test questionnaire);(2) presence of evidence for secondary hepatic steatosis;(3) other liver-associated comorbidities (e.g.,viral hepatitis,autoimmune hepatitis,drug-induced liver injury,liver cirrhosis,liver cancer or decompensated liver disease);(4) major organ dysfunction or significant systemic diseases;(5) mental disorders or unable to complete examination;(6) pregnant or pregnancyplanning female;(7) missing of important clinical data.A total of 16 participants were excluded including heavy drinkers (n=11),data-missing individuals (n=3) and pregnant women (n=2).Finally,578 participants were included in this analysis.This study was carried out in accordance with the CONSORT reporting checklist.All study protocols were reviewed and approved by Clinical Research Ethics Committee of China-Japan Friendship Hospital (2018-110-K79-1).This study was conducted in accordance with theDeclarationofHelsinkiand all participants signed informed consent forms before enrollment.
We collected 1 outcome variable and 45 potential predictive variables from participants’ basic data.The outcome variable was fatty liver (Yes/No) evaluated by ultrasound.Demographic variables included sex,age,smoking,alcohol consumption and exercise time.Physiological variables included pulse,systolic blood pressure (SBP),diastolic blood pressure (DBP),height,weight,WC,abdominal circumference (AC) and hip circumference,of which WC and AC were measured as described in previous studies [13–15].Laboratory variables included white blood cells count,neutrophils count,lymphocytes count,red blood cells count,mean corpuscular volume (MCV),hemoglobin,platelets count,ALT,AST,total bilirubin (TBIL),alkaline phosphatase (ALP),total cholesterol (TC),TG,low-density lipoprotein cholesterol (LDL-C),HDL-C,serum creatinine (SCr),blood urea nitrogen,uric acid (UA),and fasting blood glucose (FBG).And we calculated or interpreted some derived variables such as BMI,VAI,TG/HDL-C,elevated ALT,ALT/AST,elevated TC,elevated TG,low HDL-C,high LDL-C,elevated UA,impaired fasting glucose (IFG),abdominal obesity,and metabolic syndrome.
External validation cohort and data
In order to validate the prediction models from the study cohort,we enrolled consecutively an external validation cohort in the Center of Annual Health Checkup in our hospital from January 2019 to April 2019.Magnetic resonance imaging (MRI) had higher diagnostic accuracy compared to ultrasound and was used for the validation cohort.A total of 131 participants completing MRI and laboratory tests were included using the same inclusion/exclusion criteria as the study cohort.MRI-proton density fat fraction (MRIPDFF),a quantitative and accurate tool as well as a gold standard for non-invasive measurement for liver fat content [16,17],was used for imaging evaluation.Details of participant recruitment and selection in this study were shown in Fig.1.
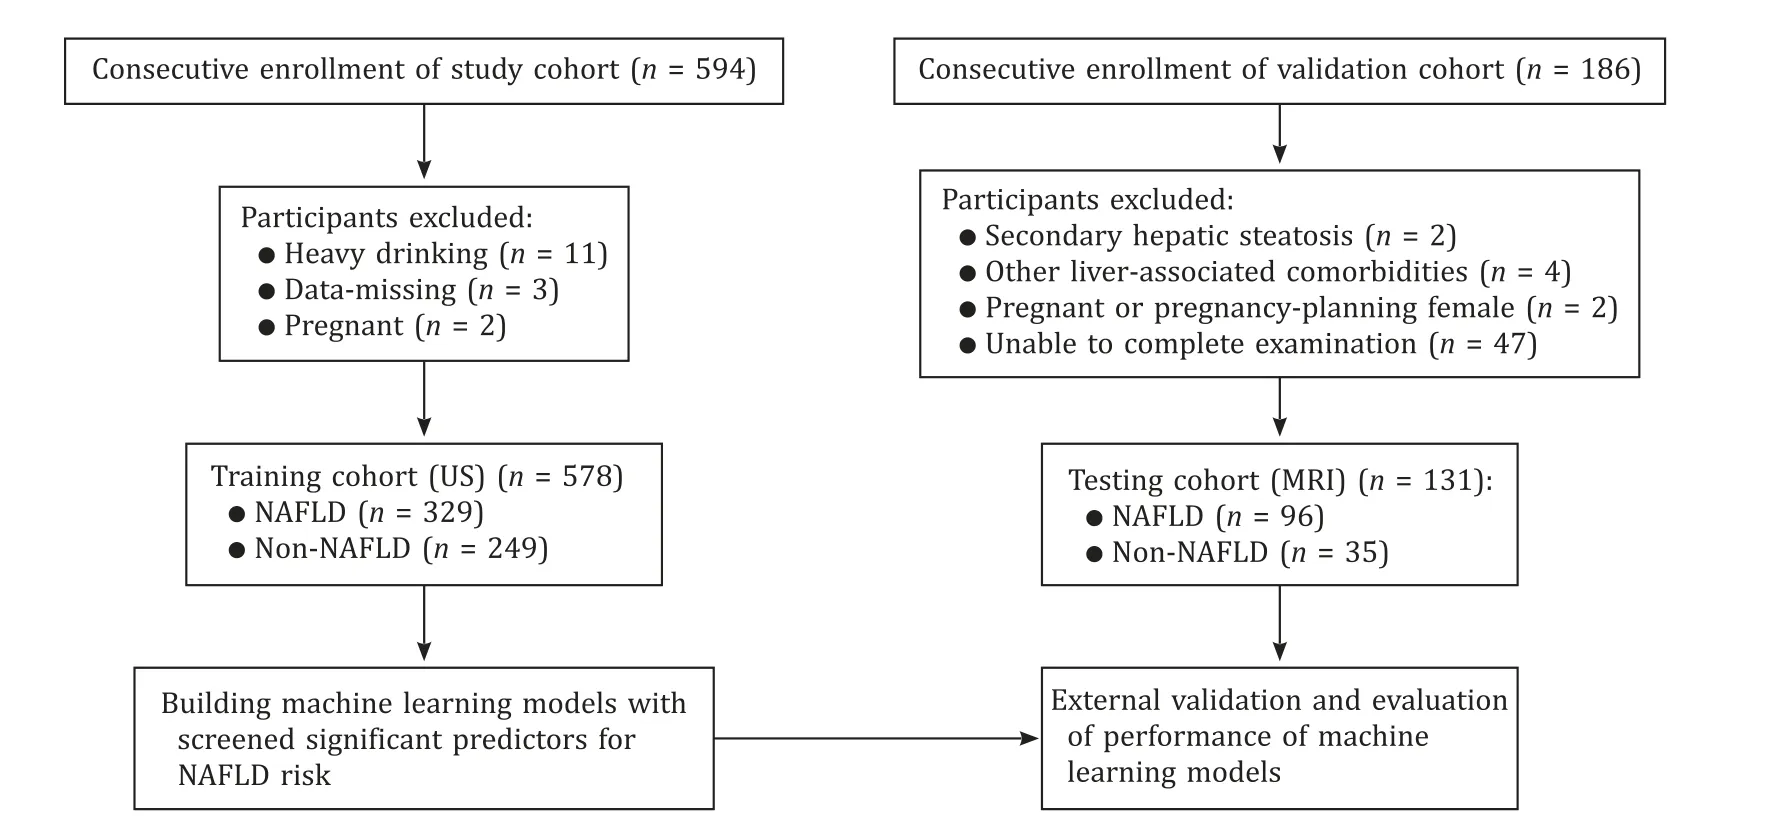
Fig.1.Flow diagram of the study design.NAFLD: nonalcoholic fatty liver disease;US: ultrasound;MRI: magnetic resonance imaging.
Definitions for NAFLD and derived variables
NAFLD was defined as fatty liver under ultrasound or MRIPDFF ≥ 5% according to the guideline of American Association for the Study of Liver Diseases,without any other etiological factors contributing to hepatic steatosis [18].Elevated ALT (≥ 40 IU/L),elevated TC (≥ 5.20 mmol/L),elevated TG(≥ 1.70 mmol/L),low HDL-C (<1.04 mmol/L),and high LDLC (≥ 3.37 mmol/L) were defined as described in the previous study [19].Elevated UA was defined as UA ≥ 420 μmol/L for male or ≥360 μmol/L for female,IFG was defined as FBG≥ 6.1 mmol/L,and abdominal obesity was defined as WC ≥90 cm for male or ≥85 cm for female.The metabolic syndrome was diagnosed when 3 or more of the following criteria were met [20]: abdominal obesity (WC ≥90 cm for male or ≥85 cm for female;elevated TG (≥1.70 mmol/L);low HDL-C (<1.04 mmol/L);high blood pressure (SBP ≥130 mmHg or DBP ≥85 mmHg or hypertension confirmed/treated);FBG ≥6.1 mmol/L or diabetes confirmed/treated.
Statistical analysis
Statistical analyses were performed with R software (version 3.6.2,R Foundation for Statistical Computing,Vienna,Austria).Descriptive statistics were used to analyze demographic/clinical characteristics.Continuous data were represented as either mean ±standard deviation for normally distributed variables or median(interquartile range) for non-normally distributed variables,while categorical variables were expressed with percentages.Student’st-test was used for grouped comparison for continuous data with normal distribution and homogeneity of variance;otherwise,nonparametric test was used.Chi-square test was used for comparison between different groups of categorical data.
Data dimension reduction was conducted with the least absolute shrinkage and selection operator (LASSO) regression combined with RF,which also facilitated selecting optimal predictive factors from the participants with NAFLD.LASSO regression was also used to reduce model complexity by penalizing the model to shrink its coefficients towards zero.R packages ‘glmnet’ and ‘Matrix’ were used.
In this study,we developed five machine learning algorithms in data modeling: LR,RF,XGBoost,GBM,and SVM.Predictive performance of models was compared using positive predictive value(precision),sensitivity (recall),harmonic mean between precision and recall (F1),and area under receiver operating characteristic(ROC) curve (AUC).To further improve model performance,we conducted hyperparameter tuning with train function in Python package ‘sklearn’.In the sensitive analysis,we conducted data augmentation with SMOTE algorithm to minimize the impact of data imbalance,and then remodeled the data.The Python packages‘sklearn’,‘XGBC’ were employed for machine learning algorithms.A two-tailedP<0.05 was considered statistically significant.
Results
Factor selection and participants’ characteristics
Using LASSO regression model (Fig.2),we found that age,AC,BMI,VAI,ALT,ALT/AST,and HDL-C were the first seven variables to examine the optimal predictive features in risk factors of the patients with NAFLD.We also included elevated TG as a risk factor for NAFLD in light of clinical practice.Therefore,eight key variables were finalized: age,AC,BMI,VAI,ALT,ALT/AST,HDL-C and elevated TG (Fig.3).

Fig.2.Predictor selection using the LASSO logistic regression model.A : LASSO coefficient profiles of the 19 clinical features.B : Identification of the optimal penalization coefficient lambda (λ) in the LASSO model using 10-fold cross-validation and the minimum criterion.The dotted vertical line was plotted at the value selected using 10-fold cross-validation in (A),for which the optimal λ resulted in 19 non-zero coefficients.LASSO: least absolute shrinkage and selection operator.
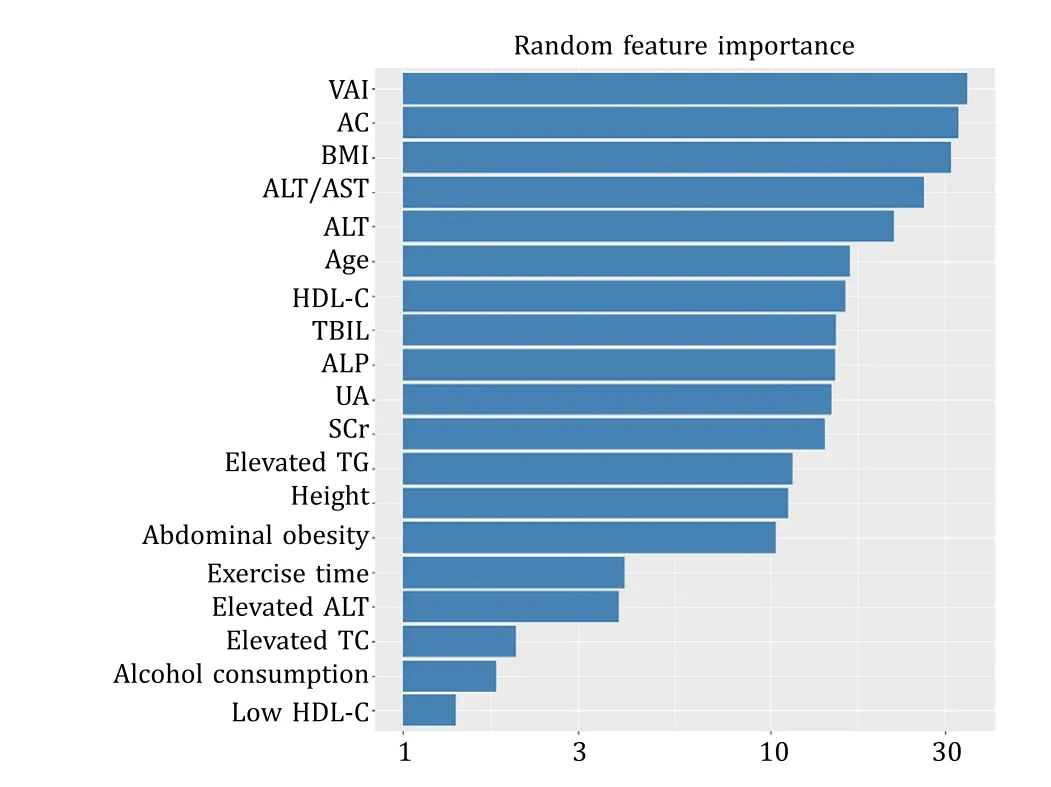
Fig.3.Plot of feature importance derived from random forest model.VAI: visceral adiposity index;AC: abdominal circumference;BMI: body mass index;ALT: alanine aminotransferase;AST: aspartate aminotransferase;HDL-C: high-density lipoprotein cholesterol;TBIL: total bilirubin;ALP: alkaline phosphatase;UA: uric acid;SCr:serum creatinine;TG: triglyceride;TC: total cholesterol.
The training set was comprised of 578 participants,of which 329 were with NAFLD and 249 without.The testing set was comprised of 131 participants,of which 96 were with NAFLD and 35 without.According to grouped comparison of demographic,laboratory and derived variables (Table 1),there was no significant difference between the two sets in all analyzed variables other than VAI.
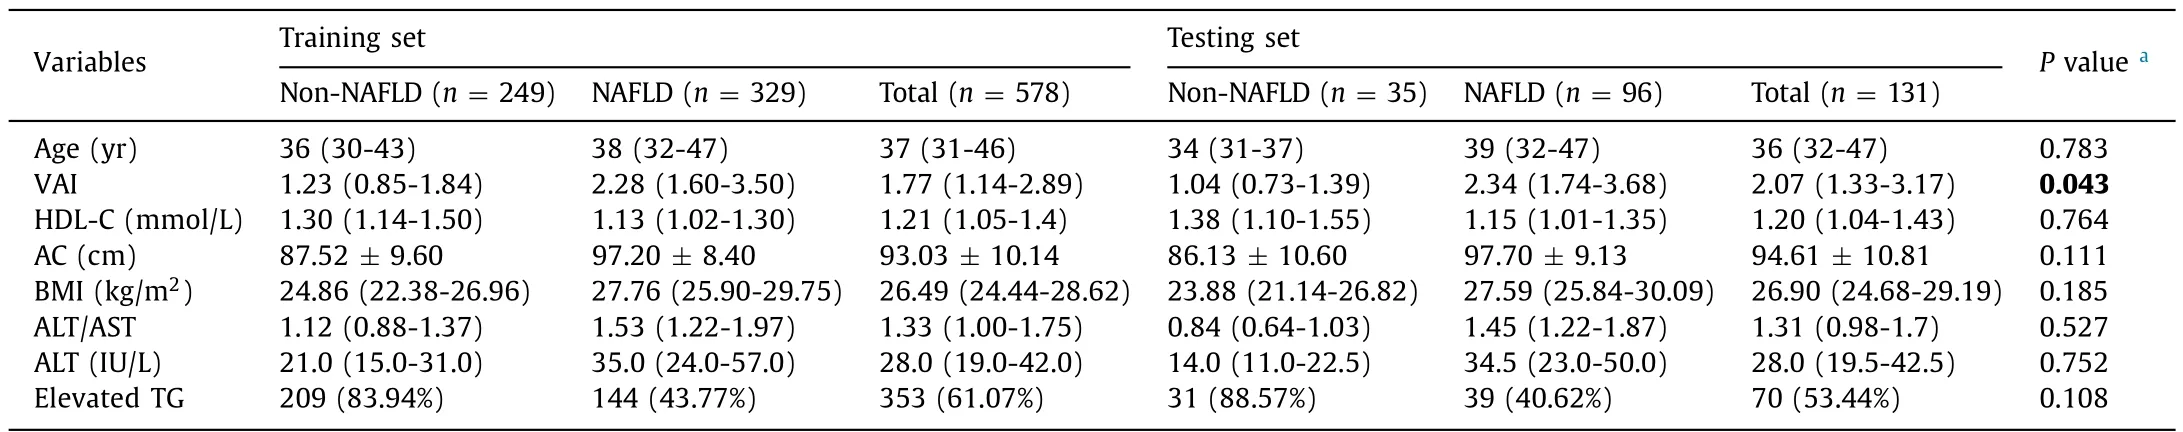
Table 1Grouped comparison of demographic/laboratory/derived variables between the two sets.
Evaluation of prediction models
The AUCs of all the five prediction models were showed in Table 2.When using the first eight variables,the XGBoost model presented the best predictive performance among all machine learning models (AUC: 0.928,95% CI: 0.873–0.944;precision: 0.916;F1: 0.911;recall: 0.906) (Fig.4).And it also presented excellent performance with the 10-fold cross-validation in the training set (average AUC: 0.838).We conducted hyperparameter optimization with grid search method and enhanced the XGBoost model (n_estimators=200,booster=‘gbtree’,learning_rate=0.15,gamma=0.01,alpha=0.005,reg_lambda=0.02,max_depth=1 min_child_weight=3,subsample=0.8,colsample_bytree=0.8) to obtain the best AUC (AUC: 0.938,95% CI:0.870–0.950).The eight predictors were ranked in the following order: VAI,BMI,elevated TG,AC,ALT/AST,ALT,HDL-C,and age,with importance value of 0.263,0.171,0.146,0.138,0.089,0.083,0.056,and 0.053,respectively (Fig.5).In addition,we found the tradeoff between precision and recall when the threshold of XGBoost model was 0.509,with precision of 0.907 and recall of 0.917.In the testing set,the enhanced XGBoost model was evaluated using confusion matrix: among 35 non-NAFLD participants,26 were predicted as non-NAFLD,while 9 were NAFLD;among 96 NAFLD participants,88 were predicted as NAFLD,while 8 were non-NAFLD.

Table 2Metrics of the LR,RF,XGBoost,GBM and SVM models in the testing set.
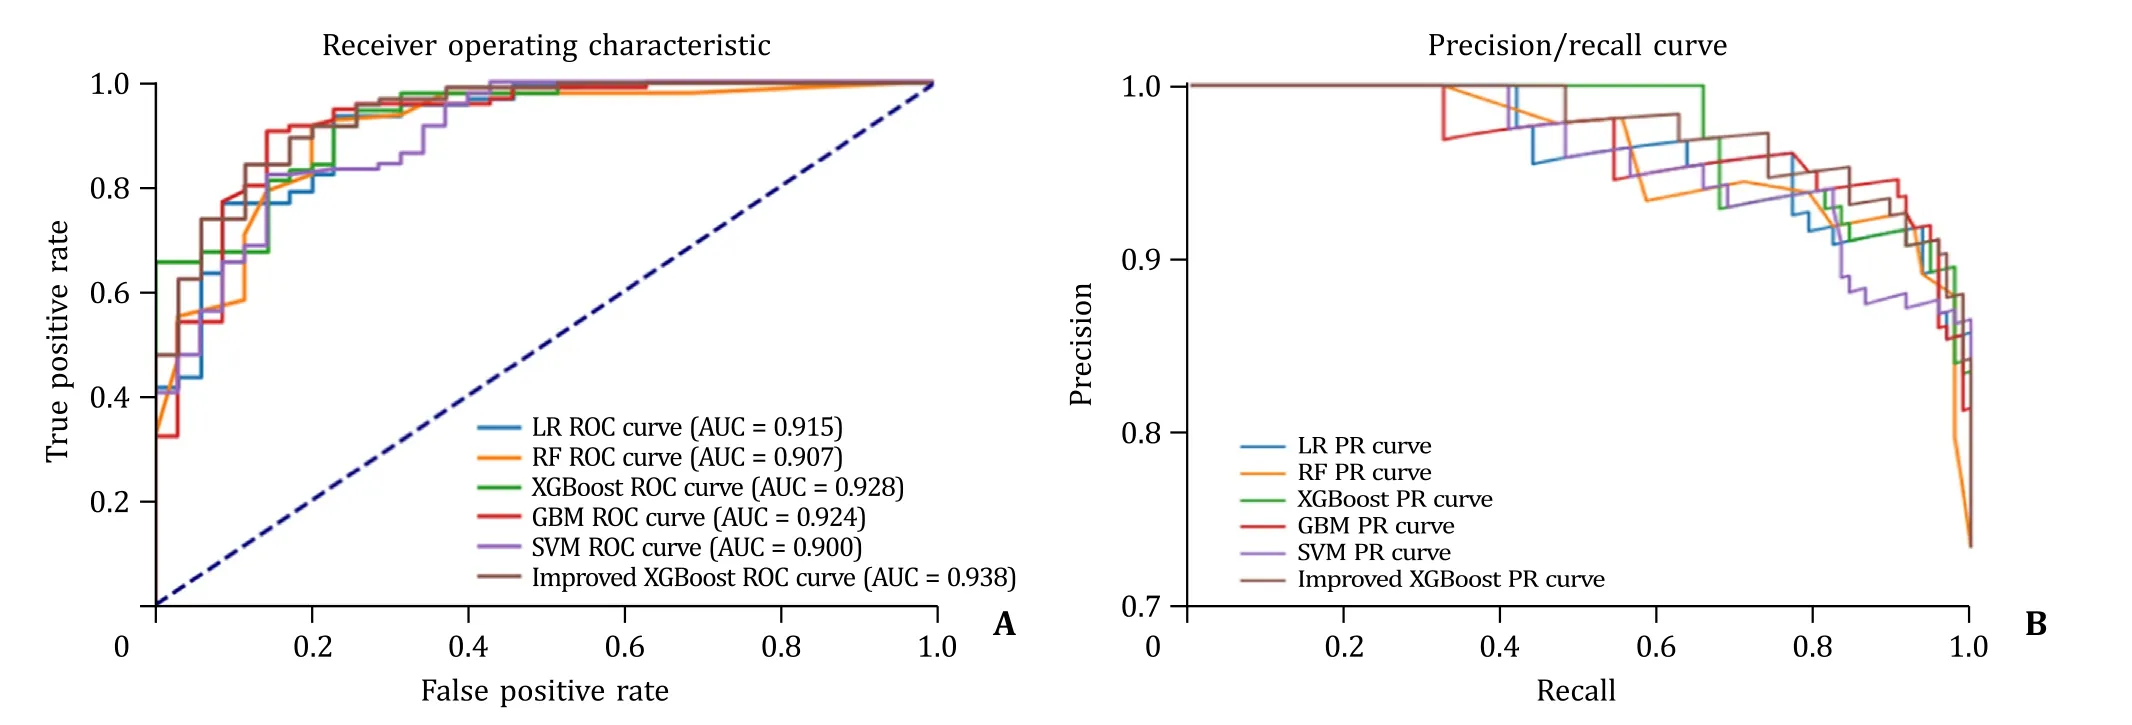
Fig.4.The ROC curve (A) and PR curve (B) of different machine learning models.LR: logistic regression;RF: random forest;XGBoost: extreme gradient boosting;GBM:gradient boosting machine;SVM: support vector machine;ROC: receiver operating characteristic;AUC: area under curve;PR: precision/recall.

Fig.5.Feature importance derived from improved XGBoost model.VAI: visceral adiposity index;BMI: body mass index;TG: triglyceride;AC: abdominal circumference;ALT: alanine aminotransferase;AST: aspartate aminotransferase;HDL-C: highdensity lipoprotein cholesterol;XGBoost: extreme gradient boosting.
Sensitivity analysis
The results of sensitivity analysis showed that the predictive performance for five models was enhanced.In general,most of the results from sensitivity analyses were consistent with those from main analyses,and the improved XGBoost model presented the best predictive performance among all five machine learning models (AUC: 0.958,95% CI: 0.899–0.961;precision: 0.900;F1: 0.871;recall: 0.844) (Tables S1,S2,and Fig.S1).
Discussion
In this study,we developed five machine learning models to evaluate the risk of NAFLD in participants with annual health checkup.In two sets,we conducted evaluation metrics for the confusion matrix and the AUCs of all the five prediction models.We used the testing set to validate and compare the predictive performance of five models.When we assumed model precision of a baseline NAFLD prevalence ≥50% in the population of deployment,all five models presented an AUC >0.9,which meant VAI-based models had excellent predictive performance for NAFLD.Among those five models,XGBoost presented the best performance,with the highest AUC.After further tuning of parameter,XGBoost was enhanced in predictive performance.
Liver biopsy was still the gold standard for diagnosis of NAFLD.However,it was limited in clinical settings due to its invasiveness,postoperative complications and expensiveness [21].As the population with obesity/metabolic syndrome increased,NAFLD had brought more and more burden to the healthcare and economy system [1].Therefore,there was practical significance to explore simpler and more effective screening methods for NAFLD.In order to find an alternative method,we developed five models with machine learning algorithms to identify individuals with high risk of NAFLD.
We found that NAFLD was closely associated with VAI,AC,BMI,ALT/AST,age,and elevated TG.Our study indicated that VAI was an important predictor of NAFLD,which was consistent with the data of Okamura et al.[22].As an important marker of fat distribution and visceral fat accumulation,VAI was closely linked to multiple diseases such as hypertension [23],diabetes mellitus [24]and cardiovascular disease [25].Moreover,Petta et al.[26]suggested that VAI was independently related to insulin resistance and fibrosis degree.AC and BMI were important indicators for assessing obesity,which was considered chronic low-grade inflammation [27]and closely linked to NAFLD.Weight loss was considered a primary treatment for NAFLD.Our study found that the ratio of ALT and AST,both important enzyme markers for assessing liver function,was one of the risk factors for NAFLD,which was consistent with the previous study by Lee et al.[28].They suggested that ALT/AST was an independent risk factor for NAFLD after adjusting for the interactions between variables.Aging was one of the recognized risk factors for NAFLD.According to a retrospective cohort study with 4398 participants [29],aging-related muscle loss and fat accumulation were both important contributing factors for NAFLD.Moreover,hypertension,diabetes mellitus and hyperlipidemia were more common among the elderly,which might provide an explanation why aging was a risk factor for NAFLD [30].Given that the pathogenesis of NAFLD was not completely clear,the widely accepted theory still was the “two-hit” hypothesis,the increase of fat in the liver and the subsequent increases of inflammatory cytokines,adipokines,and mitochondrial dysfunction.It was suggested that metabolic disorder in hepatocytes,resulting from deposition of TG in hepatocyte cytoplasm,was an important premise of NAFLD [31].According to an 8-year prospective cohort study in China [32],the level of TG was closely linked to NAFLD.And the reversal of NAFLD was often associated with drop of TG level.
Besides LR model,we built four other machine learning models to predict the risk factor of NAFLD in general population,including RF,XGBoost,GBM and SVM.The idea of boosting algorithm was to composite a strong classifier integrating a variety of weak classifiers.As an optimized and improved algorithm,XGBoost was a novel and highly efficient boosting algorithm and could enhance the accuracy of model.When dealing with large volume of medical data,XGBoost presented significant advantages such as autonomous learning and automatic optimization of split nodes,and was good at handling irregular data with excessive abnormal values or missing values [33].The XGBoost algorithm was also widely applied in disease diagnosis/prognosis [34–36]and drug research/development [37].GBM,a supervised learning algorithm,was an integrated boosting model adding the outputs of a variety of weak learners (classification and regression tree) using gradient lifting algorithm.Among those machine learning algorithms analyzing tabular data,GBM often presented the highest predictive performance [38].Patel et al.[39]suggested that GBM presented better AUC in predicting hospitalized demands of children with asthma compared to decision tree,LR or RF.RF was an ensemble learning algorithm integrating a variety of decision trees,as well as a most used machine learning algorithm in clinical research.Compared with traditional linear algorithms,RF had advantages such as anti-noise ability,overfitting prevention,free from collinear influence and applicable for nonlinear data [40].RF was widely used for disease prediction model [41]and prognostic analysis [42].SVM evolved from optimal separating hyperplane,which was linearly separable.SVM could minimize empirical error and maximize geometric edges,which was also called maximum margin classifier [43].With advantages of strong plasticity,high accuracy and independence from designer’s experience or knowledge,SVM could be used for data classification and regression analysis.In this study,we used precision,F1,recall,and AUC to comprehensively evaluate the performance of models.We demonstrated that all five machine learning models presented an AUC >0.9 and had good or excellent predictive performance.Among those models,XGBoost algorithm presented significantly better AUC values than other models.Therefore,we suggested that XGBoost model had the best predictive performance and might provide reference for precise treatment and individual-based therapy in clinical practice.
Our study had two main advantages.First,we developed and compared five machine learning models basing on VAI level,and finalized an optimal model.In addition,predictive variables included in our model were easily acquirable,with excellent predictive performance.Second,MRI-PDFF,a gold standard for non-invasive testing,was the most accurate tool of quantitative measurement for liver fat content [16].In this study,we collected the diagnostic data of NAFLD from 131 participants completing MRI-PDFF for external validation and enhanced the evaluation of model accuracy.However,there were some limitations in this study.Our findings came from limited samples of Chinese population,with model precision assuming a baseline prevalence of NAFLD of ≥50% in the population of deployment.Therefore,the precision would possibly decrease if the models were used in a setting with fewer NAFLD patients.Further research would be suggested to verify the applicability in different populations.Moreover,our study was unable to categorize participants with simple fatty liver from those with steatohepatitis,or categorize participants with early-stage NAFLD from those with late-stage NAFLD,despite of significant differences in prognosis of these categories.
In conclusion,age,AC,BMI,VAI,ALT,ALT/AST,HDL-C and elevated TG are important indicators for predicting NAFLD.We developed a variety of VAI-based machine learning models to predict high risk population with NAFLD and found that XGBoost model presented the best predictive performance.Our findings could provide a reliable reference for early identification of high risk patients with NAFLD in clinical settings.
Acknowledgments
None.
CRediTauthorshipcontributionstatement
Hong-YePeng:Data curation,Formal analysis,Writing– original draft.Shao-JieDuan:Data curation,Formal analysis,Writing– original draft.LiangPan:Data curation,Formal analysis,Writing– original draft.Mi-YuanWang:Data curation,Formal analysis.Jia-LiangChen:Data curation,Formal analysis.Yi-ChongWang:Data curation.Shu-KunYao:Conceptualization,Resources,Supervision,Writing– review &editing.
Funding
None.
Ethicalapproval
This study was conducted in accordance with theDeclarationof Helsinkiand was approved by Clinical Research Ethics Committee of China-Japan Friendship Hospital (2018-110-K79-1).
Competinginterest
No benefits in any form have been received or will be received from a commercial party related directly or indirectly to the subject of this article.
Supplementarymaterials
Supplementary material associated with this article can be found,in the online version,at doi: 10.1016/j.hbpd.2023.03.009.
杂志排行

Hepatobiliary & Pancreatic Diseases International的其它文章
- A new prognostic model for drug-induced liver injury especially suitable for Chinese population
- Post-hepatectomy liver failure: A timeline centered review
- INSTRUCTIONS FOR AUTHORS
- Value and prognostic factors of repeat hepatectomy for recurrent colorectal liver metastasis
- Older liver grafts from donation after circulatory death are associated with impaired survival and higher incidence of biliarynon-anastomotic structure
- Development and validation of a novel model to predict liver-related mortality in patients with idiosyncratic drug-induced liver injury