Coordinated planning for flexible interconnection and energy storage system in low-voltage distribution networks to improve the accommodation capacity of photovoltaic
2023-12-28JiaguoLiLuZhangBoZhangWeiTang
Jiaguo Li,Lu Zhang,Bo Zhang,Wei Tang
1.College of Information and Electrical Engineering,China Agricultural University,Beijing 100083,P.R.China
Abstract: The increasing proportion of distributed photovoltaics (DPVs)and electric vehicle charging stations in low-voltage distribution networks (LVDNs)has resulted in challenges such as distribution transformer overloads and voltage violations.To address these problems,we propose a coordinated planning method for flexible interconnections and energy storage systems (ESSs)to improve the accommodation capacity of DPVs.First,the power-transfer characteristics of flexible interconnection and ESSs are analyzed.The equipment costs of the voltage source converters (VSCs)and ESSs are also analyzed comprehensively,considering the differences in installation and maintenance costs for different installation locations.Second,a bilevel programming model is established to minimize the annual comprehensive cost and yearly total PV curtailment capacity.Within this framework,the upper-level model optimizes the installation locations and capacities of the VSCs and ESSs,whereas the lower-level model optimizes the operating power of the VSCs and ESSs.The proposed model is solved using a non-dominated sorting genetic algorithm with an elite strategy (NSGA-II).The effectiveness of the proposed planning method is validated through an actual LVDN scenario,which demonstrates its advantages in enhancing PV accommodation capacity.In addition,the economic benefits of various planning schemes with different flexible interconnection topologies and different PV grid-connected forms are quantitatively analyzed,demonstrating the adaptability of the proposed coordinated planning method.
Keywords: Low-voltage distribution network;Photovoltaic accommodation;Flexible interconnection;Energy storage system;Bilevel programming
0 Introduction
With the proposal of carbon peaking and carbon neutrality goals,the proportion of renewable energy represented by distributed photovoltaics (DPVs)in distribution networks will increase significantly.Additionally,the proportion of the DC load represented by electric vehicle charging stations is constantly increasing,resulting in complex and variable power supply and load characteristics of low-voltage distribution networks (LVDNs).In this context,the conventional radial operation mode of an AC distribution network is no longer applicable because of the lack of flexibility.On one hand,overvoltage problems may occur because of the high proportion of DPV integration,and network losses may also increase because of the reverse power from the LVDN to the medium-voltage distribution network (MVDN)[1-3].On the other hand,the peak load period of electric vehicle charging stations may be the same as that of conventional loads,exacerbating the overload of the distribution transformer [4,5].Therefore,enhancing the accommodation capacity of LVDNs and mitigating power quality problems caused by the integration of PVs and electric vehicle charging stations are important.
The conventional approach to these challenges involves enhancing the distribution network.Nevertheless,the significant upgrades and reconstruction of both primary and secondary equipment can entail longer construction timelines and considerable investments.Furthermore,the utilization efficiency of the upgraded equipment remains relatively modest owing to the short occurrence time of reverse power and the overload problem of distribution transformers.The reactive power regulation capability of PV inverters can be used to alleviate the overvoltage problems in distribution networks with a high proportion of PVs [6].A distributed reactive power compensation method connecting single-phase DPV inverters to different phases was proposed in [7].However,this method cannot manage the actual power imbalance between the supply and demand sides even when the overvoltage problem can be alleviated.In addition,conventional AC distribution networks achieve power transfer by changing the state of the interconnection switches;however,their performance within a short period is limited [8].In response,scholars have proposed the concept of flexible interconnection as a replacement for conventional switches,thereby effectively accommodating PVs through flexible power transfer [9-11].
Notably,a voltage source converter (VSC)-based flexible interconnection is a more cost-effective option than power electronic transformers,making it particularly suitable for LVDNs.The operational characteristics of flexible interconnection devices were analyzed in [12,13],which achieved accurate and reliable real-time power control.Reference [14] analyzed the maximum powersupply capacity of a distribution network by considering the flexible interconnection of low-voltage distribution areas.Reference [15] optimized the capacity and position of VSCs to mitigate the voltage violation and overload problem of distribution transformers by considering the power complementarity between the DC and AC lines.The UK Grid Corporation initiated the FUN-LV project in 2014,demonstrating commendable economic,social,and environmental gains [16].Nonetheless,the application of flexible DC technology for achieving load balancing,fault load restoration,and supply-demand interaction is in its nascent stages,and application experience is lacking.Flexible interconnections in different regions cannot be adopted in fixed standard mode [17].Moreover,owing to the inconsistency between the peak period of PV power generation and that of load electricity consumption,the power emitted by a PV system may far exceed the total load electricity demand of the two areas simultaneously.The use of only flexible interconnections between distribution areas with a high proportion of PVs may not achieve complete PV accommodation.
Furthermore,some scholars have demonstrated that the accommodation capacity of PV can be improved by configuring energy storage systems (ESSs)[18-20].Reference [21] indicated that increasing the accommodation capacity of renewable energy by allocating ESSs is a trend in intelligent distribution networks.Reference [22] proposed an optimization scheduling model based on mobile ESS that effectively mitigates the overvoltage problem caused by the large-scale integration of distributed generation and household electric vehicles in distribution networks.Reference [23] utilized distributed ESS devices to mitigate the adverse effects of PV integration,distributed ESS planning,and operation techniques,and accurately calculated the power value of PV that violates system constraints.Reference [24] proposed a large-scale multi-ESS combination application scheme based primarily on NaS batteries for renewable energy consumption.However,various ESS battery technologies have their limitations,and their investment costs remain relatively high [25].With an increasing proportion of DPVs,relying solely on configuring the ESS may not guarantee economy.
The coordinated planning of flexible interconnections and ESS for LVDNs can fully utilize the spatiotemporal power-transfer capacity,which is significant for improving PV accommodation.Numerous research achievements have been made in scheduling.A collaborative scheduling strategy based on a VSC and ESS that utilizes spatiotemporal power transfer was proposed to demonstrate its superiority in PV accommodation [26].Reference [27] proposed a twolevel scheduling algorithm to address voltage regulation by coordinating customer-owned ESS and utility-owned load tap changers in power distribution systems.Few research achievements have been attained in terms of planning.Reference [28] established a collaborative planning model for the location and capacity of ESS and DC lines to achieve high-quality and cost-effective accommodation of PVs within and between regions.Reference [29] proposed a planning approach for the network configuration of AC-DC hybrid distribution systems.However,power losses were not considered,or quantitative analysis of various flexible interconnection topologies and different PV grid-connected forms was lacking [28,29].
The existing planning methods for LVDNs have several limitations.First,they fail to exploit the advantages of flexible interconnection devices and ESSs fully.While an ESS may achieve full PV accommodation,relying solely on configuring the ESS can result in higher investment costs.Conversely,flexible interconnection may not achieve full PV accommodation;however,it has a lower investment cost [14].Previous studies focused on either configuring ESSs or flexible interconnection devices to enhance PV accommodation.Furthermore,current duallayer optimization models do not consider differences in investment costs among various interconnection points or disparities in maintenance costs for newly added equipment in different locations.Additionally,the economy of planning schemes with different flexible interconnection topologies and different PV grid-connected forms has not been analyzed quantitatively.With the increasing proportion of DPVs,coordinated planning for flexible interconnection and ESS is necessary to achieve an equilibrium between the economy and PV accommodation.
The main contributions of this work are as follows:
1)A bilevel coordinated planning model of flexible interconnection devices and ESSs for LVDNs,considering the power-transfer characteristics in both spatial and temporal dimensions,is established.The model considers the differences in investment costs for different interconnected locations and refines the formulation of equipment maintenance costs.
2)The economies of various planning schemes with different flexible interconnection topologies and different PV grid-connected forms are quantitatively analyzed,demonstrating the adaptability of the proposed coordinated planning method.
The remainder of this paper is organized as follows.Section 1 analyzes the power-transfer characteristics of flexible interconnection devices and ESSs.Section 2 analyzes economic costs.Section 3 establishes a bilevel programming model with two objective functions.Section 4 presents simulation results.Finally,Section 5 presents the conclusions of this study.
1 Analysis of power-transfer characteristics of flexible interconnection and ESS
Owing to the temporal and spatial differences in the power distribution between the DPVs and loads in LVDNs,the integration of DPVs may result in overvoltage and reverse power.To mitigate these problems and improve the accommodation capacity of PVs,we must analyze the power-transfer characteristics of flexible interconnection devices and ESSs.
1.1 Power-transfer characteristics based on flexible interconnections
Flexible interconnection devices enable power transmission between two regions.Flexible interconnections can be broadly divided into three topologies:interconnections among front nodes,terminal nodes,and intermediate nodes.Flexible interconnections facilitate electricity transmission between distribution areas,thus alleviating distribution transformer overloads.In addition,a parallel connection exists within the distribution area,and the DC and AC lines are installed on the same electric power tower,such as VSC3 and VSC4 in Fig.1.Based on the background of actual engineering construction,this topology may be adopted when flexible interconnection devices and allocation of the ESS fail to mitigate voltage violations.
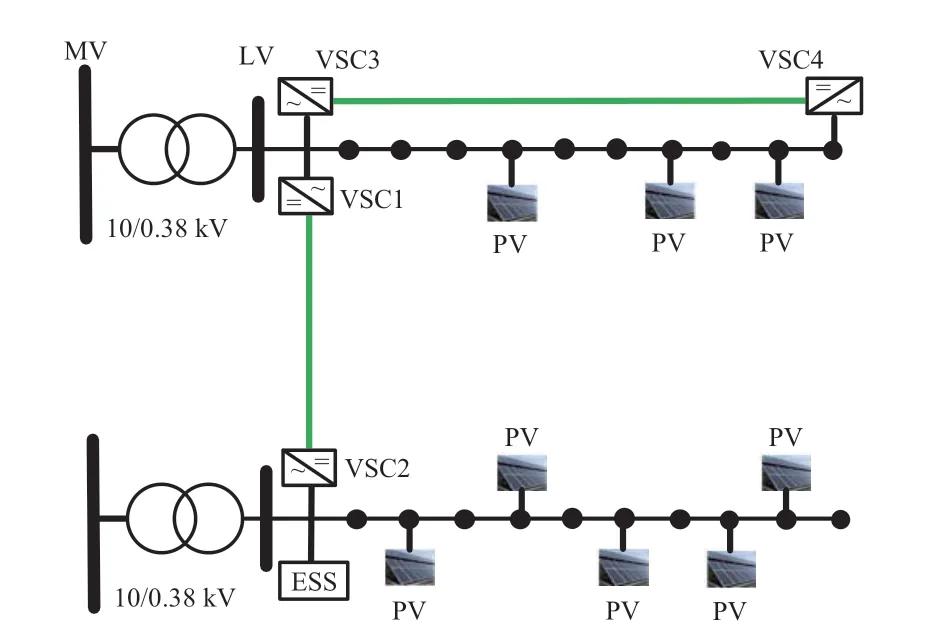
Fig.1 LVDNs with flexible interconnection devices and ESSs
The control modes of VSC may be classified intoVdc-θcont rol,Vdc-Qcontrol,Vd c-Vaccontrol,P-Qcontrol,etc.[30].For the hybrid AC–DC distribution network shown in Fig.1,the main function of VSC1 and VSC3 is to stabilize the DC voltage;therefore,Vdc-Qcontrol mode is adopted.VSC4 and VSC2 are used to transfer active and reactive powers between the two sides of VSCs,thus achieving flexible control of the power flow.Therefore,theP Qcontrol mode is adopted.
The power balance constraint must be satisfied on both sides when the VSC operates.The total active power injected into the VSC on the AC side should equal the active power output on the DC side.Additionally,the active and reactive power outputs of the VSC must satisfy its capacity constraints,as expressed by the following equations:whereare the active and reactive powers of the VSC on the AC side at timet,respectively;is the active power on the DC side at timet;SVSCrepresents the capacity of the VSC.
1.2 Power-transfer characteristics based on an ESS
An ESS may achieve power transfer over a temporal scale and facilitate economically stable operations through peak-shaving and valley-filling strategies.In this paper,coordinated scheduling of the ESS and VSC is employed to achieve spatial and temporal power transmission.
First,the charging and discharging powers of the ESS cannot exceed the power limit when the ESS operates.Second,the state of charge (SOC)of the ESS changes with charging and discharging cycles.The SOC should be maintained between 20% and 80% of its maximum capacity to ensure the longevity of the ESS [31].Finally,the SOC at the end of each scheduling day must be equal to the SOC at the beginning of the scheduling day to maintain cyclic scheduling.
wherePESSch(t)andPESSdis(t)are the charging and discharging powers of the ESS at timet,respectively;PESSch,maxandPESSdis,maxare the maximum charging and discharging powers of the ESS,respectively;SOCESS(t),SOCESS(t-1)are the SOCs of the ESS at timetandt-1,respectively;SOCESS(∆t)is the change in the SOC over time;λ1andλ2are binary variables that represent the charging and discharging states of the ESS,respectively;ηESSchandηESSdisare the charging and discharging efficiencies of the ESS;SOCESSminandSOCESSmaxare the minimum and maximum SOC values of the ESS,respectively;SOCESS j T,,bejinandSOCESS j T,,finishare the SOCs at the beginning and end of daily scheduling for the ESS at nodej,respectively.
2 Economic cost analysis of flexible interconnection devices and ESS
Economic viability is a crucial factor in the planning of LVDNs.Therefore,before the planning process,the costs associated with the equipment must be analyzed.
In terms of investment costs,previous studies primarily focused on the investment costs of VSC,ESS,and new DC lines.However,the construction level of the front nodes is relatively high,typically featuring a distribution box that facilitates the connection of the DC side of the VSC to the DC line,thereby providing interconnection conditions.By contrast,the power towers of the other nodes are equipped with lines without distribution boxes.Distribution boxes must be added to facilitate the connection between the DC side of the VSC and the DC line.Therefore,this paper considers the additional investment costs incurred by adding distribution boxes.
In terms of operation and maintenance costs,previous studies primarily focused on line loss,operational loss of new equipment,and load-shedding costs.However,because of the integration of new devices in the LVDN,grid companies must allocate personnel for regular inspections and maintenance,incurring labor and maintenance material costs.The costs of single maintenance of the ESS and VSC are expressed asrespectively.The voltage level of the newly added DC lines is low and the interconnection distance is short,making their maintenance costs essentially negligible.Additionally,because the new equipment requires annual maintenance assistance from power equipment manufacturers,the grid company must pay additional annual maintenance fees to these manufacturers,denoted asReference [32] approximated the maintenance costs as a certain proportion of the annual equipment investment costs.However,considering factors such as the topography and traffic conditions of an actual LVDN,the timing of equipment maintenance varies at different locations.Therefore,the one-time maintenance costs for the equipment also differ according to location.This is particularly relevant when new equipment is connected to the end of the distribution areas,where it might be less convenient for inspection personnel to perform maintenance.Additionally,external environmental conditions can significantly affect the operation of electrical equipment,resulting in different operating states for electrical equipment at various locations [33].Operational and maintenance costs may vary with different equipment states [34].Moreover,from a safety perspective,if an ESS is not connected to a front node,the frequency of maintenance events may increase,particularly when the ESS is connected to nodes with a significant number of users.Therefore,this paper refines the mathematical model for maintenance costs,as shown in (9).
In summary,this section comprehensively considers the practicalities of project construction and factors influencing maintenance costs.This section proposes the investment cost of newly added distribution boxes and analyzes the impact of the different locations of newly added equipment on maintenance costs.
3 Planning model
Flexible interconnection devices and ESSs enhance the accommodation capacity of PVs.Although flexible interconnection devices have lower investment costs,they lack a fixed standard mode across different regions,resulting in varying PV accommodation capacities.Despite ESS allocation significantly increasing the PV accommodation capacity,its higher investment costs and shorter depreciation period than a VSC must be considered.The rational planning of flexible interconnection devices and ESS must consider both economic feasibility and PV accommodation capacity.Thus,this paper establishes a bilevel programming model based on flexible interconnection devices and an ESS.
3.1 Upper-level planning model
From the perspective of a power grid company,this paper optimizes the installation locations and capacities of VSCs and ESSs in upper-level planning.The objective function aims to minimize the annual comprehensive cost and total PV curtailment power capacity per year.Because new DC lines must be constructed for the interconnection between VSCs,the cost of the DC lines is already included in the annual investment costs.
(1)Objective function
The upper-level planning model establishes objective functions to minimize the annual comprehensive cost and total PV curtailment power capacity per year:
whereNVSCandMESSrepresent the total number of VSCs and ESSs,respectively;CVSCandCESSare the unit capacity investment costs for the VSC and ESS,respectively;CLis the investment cost per unit length of the DC line.CDBis the investment cost of a distribution box.SVSC i,is the installation capacity of the VSC at nodei;SESS j,is the installation capacity of the ESS at nodej;LDCis the total length of the DC lines;NDBis the total number of newly added distribution boxes;αVSC,αESS,αL,andαDBare the annual average cost coefficients of fixed investments for VSC,ESS,DC lines,and distribution boxes,respectively.
whereris the discount rate,andYis the depreciation period of the equipment.
Considering the differences in the maintenance costs of newly added equipment at different locations,the maintenance cost model established in this paper is expressed as follows:
whereClossrepresents the annual cost of line loss,Cdevicerepresents the annual operating costs for the VSC and ESS,Cservicerepresents the annual maintenance costs for the VSC and ESS;Cloadrepresents the annual load-shedding cost.
whereCeis the real-time electricity price;PAC L t l,,,andPDC L t l,,,represent the line losses during timetin the AC and DC systems,respectively;ΩAC line,and ΩDC line,are the collections of branches for AC and DC systems,respectively.
whereaVSC i,andaESS j,are the unit operating costs of the VSC and ESS,respectively;PVSC t i,,andPESS t j,,are the active power outputs of the VSC and ESS,respectively.
whereClis the penalty cost for unit load shedding,Pin t i,,is the active power value of the load located at nodeiduring periodt,and Ωload t,is the set of nodes in which load shedding occurs during periodt.
(2)Constraints
The upper-level planning model primarily considers constraints related to equipment investment costs and aims to satisfy the constraint of maximizing investment costs:
whererepresents the maximum allowable value of the total investment cost of the equipment.
3.2 Lower-level optimization model
The lower-level optimization model aims to minimize the annual operation and maintenance costs and the total PV curtailment power capacity per year.Based on the installation locations and capacities of the VSCs and ESS provided by the upper-level planning model,the power outputs of the ESS and VSCs are optimized.Subsequently,the power values are fed back to the upper-level planning model to accurately calculate the objective function value and continue the optimization process.
(1)Objective function
The objective is to minimize the annual operation and maintenance costs and the total PV curtailment capacity per year to the greatest extent possible.
(2)Constraints
1)Power flow equation constraints
2)Node voltage constraints
For each node in the LVDN,the voltage amplitude cannot exceed the upper voltage limit or fall below the lower limit.The range is 93%–107% of the standard voltage.
whereUi,minandUi,maxare the minimum and maximum values of nodei,respectively.
3)Branch power constraint
The VSC transmits power through interconnected lines,and the sum of its power and the original load power of the line cannot exceed the capacity of the line.
4)Constraints on the reverse power
The objective of the bilevel programming model is to enhance the accommodation capacity of the PV;therefore,we must ensure that the reverse power cannot be transferred from the LVDN to the MVDN [14].The specific constraints are as follows:
whererepresents the outlet power of the distribution transformer at timet.
5)ESS capacity constraints
wherePES j t,,is the active power of the ESS at nodej.
6)VSC capacity constraint
The constraint on VSC capacity is represented by (2).Moreover,the operational loss of the VSC is considered.The VSC loss rate should not exceed the maximum permissible loss rate.
In addition,considering the distribution transformer overloads,the distribution transformer must satisfy the following constraints:
wherePL(t)is the active power on the low-voltage side of the distribution transformer at timet;PH(t)andQH(t)are the active and reactive powers on the high-voltage side of the distribution transformer at timet,respectively;STis the capacity of the distribution transformer.
3.3 Solution method
To enhance computational efficiency,this study established an LVDN model based on the CloudPSSIESLab2 platform to establish candidate position sets for the VSC and ESS.Subsequently,a non-dominated sorting genetic algorithm with an elite strategy (NSGA-II),which may solve the equilibrium between economy and PV accommodation,was used to solve the proposed bilevel programming model.NSGA-II uses an elite retention strategy,which is a multi-objective optimization algorithm based on Pareto optimal solutions.The upper-level model divides chromosomes into several segments,representing candidate positions for multiple VSCs and ESSs,and uses binary encoding based on chromosome length to represent the capacity of the VSCs and ESSs.The lower-level model optimizes the power of the VSCs and ESSs to obtain the optimal operational state of the LVDN,and the results are then fed back to the upper-level model.
In genetic operations,an improved genetic algorithm that combines the termination evolution criteria of the optimal retention strategy,adaptive crossover rate,mutation rate,and optimal individual minimum retention algebra with the maximum genetic algebra is used to obtain a globally optimal solution.
4 Simulation analysis
4.1 Background of the case
Based on the actual LVDN,the initial parameters,such as lines and loads,were set up on the MATLAB platform.Figure 2 shows the original structure of the AC distribution network.The 24-h curves of the PV and load are shown in Fig.3.All nodes (excluding node 0)in area 1 installed DPVs with the same capacity,and the PV penetration rate in area 1 was 147.4%.The load parameters for each node in areas 1 and 2 remained consistent throughout a typical day,and the power factor of all loads was set to 0.99.

Fig.2 Original AC LVDN
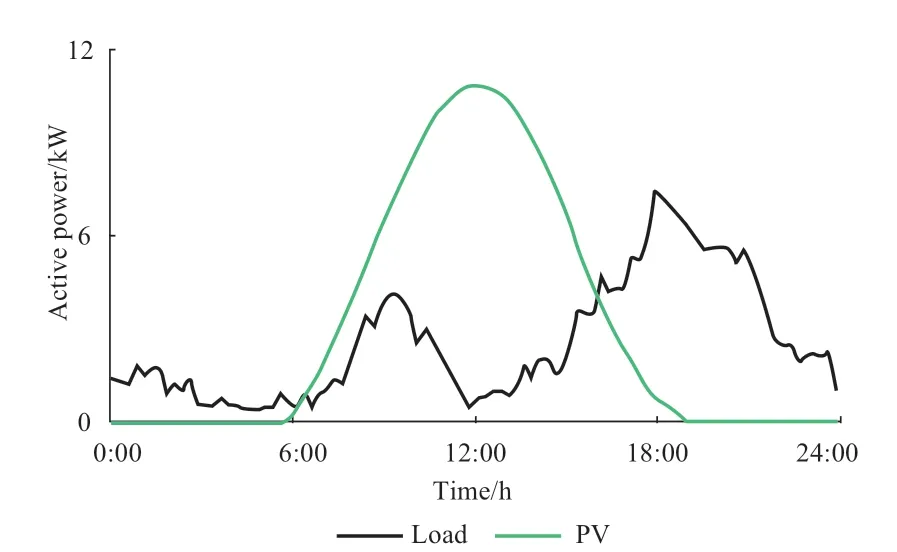
Fig.3 24-hour curves of PV and load
The rated capacities of the dual winding transformer in areas 1 and 2 were set to 0.3 and 0.15 MVA,respectively.The line model for both areas 1 and 2 was LGJ-70,and the line resistance parameters are listed in Table 1.
Table 2 lists some parameter values used to solve the bilevel programming model.Additionally,based on the actual terrain of area 1,nodes 0–6 were assumed to be located along well-connected main roads,whereas the other nodes were on branch roads with poor road conditions.The total number of annual inspectionsand the single maintenance cost (yuan)CES n j,,are shown in the following equations:

Table 1 Line resistance parameters
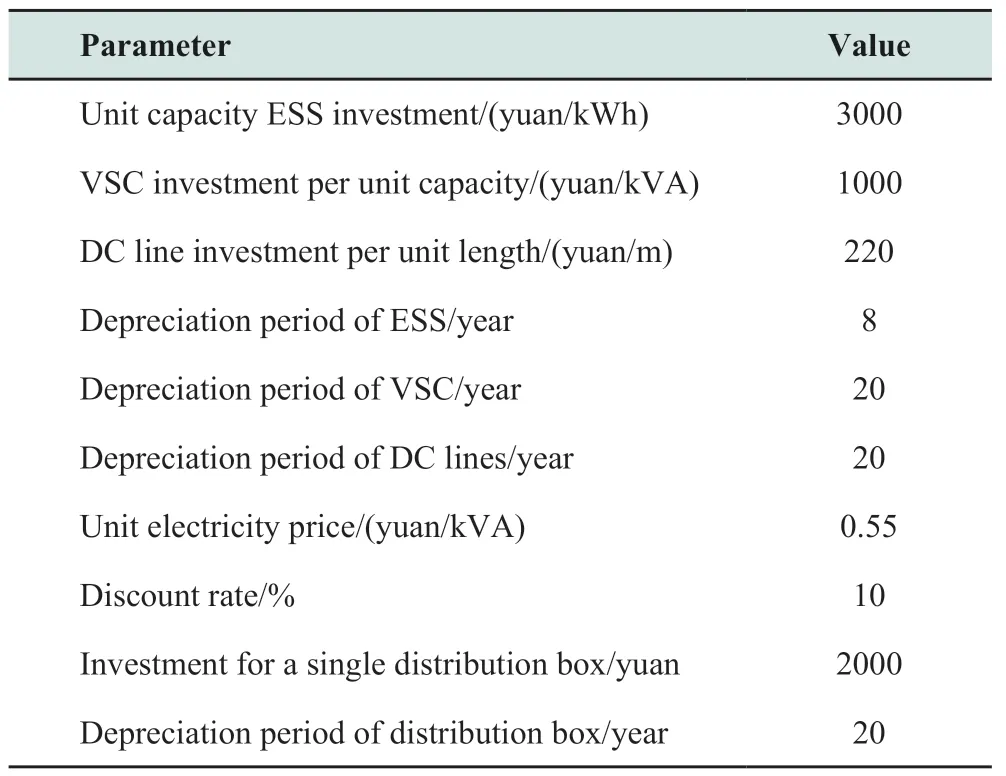
Table 2 Partial parameter values
The phenomenon of reverse power in area 1 was severe at noon,as shown in Fig.4.The power generated by a PV system exceeded the electricity demand because this was the peak period of PV power generation.Area 2 experienced an overload problem with the distribution transformer in the evening.This was because of the smaller capacity of the transformer in area 2,which coincided with the peak period of electricity demand.
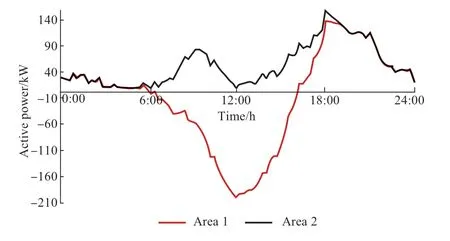
Fig.4 Power of slack bus in areas 1 and 2
The remainder of this section is organized as follows:Section 4.2 provides a verification and comparison of coordinated planning methods,thereby validating their advantages in enhancing PV accommodation capacity.Sections 4.3 and 4.4 analyze the economy of planning schemes with different flexible interconnection topologies and different PV grid-connected forms,demonstrating the adaptability of the proposed coordinated planning method.
4.2 Verification and analysis of coordinated planning methods
NSGA-II was used to solve the problem using the proposed bilevel programming model.The decision variables were the installation locations and capacities of the VSCs and ESS.The site selection results for the VSCs and ESS are shown in Fig.5.
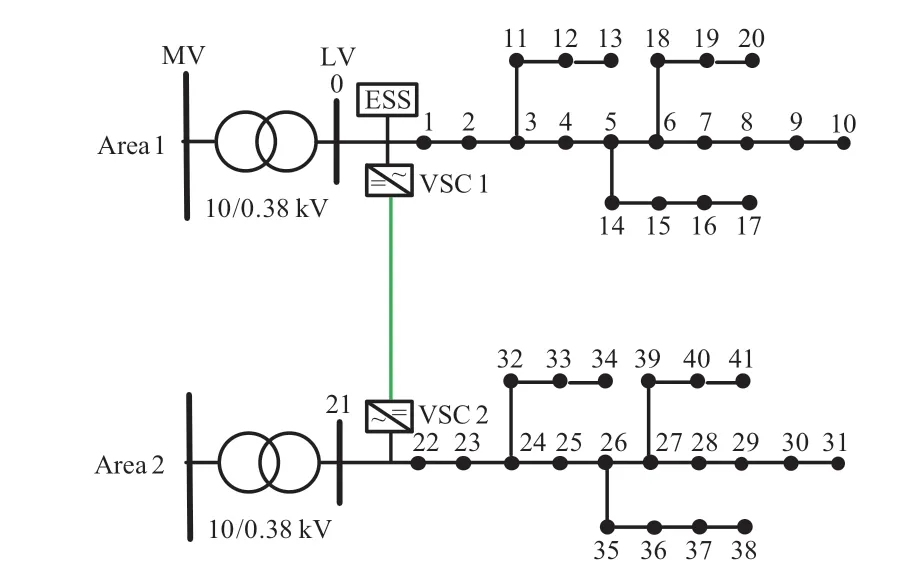
Fig.5 Site selection results of coordinated planning
As shown in Fig.5,the obtained planning scheme configured the ESS and VSC1 at node 0 and VSC2 at node 21.The length of the DC line was 0.4 km.The capacity of each VSC was 78 kVA,and the capacity of the ESS was 1101 kWh.
The planning results were compared with those of similar planning methods to highlight the advantages of the coordinated planning method.The results are shown in Table 3.Scheme 1 adopted only the ESS configuration.Scheme 2 adopted only flexible interconnections.Scheme 3 was the proposed planning method.

Table 3 Planning results of three schemes
The results in Table 3 show that scheme 1 would achieve complete PV accommodation;however,the cost was relatively high,primarily because the investment cost of the ESS was high.The comprehensive cost of scheme 2 was low;however,the accommodation capacity of the PV system was limited.Owing to the high proportion of photovoltaic generation,the generated electricity surpassed the total power demand in both regions.Consequently,relying solely on flexible interconnected devices between areas could not achieve complete PV accommodation.Scheme 3 adopted coordinated planning for flexible interconnection devices and ESS,combining the respective advantages of ESS and flexible interconnection devices.Configuring the ESS would achieve complete PV accommodation and the low cost of the VSC ensured the economy of the planning results.Thus,scheme 3 achieved complete PV accommodation and a balance between the economy and PV accommodation.
The daily power curves of the VSC and ESS obtained from the optimization results are shown in Fig.6.

Fig.6 Power curves of VSC2 and ESS
Fig.6 shows that,first,during the onset of the reverse power in area 1,VSC2 transmitted the power of area 1 as much power as possible to area 2.Second,during the peak period of PV generation,both VSC2 and the ESS were optimized.VSC2 transmitted some of the reverse power to area 2,and the ESS stored the remaining reverse power,significantly improving the accommodation capacity of the PV.Finally,at night,the ESS discharged power,and VSC2 utilized the power complementarity to alleviate the overload problem of the distribution transformer in area 2.
Overall,the effectiveness of the proposed planning method was validated through an actual LVDN scenario,which verified its advantages in enhancing the PV accommodation capacity.The load ratio of a distribution transformer with an overload problem decreased to 0.7 or below through coordinated planning.Under the constraint of not permitting reverse power to be transmitted from the LVDN to the MVDN,the PV accommodation rate increased to 100% through coordinated planning.Therefore,the coordinated planning of flexible interconnection devices and ESS effectively enhanced the accommodation capacity of PV,ensuring the safe operation of distribution transformers.The low cost of the VSC guaranteed economic feasibility of the planning results.
4.3 Coordinated planning results under different interconnection topologies
Different interconnection topologies have different effects on planning results.The various installation positions of the flexible equipment dictate the corresponding interconnection positions,thereby affecting the variations in the system topology and power flow distribution.This section analyses the corresponding planning results under different interconnection topologies and compares their economic costs.The decision variables were the installation location and capacity of the ESS and the capacities of the VSCs.Six typical interconnection topologies are shown in Fig.7.When the PV penetration rate in area 1 exceeded 147.4%,a voltage violation occurred.To analyze the voltage violation and overload problems of distribution transformers in adjacent distribution areas,we increased the PV penetration rate to 176.2%.
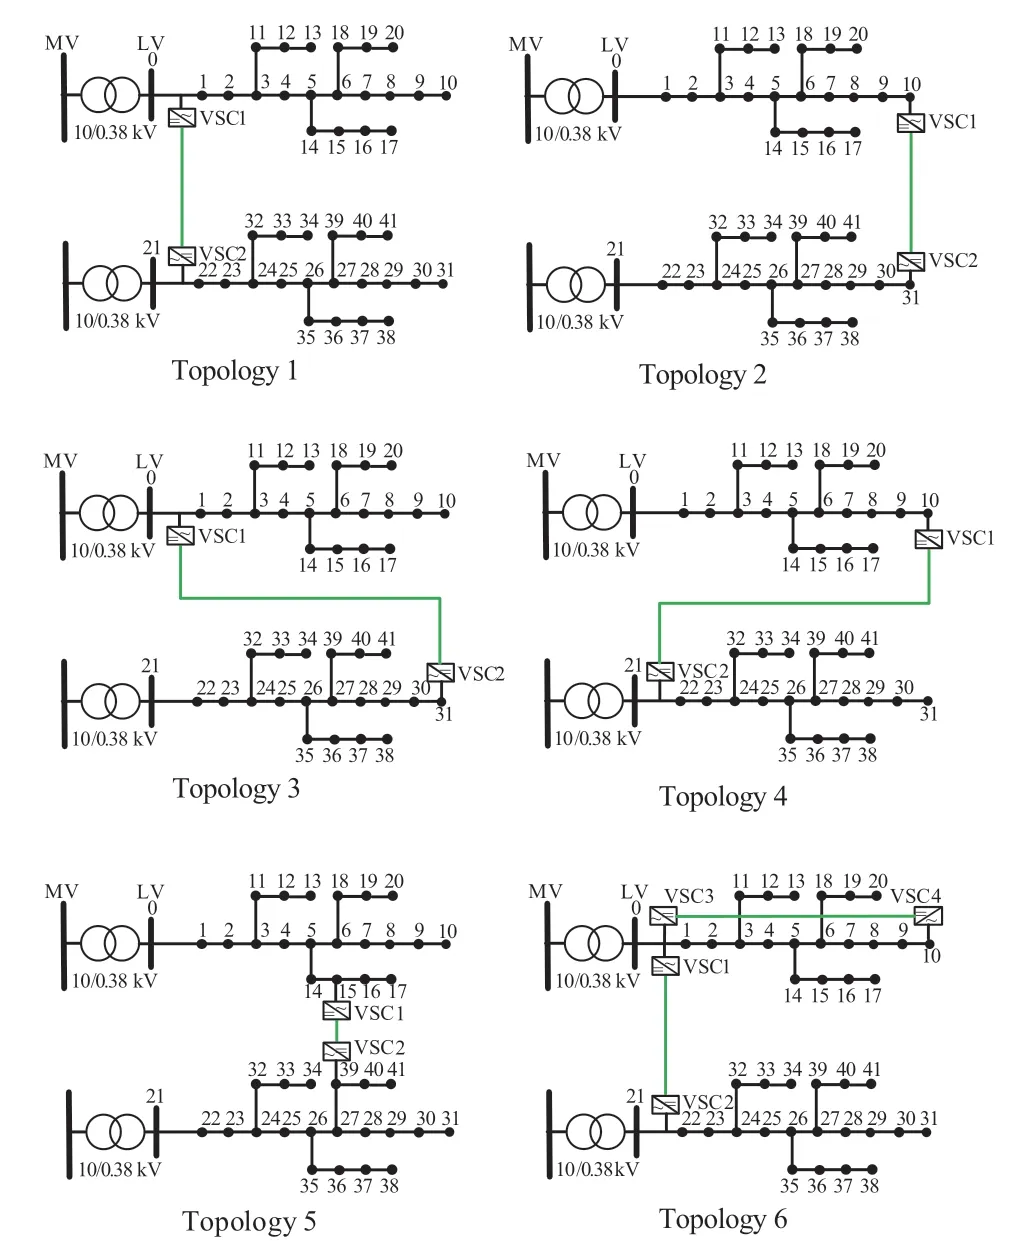
Fig.7 Six typical interconnection topologies
The results of the network loss and selection of ESS locations are presented in Table 4.In the VSC capacity results for interconnection topology 6,the value 84 indicates the respective capacities of VSC1 and VSC2,and 23 represents the capacities of VSC3 and VSC4.
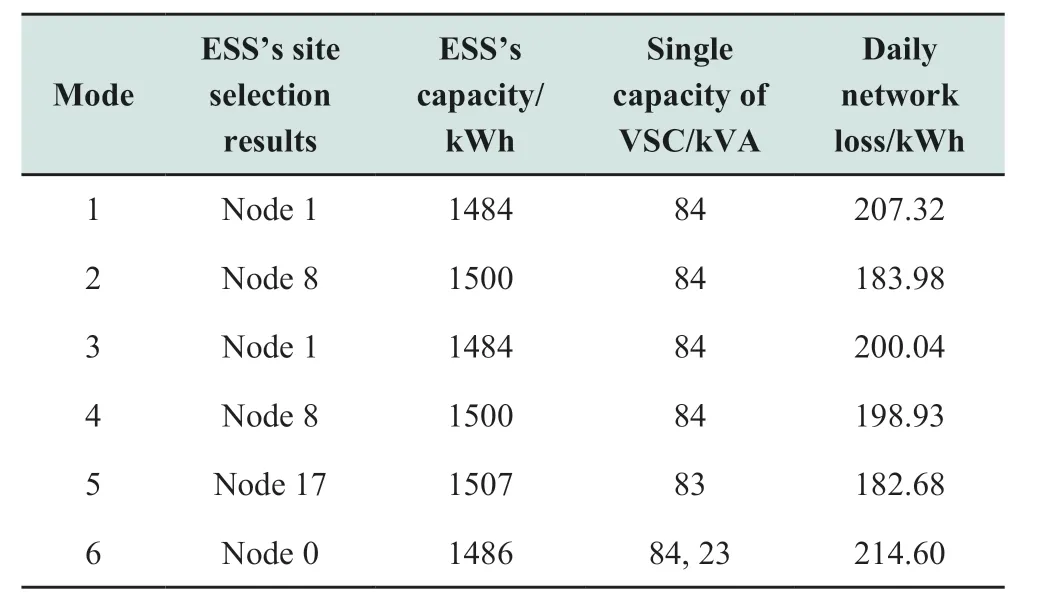
Table 4 Results of allocation scheme and network loss
After planning,the total PV curtailment capacity for all interconnection topologies was zero.The various costs are listed in Table 5.
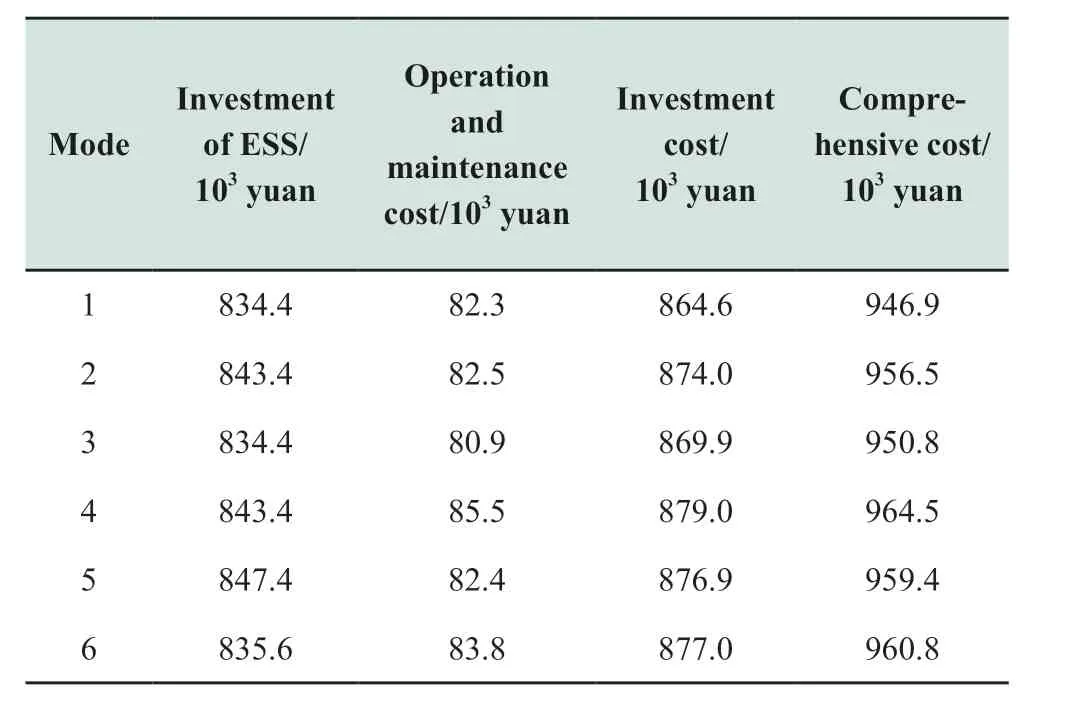
Table 5 Annual cost of various interconnection topologies
Table 5 shows that interconnection topology 1 had the lowest annual comprehensive cost among the six interconnection topologies.The investment cost of the ESS constituted a large proportion,and the investment cost of ESS for interconnection topology 1 was the lowest.The lower maintenance cost of this topology was attributed to the proximity of the ESS to the distribution transformer.Although the network loss of interconnection topology 1 was high,the annual operational and maintenance costs were relatively low.Interconnection topology 5 exhibited the lowest network loss.Owing to the constraint that prevents reverse power flow from the LVDN to the MVDN,the increased ESS capacity in interconnection topology 5 resulted in higher annual comprehensive costs than topology 1.In addition,interconnection topology 6 adopted a parallelconnection scheme within the distribution area.This topology required a new set of VSC equipment,resulting in increased investment costs for VSCs and the DC line.Additionally,its network losses were the highest,resulting in higher operation,maintenance,and investment costs than interconnection topology 1.In conclusion,considering all these aspects,the economy of interconnection between the front nodes was optimal.
The voltage curves of all nodes in area 1 before planning are shown in Fig.8.After optimization,the voltage curves under various interconnection topologies are shown in Fig.9,indicating the voltages of all the nodes in a day.
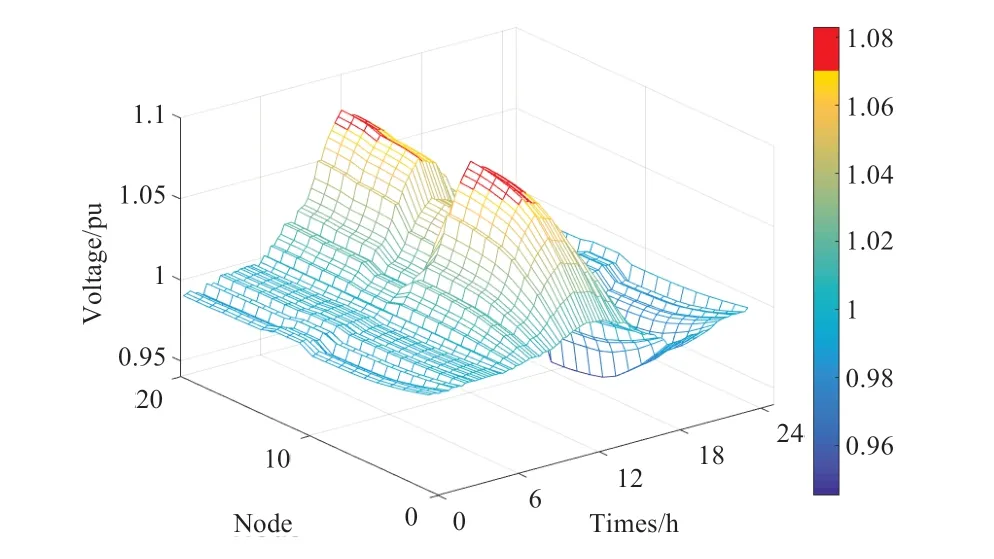
Fig.8 Voltage curves of all nodes in area 1 before planning
Overall,the load rate of the distribution transformer with an overload problem was reduced to 0.7 or lower through coordinated planning,and the voltage violation problem was alleviated.Under the premise of not allowing a reverse power flow from the LVDN to the MVDN,coordinated planning increased the PV accommodation capacity to 100%.In addition,the differences in installation and maintenance costs for different installation locations were fully considered.The maintenance cost was low because the ESS site selection in interconnection topology 1 was similar to that of the distribution transformer.Although the network loss was high,the annual operation and maintenance costs were relatively low.Finally,we concluded that under a high penetration rate and decentralized integration of PV,the economy of adopting interconnection between front nodes was optimal.
4.4 Coordinated planning results under different PV grid-connected forms
Grid-connected PV forms can be divided into decentralized and centralized integration,and the results of coordinated planning vary under different grid-connected PV forms.This section analyzes the results of coordinated planning under different grid-connected PV forms and compares their economic costs and flexible interconnection topologies.The decision variables were the installation locations and capacities of the VSCs and ESS.
The planning results under decentralized integration are presented in Section 4.2,with a daily network loss of 175.56 kWh.The remaining experiments are not discussed.
Under centralized integration,the PV penetration rate in area 1 was the same as mentioned in Section 4.2.Given the practical engineering context,the available space at the front and terminal nodes was larger than that at other nodes,making them more suitable for centralized integration.Therefore,this section analyzes two options for centralized integration:front node zero and terminal node ten.After planning,the total PV curtailment capacity was reduced to 0.The results for the locations of the VSCs and ESS are shown in Fig.10,and the allocation outcomes are listed in Table 6.
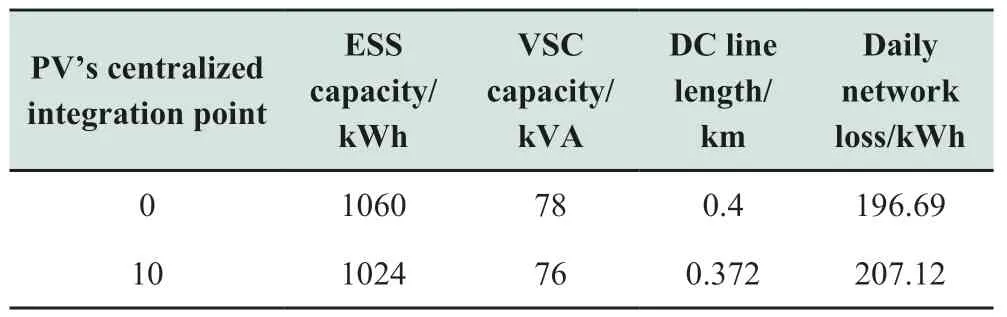
Table 6 Results of allocation scheme and network loss
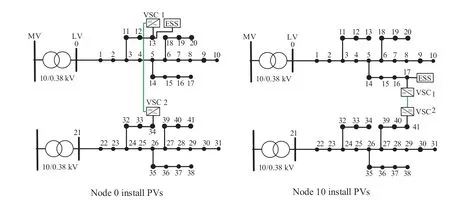
Fig.10 Site selection results of coordinated planning

Table 7 Various annual costs
The cost outcomes of the centralized integration are listed in Table 7.When comparing the results with those of decentralized integration,we observed that the annual comprehensive cost was lower in the centralized integration.Compared with centralized PV integration at the front node,network loss under centralized PV integration at the terminal node was higher,resulting in higher annual operation and maintenance costs.However,its annual ESS investment was relatively low;therefore,the economy of centralized PV integration into terminal nodes was better.
Meanwhile,the results of the flexible interconnection topologies for the two grid-connected PV forms were different.The interconnections between the front nodes are suitable for decentralized integration,which was consistent with the results presented in Section 4.3.This was primarily because,under this interconnection topology,the annual ESS investment cost was the lowest.Similarly,the interconnections between intermediate nodes were suitable for centralized integration.
5 Conclusion
To enhance the accommodation capacity of PV and mitigate the overload problem of distribution transformers and voltage violations in LVDN,this paper establishes a bilevel programming model with two objective functions.The model considers the variations in investment costs for different interconnected locations and differences in maintenance costs for newly added equipment at different locations.The rationality of the proposed coordinated planning method was validated through a comparative analysis of the three planning methods.
This paper analyzes the economic costs of planning schemes under various flexible interconnection topologies in the context of high PV penetration and decentralized integration.The site selection result of the ESS with the interconnection between the front nodes is close to that of the distribution transformer,resulting in lower maintenance costs.Despite the high network loss,the annual operation and maintenance costs are relatively low.After a comprehensive comparison,the economy of the interconnection between the front nodes was observed to be optimal.Finally,a comparative analysis was conducted on the planning results across different grid-connected PV forms,revealing that the optimal flexible interconnection topologies for the two different grid-connected PV forms differed.The coordinated planning method proposed in this paper has broad applicability and may improve PV accommodation and mitigate power supply quality problems.
Acknowledgements
This work was supported by the Science and Technology Support Program of Guizhou Province ([2022] General 012)and the Key Science and Technology Project of China Southern Power Grid Corporation (GZKJXM20220043).
Declaration of Competing Interest
We declare that we have no conflict of interest.
杂志排行

Global Energy Interconnection的其它文章
- Over-limit risk assessment method of integrated energy system considering source-load correlation
- Optimal dispatch approach for rural multi-energy supply systems considering virtual energy storage
- Federated double DQN based multi-energy microgrid energy management strategy considering carbon emissions
- Layered power scheduling optimization of PV hydrogen production system considering performance attenuation of PEMEL
- Application of four machine-learning methods to predict short-horizon wind energy
- A robust optimization model for demand response management with source-grid-load collaboration to consume wind-power