Over-limit risk assessment method of integrated energy system considering source-load correlation
2023-12-28YingWangXiaojunWangYizhiZhangYigangZhangZekaiXu
Ying Wang ,Xiaojun Wang ,Yizhi Zhang ,Yigang Zhang ,Zekai Xu
1.School of Electrical Engineering,Beijing Jiaotong University,Beijing 100044,P.R.China
Abstract: In an integrated energy system,source-load multiple uncertainties and correlations lead to an over-limit risk in operating state,including voltage,temperature,and pressure over-limit.Therefore,efficient probabilistic energy flow calculation methods and risk assessment theories applicable to integrated energy systems are crucial.This study proposed a probabilistic energy flow calculation method based on polynomial chaos expansion for an electric-heat-gas integrated energy system.The method accurately and efficiently calculated the over-limit probability of the system state variables,considering the coupling conditions of electricity,heat,and gas,as well as uncertainties and correlations in renewable energy unit outputs and multiple types of loads.To further evaluate and quantify the impact of uncertainty factors on the over-limit risk,a global sensitivity analysis method for the integrated energy system based on the analysis of covariance theory is proposed.This method considered the source-load correlation and aimed to identify the key uncertainty factors that influence stable operation.Simulation results demonstrated that the proposed method achieved accuracy to that of the Monte Carlo method while significantly reducing calculation time.It effectively quantified the over-limit risk under the presence of multiple source-load uncertainties.
Keywords: Probabilistic energy flow;Polynomial chaos expansion;Correlation;Risk assessment;Analysis of covariance
0 Introduction
An integrated energy system (IES)encounters a more comprehensive range of uncertainty factors and complex operation scenarios than independent subsystems due to the large-scale access to renewable energy and the coupled interaction characteristics among multiple systems.The risks associated with the IES have become increasingly complex and diverse,extending beyond voltage and power flow over-limit in the power system [1].It is now necessary to consider risks such as temperature and pressure over-limit in the heat and natural gas systems,respectively,due to the acceptance capacity constraints of each node material [2,3].Therefore,a study on the impact of uncertainties related to source-load variations on the energy flow distribution of the IES through probabilistic energy flow calculation is crucial to evaluate the operating state over-limit risk.
Classical methods for calculating the probabilistic energy flow include Monte Carlo simulation [4],point estimation method [5],and analytical methods,such as the cumulant method [6].Monte Carlo simulation is highly accurate but inefficient and is often used as the benchmark for comparison with other methods [4].The pointestimation method encounters computational efficiency issues when addressing systems with high-dimensional random variables,leading to an increased number sample points and more significant high-order moment errors.The cumulant method may introduce significant approximation errors when applied to systems with strong non-linearity.In recent years,the polynomial chaos expansion (PCE)method has shown high computational accuracy and efficiency in probabilistic power flow calculation for power systems [7,8].By approximating the functional relationship of the original model using chaotic polynomial basis functions,the PCE method has proven its value.Reference [9] developed a generalized copula-PCE framework for power system probabilistic power flow that can handle both linear and nonlinear correlations.However,most current research focuses on electric-gas or electric-heat IES,and studies on the uncertainty analysis of electric-heat-gas IES are scarce.Thus,this study aims to investigate the applicability of the PCE method to high-dimensional and strongly nonlinear electricheat-gas IES and employ it for over-limit risk assessment.
Probabilistic energy flow calculations aid in the qualitatively analysis of the impact of source-load multiple uncertainties on the IES operating state under multi-energy coupling.However,sensitivity analysis can effectively quantify the degree of the impact of sourceload uncertainties and rank the importance of the factors affecting the system operating state over-limit risk [10].Reference [11] proposed a probabilistic power-flow assessment sensitivity matrix that considers electrical and thermal coupling effects to assess the impact of temperature on the flow.However,the uncertainty propagation process in an IES is longer than that in power systems,rendering the traditional partial-derivative-based local sensitivity analysis method inapplicable.Global sensitivity analysis is based on the probability distribution of input random variables,and is suitable for nonlinear and nonmonotonic complex systems.It can analyze the impact of the individual and interactive effects of the input variables on the system output [12].Reference [13] proposed a base-adaptive sparse PCE to compute sensitivity metrics,making global sensitivity analysis usable in complex power systems.Reference [14] eliminated the quadratic cross terms in the secondorder polynomial chaotic expansion by Sobol sensitivity analysis,significantly reducing the computational amount of probabilistic power flow calculation.Reference [15,16] compared several global sensitivity analysis methods,including Spearman,Morris,and Sobol,and concluded that the Sobol method based on the analysis of variance theory is more accurate.However,the premise for applying Sobol theory is that the input random variables are independent [12,15].In practical situations,input random variables often have correlations [17,18].For instance,nearby renewable energy units of similar types tend to have similar outputs due to comparable weather conditions.The same type of load in the same region also exhibits a strong positive correlation.Conversely,wind turbines and photovoltaic units located closer to each other typically demonstrate weak negative correlations.Consequently,when analyzing the energy flow and conducting risk assessments,the correlation of random variables cannot be ignored.
This study contributes in three main aspects:
1)A novel risk assessment method for the IES considering the correlation among input random variables based on the analysis of covariance (ANCOVA)theory was proposed.This method accurately quantified the impact of multiple uncertainties and correlations on the over-limit risk.
2)A probabilistic energy flow calculation method based on the PCE was proposed to address the high dimensionality of random variables and the strong nonlinearity of the electricity-heat-gas IES.This method enables the efficient determination of the probability distributions and over-limit probabilities of the operating state,thereby facilitating a qualitative analysis of the impact of source-load uncertainties.
3)The proposed probabilistic energy flow calculation method based on the PCE was applied to conduct sensitivity analysis for over-limit risk assessment.This approach accurately and effectively obtained the sensitivity index of ANCOVA.
The remainder of the paper is organized as follows.Section 1 establishes a probabilistic energy flow model for an electric-heat-gas IES considering source-load multiple uncertainties.Section 2 calculates the probabilistic energy flow and over-limit probability based on the PCE method.Section 3 conducts sensitivity analysis on the IES based on the ANCOVA and quantifies the over-limit risk.Section 4 employs a standard case for simulation analysis to verify the effectiveness of the proposed method.Finally,Section 5 summarizes the conclusions of this paper.
1 Probabilistic energy flow model for electricheat-gas integrated energy system considering uncertainty
First,a probabilistic model of source-load uncertainty was established to analyze the operating status of the electricity-heat-gas IES comprehensively.Then,a hybrid energy flow model was established based on a detailed model of each system.Finally,a probabilistic energy flow calculation of the IES was conducted considering the uncertainty.
1.1 Modeling of source-load uncertainty
The uncertainty of wind power is mainly related to the fluctuations in wind speed.The Weibull distribution is commonly employed to represent the wind speed within a period.The probabilistic model of the wind speed is expressed as:
whereKandDare the shape and scale parameters of the Weibull distribution,respectively,andvis the wind speed.
The uncertainty of the photovoltaic power is determined by the fluctuations in light intensity.Beta distribution is commonly employed to represent the light intensity within a given period.The probabilistic model of the light intensity is expressed as:
whereαandβare the shape parameters of the Beta distribution,randrmaxare the actual and maximum illumination intensity,respectively,and Γ(⋅)is the Gamma function.
The load side of the IES comprises electric,heat,and gas loads.The load is commonly considered a normal random variable.Taking the electric load as an example,the load active power probabilistic model is established:
wherePmandσare the expectation and standard deviation of the load active power,respectively,andPLis the actual load active power.
There is often a specific correlation between the input random variables that are spatially proximate.The spatial correlation of random variables cannot be ignored when conducting probabilistic energy flow calculations or sensitivity analysis.This study employed the Pearson correlation coefficient to describe the spatial correlation of the source-load random variables.By employing the Cholesky decomposition and equiprobable transformation principles,samples that followed the probability distribution of the random variables and satisfied the desired correlation were generated [19].
1.2 Mixed energy flow model of integrated energy system
Firstly,the models for the power system,heat system,natural gas system,and coupling units were established.In this study,the classic AC model was adopted by the power system.The heat system is a two-level heat network with quantity regulation,including a hydraulic model and a thermal model [20].The natural gas system is a mediumlow-pressure gas network without the compressor.The coupling unit is a combined heat and power (CHP)unit.Detailed models are provided in Appendix A.
Subsequently,a hybrid energy flow model for the electric-heat-gas IES was developed,considering the coupling relationships between these systems [21,22].
In this model,lines 1–2 represent the power deviation of the power system.Lines 3–6 represent the thermal power deviation in the heat system,pressure drop deviation in the loop,supply water temperature deviation,and return water temperature deviation,respectively.Further,Line 7 represents the flow deviation at nodes in the natural gas system.The explanations of the variables in the model are provided in Appendix A.The above hybrid energy flow model was solved using the Newton-Raphson method.
1.3 Probabilistic energy flow calculation for integrated energy system
Probabilistic energy flow calculations for an IES considering uncertainty requires the Monte Carlo sampling of input random variables.However,Monte Carlo simulations involve multiple energy-flow calculations,which can be computationally expensive.Therefore,in the subsequent analysis,a surrogate model based on the PCE was employed to complete the probabilistic energy flow calculation of the electricity-heat-gas IES.
2 Probabilistic energy flow and over-limit probability calculation based on polynomial chaos expansion
PCE is a method for studying stochastic problems using surrogate models.The state variables can be represented using chaotic polynomials based on the known probability models of source-load random variables.The surrogate model can determine the polynomial coefficients by solving the energy flow equation based on a small number of sample points.This approach facilitates the analysis of the distribution of energy flow and over-limit probability.
2.1 Polynomial chaos expansion method
For a square-integrable functionY f=(z)in the probability space,wherez=[z1,z2,...,zm] is anm-dimensional independent random input variable,Ycan be expanded and approximated using a set of orthogonal polynomials for the random input variablez[23]:
whereaiis the undetermined coefficient,ϕi(z)is the basis function of the orthogonal polynomial,andNis the number of terms reserved for polynomial expansion,which is also the number of undetermined coefficients.
If the input random variables follow independent standard normal distributions,the basis function is a Hermitian orthogonal polynomial,and the original modelYcan be further expressed as (6)[24]:
whereA=[a0,a1,...,aN-1]Tis a polynomial coefficient vector,ξ=[ξ1,ξ2,...,ξ m]Tis an m-dimensional vector following the standard normal distribution,andis a vector composed of Hermite orthogonal polynomials.
Once the PCE model described in Eq.(6)is constructed,a set ofMsample points is selected,and the corresponding output responses are computed.Then,the equationsWA=Ycan be formed and solved to obtain the unknown coefficients.Wis the matrix composed of the sample points of the input random variables,andYis the matrix of output responses corresponding to the sample points.
After determining the polynomial coefficients,the original energy flow model can be replaced,thus enabling rapid and accurate energy flow calculations through simple algebraic operations.The entire process only involves solving the hybrid energy flow equations M times.In this study,sample points were selected based on the linear independence principle,thereby ensuring the uniqueness of the solution for the equationWA=Ywhile using the minimum number of sample points (M N=).This method substantially reduced the frequency of solving the energy flow equations compared to Monte Carlo simulation.
2.2 Over-limit probability calculation method
To accurately evaluate the operation of each system under the influence of source-load multiple uncertainties,the PCE model was employed to replace the original complex hybrid energy flow model for the probabilistic energy flow calculation.This approach allowed for obtaining probability distributions of state variables such as voltage,temperature,and pressure.Subsequently,according to the safety operating ranges of each system,the node state over-limit probability was calculated.This facilitated the assessment of state over-limit risks and identified nodes with weak safety levels.
Based on the PCE method,the main steps to implement probabilistic energy flow analysis and assessing the state over-limit risk are as follows:
1)Input the fundamental parameters,such as the probability model parameters for the source-load random variables and the order of the PCE model.
2)SelectMsets of sample points based on the linear independence principle.
3)Transform the sample points into random samples that follow the probability distribution of source and load variables with specified correlations.
4)Substitute the samples into the energy flow model in Eq.(4)and apply the Newton-Raphson method to calculate the output response.
5)Calculate the polynomial coefficients based on the sample points and output response and construct the PCE model.
6)Apply the PCE model to compute the energy flow distribution and statistically obtain the probability information of state variables such as voltage,temperature,and pressure.
7)Calculate the operating state over-limit probability according to the safety operating ranges.
3 Over-limit risk assessment of integrated energy system based on sensitivity analysis
Through probabilistic energy flow calculations,the probability information of the output response in the IES was obtained.This enabled an analysis of the state overlimit probability in the system,providing a qualitative analysis of the impact of source-load multiple uncertainties on the system operating state.However,quantifying the impact of various uncertainty factors on the state over-limit risk and capturing the interactive effects among multiple energy systems during the propagation of uncertainties remain to be solved [4].This study calculated the global sensitivity index,which considers the correlation between random variables,employing the ANCOVA theory.This index quantifies the impact of source-load multiple uncertainty factors on the state over-limit risk.
3.1 Sensitivity analysis method considering correlation
The sensitivity analysis method based on ANCOVA extends the Sobol sensitivity analysis by utilizing the variance to express uncertainty [25].The difference is that the former applies the ANCOVA theory,which considers the correlation between input random variables.Consequently,the sensitivity analysis method based on ANCOVA aims to produce valuable sensitivity indexes for correlated input random variables,allowing for a more accurate assessment of their impact on the variance in the output responses.
Considering a square-integrable system modelY f=(z),the system model was expanded to the high dimensions by applying the Sobol decomposition [26]:
wheref0is a constant term.The component functions of different orders off i(zi),f ij(z i,zj),andf1,2,...,m(z1,z2,...,zm)are mutually orthogonal.
The first-order sensitivity index is defined to assess the contribution of variablezito the variance as follows:where the numerator is the covariance between the firstorder componentf i(zi)of the variableziand the outputY,and the denominator is the variance of the outputY.
Furthermore,the numerator is decomposed into the variance and covariance parts.Therefore,the first-order sensitivity is decomposed into independent and correlated components.In other words,the contribution of the variablezito the variance is divided into individual contribution and joint contribution with other components:
wherefv∩{i}=∅(zv)represents all component functions except for the first-order componentf i(zi)of variablezi.According to Eq.(9),it can be observed that the independent component of the first-order sensitivity is always positive,while the correlated component can be either positive or negative.
In the absence of any correlation between the input variables,the covariance term in Eq.(9)disappears due to the orthogonality of the component functions.However,in a practical IES,the correlation between multiple random variables on the source side and the load side cannot be ignored [27].When considering the correlation between input variables,the covariance between the first-order componentf i(zi)of variableziand other componentsfv∩{i}=∅(zv)may arise not only from correlation but also from the involvement ofziin both terms [28].Therefore,the covariance term in Eq.(9)can be further decomposed into contributions from correlation and interaction effects.Additionally,the first-order sensitivity index can be represented as the sum of three indexes:
The sensitivity analysis method based on ANCOVA defines a first-order sensitivity index through the covariance expansion of the output variance.It decomposes the firstorder sensitivity index into three components,providing a more detailed separation of the effects of the input random variablezithan other methods.represents the independent influence of the input variable,reflecting the contribution of each input variable to the output without considering other variables.In other words,it measures the impact of an input variable on the output when other input variables are constant.is described by the covariance between the first-order componentf i(zi)of variableziand the componentsf{i}∉v(zv)of other variables excludingzi.It reflects the impact of the correlation between variableziand other variables.is described by the covariance between the first-order componentf i(zi)of variableziand the higherorder componentsf{i}∈u(zu)that includezi.This reflects the interaction effects among the input random variables.
3.2 Over-limit risk assessment process of the integrated energy system
A sensitivity analysis based on ANCOVA considers the correlations among multiple random variables in the IES and calculates the sensitivity indexesSi,andThese indexes quantitatively measure the impact of the source-load random variables on the operating state over-limit risk,providing a foundation for a safe and stable operation.In practical applications,the traditional simulation method requires considerable energy flow calculations to obtain the global sensitivity index.For an IES with a large number of random variables,this approach involves significant computational effort.In this Section,the PCE is introduced as a surrogate model to estimate the sensitivity index,aiming to reduce computation time and improve computational efficiency.The over-limit risk assessment process based on the sensitivity analysis is as follows:
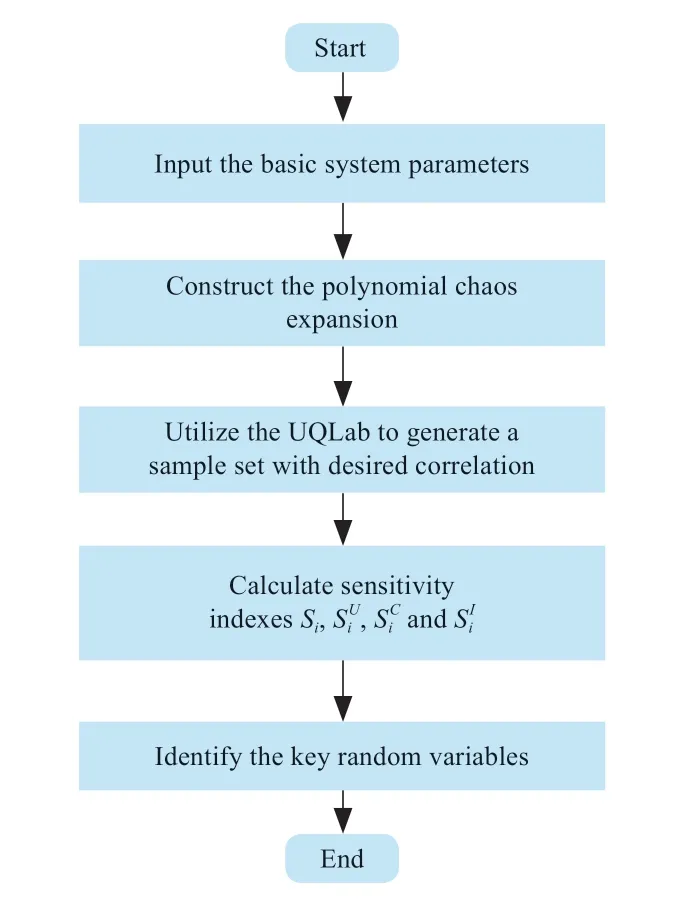
Fig.1 The process of over-limit risk assessment based on sensitivity analysis
1)Input the basic system parameters,including the probability distribution parameters of the source and load random variables,the correlation coefficients of the random variables,and the order of the PCE.
2)Construct the PCE model based on the algorithm described in section 3.2.
3)Apply the UQLab toolbox to model the correlation of input random variables based on Copula theory.Generate a sample set that follows the joint probability distribution of the correlated random variables.
4)Apply the PCE method to compute the sensitivity indexesSi,according to (11),(12),and (13).
5)Identify the key random variables that cause the operating state to exceed the limit.
4 Case analysis
A standard case study was employed to validate the efficacy of the sensitivity analysis method based on ANCOVA in the operating state over-limit risk assessment of the IES,considering the correlation among variables.The subsequent example test was conducted using the Intel(R)Core(TM)i5-8400 CPU and the MATLAB R2023a platform.
4.1 Case description
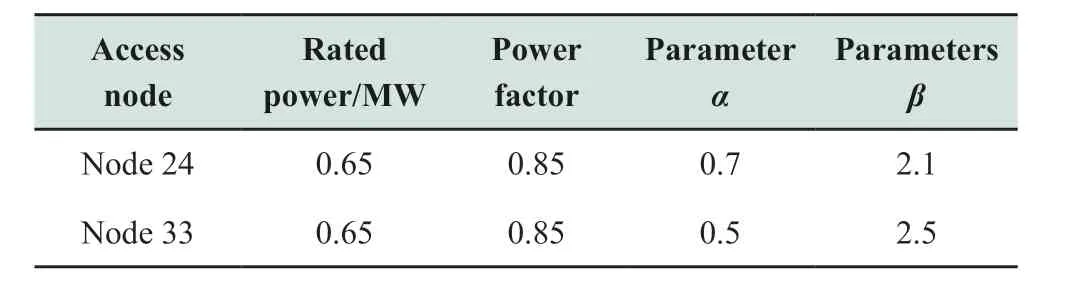
The case involved an improved IES that couples a 33-node distribution network,a 32-node heat network,and an 11-node natural gas network,as depicted in Fig.2.The random variables considered in this case include the wind power at nodes 18 and 25,the photovoltaic power at nodes 24 and 33,and the load of each system.The correlation coefficient for the renewable energy output of the same type was 0.8.The correlation coefficient for wind and photovoltaic power between adjacent nodes 24 and 25 was -0.1.Additional parameters for wind and photovoltaic power are presented in Appendix B.The system structural parameters and load expectations for each system are detailed in [29,30],with a standard deviation of 10% of the expectation.The correlation coefficient between loads is 0.8.Node 1 in the heat network serves as the heat network balance node.The operating mode of the CHP1 unit determined the power by heat,and the CHP2 unit determined the heat by power.
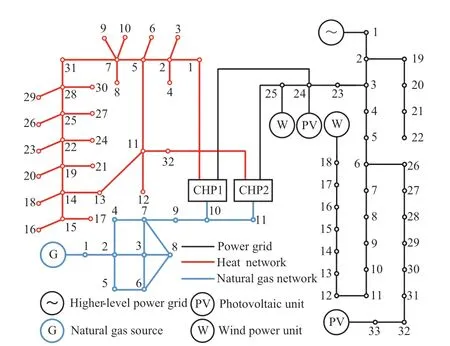
Fig.2 Topology diagram of the standard IES
4.2 Validity test of over-limit probability calculation method based on polynomial chaos expansion
In order to validate the feasibility and superiority of the PCE method for probabilistic energy flow calculation in the IES,an error analysis of the calculation results of the PCE method was conducted.The results of the Monte Carlo simulation with a sampling scale of 20,000 serve as the benchmark.The results of the PCE method are compared with those of Monte Carlo simulation and cumulant method based on K-means clustering [4,5,19,31].Figure 3 shows the probability density of voltage amplitude at power grid node 24 obtained by the PCE method and the Monte Carlo simulation.Figure 4 shows the relative errors in the expectations for supply water temperature of the heat network node and pressure of the gas network node obtained by the PCE and cumulant methods,compared with the Monte Carlo simulation.Table 1 lists the average relative errors for each state variable.
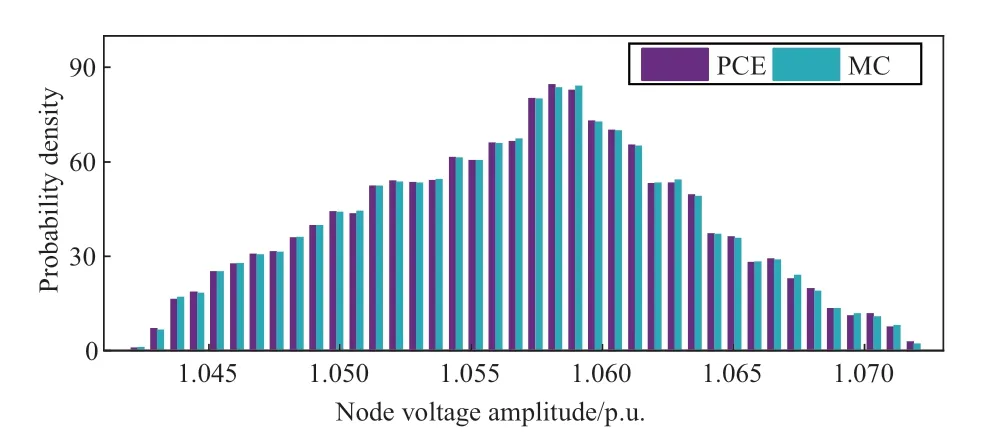
Fig.3 Probability density of voltage amplitude at power grid node 24

Table 1 Average relative errors for state variables
Figure 3 demonstrates that the probability density of the voltage amplitude calculated using the PCE method closely aligned with the results of the Monte Carlo simulation,indicating high calculation accuracy.Table 1 reveals that the maximum average relative error for state variables calculated by the PCE method was only 0.0236%,in contrast to the cumulant method’s maximum of 0.4172%.As depicted in Fig.4,when dealing with highly nonlinear heat and natural gas systems,the PCE method exhibited smaller errors in supply water temperature and pressure compared to the cumulant method.In particular,the superiority of the PCE method becomes more pronounced when calculating the state variables in the heat network.This advantage was attributed to the node flow equation in the gas network being a second-order nonlinear function,whereas the thermal equation in the heat network was a high-order nonlinear function,resulting in a greater approximation linearization error for the cumulant method.
Regarding computational efficiency,the PCE method simplifies the repetitive energy flow calculations,completing the process in just 11 s.The Monte Carlo simulation requires 313 s,and the cumulant method takes 7 s.To assess the applicability of the PCE method for largerscale IES,the power system was replaced with a larger 69-node distribution network [32].Due to the increased scale of the power system,the time required for a single calculation using Monte Carlo simulation increased,with a total time of 926 s.Similarly,the PCE method also experienced a notable increase,taking 109 s.This is because the number of polynomial terms in the PCE model increases dramatically with the dimensionality of random variables,resulting in significantly higher computational costs.Currently,some studies utilize least angle regression to select a few key polynomial terms and construct sparse polynomials,thereby balancing computational efficiency and accuracy [33].In summary,compared to the Monte Carlo simulation,the PCE method still maintains a significant advantage in terms of efficiency.
Based on the results of the probabilistic energy flow calculation,the voltage over-limit probability was obtained as shown in Fig.5.For the distribution network in this case,most nodes exhibited a low over-limit probability,indicating stable operation under the conditions of renewable energy access and load fluctuations.Only a few nodes around nodes 24 and 25 are affected by heat network coupling and renewable energy access,which have a high over-limit probability and weak security.Therefore,suitable renewable energy access nodes and coupling nodes are prerequisites for stable operation.In this case,the voltage of the renewable energy access node and its surrounding nodes was a critical monitoring objective for the power grid to ensure safe and stable operation.According to Fig.5,it can also be observed that the voltage over-limit probability obtained by the PCE method closely aligned with the probability obtained by the Monte Carlo simulation.
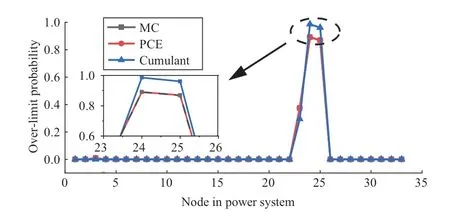
Fig.5 Voltage over-limit probability of power grid node
4.3 Validity test of over-limit risk assessment method
In order to quantitatively assess the impact of sourceload uncertainty on the state over-limit risk,the ANCOVA sensitivity index was calculated using the PCE method,considering the correlation between uncertainty factors.
The Copula module in the UQLab toolbox was utilized to generate a sample set that followed the joint probability density function of the random variables with correlation.Figure 6 shows the sample distributions of the ten random variables,considering the correlation.Variables X1 and X2 represent the wind speeds at nodes 18 and 25 with a correlation coefficient of 0.8,respectively.Variables X3 and X4 represent the light intensity at nodes 24 and 33 with a correlation coefficient of 0.8,respectively.Additionally,there is a weak negative correlation between wind speed X2 and light intensity X3 with a correlation coefficient of -0.1.Variables X5 to X10 correspond to the electric,heat,and gas loads,respectively,with a correlation coefficient of 0.8.The diagonal shows the probability density of each variable,while the remaining plots depict the sample distributions of the variables corresponding to the coordinates.
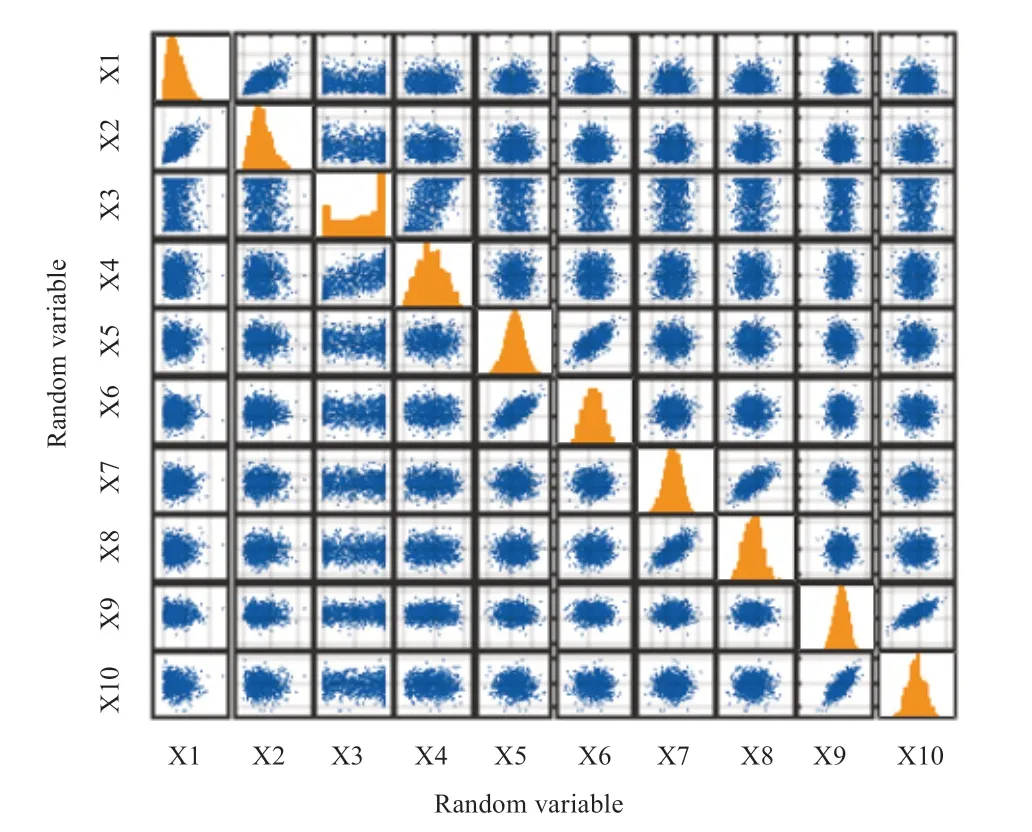
Fig.6 Samples of random variables considering the correlation
Taking the voltage amplitude of node 24 as the output response,the first-order sensitivity index was calculated,as shown in Fig.7.The key variables affecting the system state can be roughly identified based on a first-order sensitivity index.Wind and photovoltaic power X1-X4,electric loads X5-X6,and heat loads X7-X8 all impact the voltage of node 24.The fluctuation in heat load can affect the energy flow distribution in the power grid due to the CHP1 unit operating mode of determining electricity by heat.However,the fluctuations in the gas load were balanced by the natural gas source and did not affect the energy flow distribution in the power grid.Additionally,compared with smaller load fluctuations,wind and photovoltaic power have a greater impact on the voltage,particularly at the nodes around node 24.
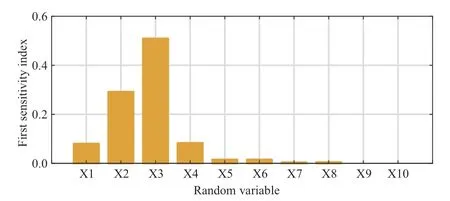
Fig.7 First-order sensitivity indexes of the voltage amplitude of node 24
The sensitivity analysis method based on ANCOVA further decomposed the first-order sensitivity index into the uncorrelative,correlative,and interactive indexes.Table 2 and Table 3 show the sensitivity indexes obtained by taking the supply water temperature at the heat network node 2 and the pressure at the gas network node 11 as the output responses,respectively.
According to Table 2 and Table 3,the primary factors influencing the supply water temperature and the pressure were the wind power at node 25S25,Ts=0.5277,S25,pr=0.0075,and heat loadSHload Ts,=0.4242,SHload pr,=0.9927.Additionally,there was a slight influence from the electric load at node 25.Analyzing the operating mode of the coupled unit,the heat generation of the CHP2 unit at the gas network node 11 was determined by the power generation.Therefore,the power fluctuation caused by the wind power and load fluctuations at node 25 affected the energy flow distribution of the heat and gas networks.However,the fluctuations in random variables at other power grid nodes had no impact.This is because the power grid was interconnected with the main grid,and the power fluctuations resulting from source-load variations in other power grid nodes were entirely balanced by the main grid.

Table 2 Sensitivity indexes of supply water temperature at heat network node 2
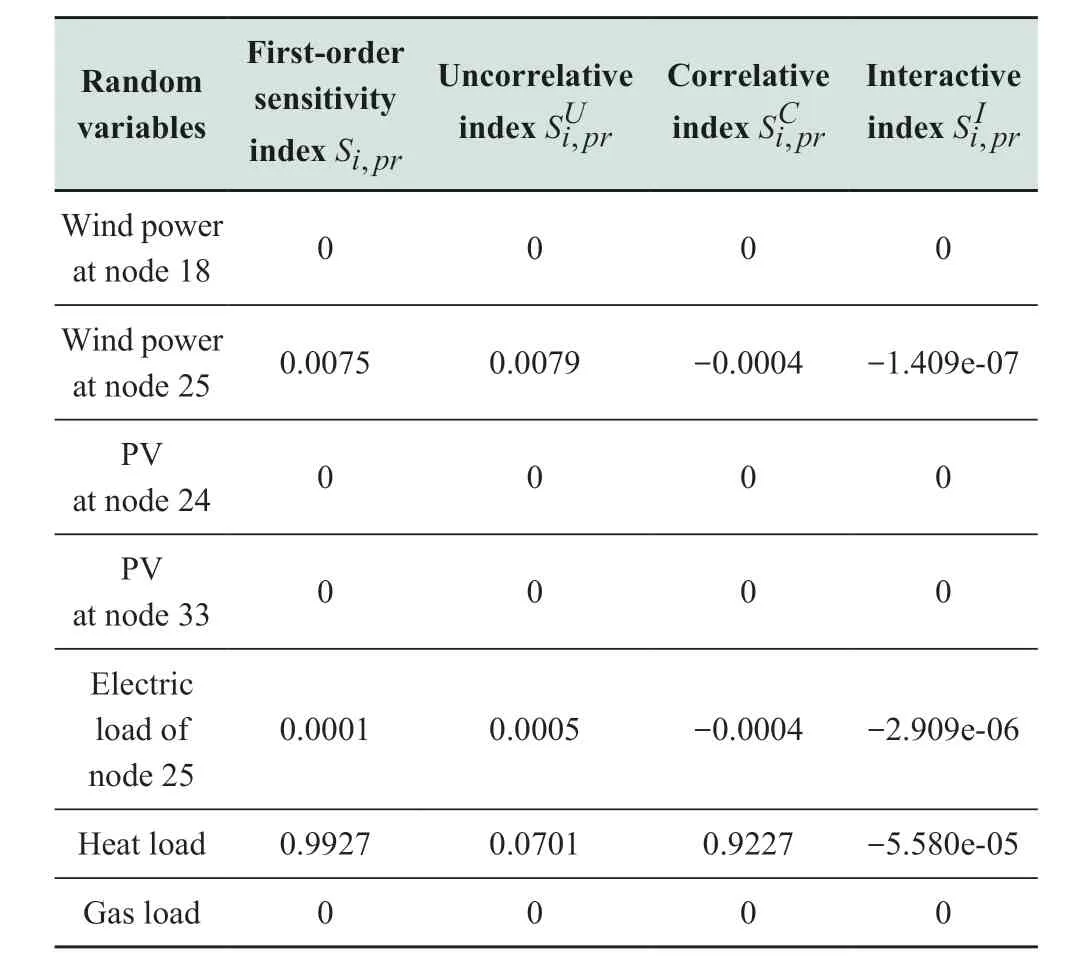
Table 3 Sensitivity indexes of pressure at gas network node 11
According to Table 3,the heat load sensitivity was significantly higher than those of other loads.Analyzing the energy supply relationship in the IES,it is known that the heat load was entirely supplied by the CHP units.The amount of natural gas required to meet the heat load demand is much higher than the gas load in the gas network.Therefore,the heat load has a greater impact on the pressure at gas network node 11.A horizontal comparison of the sensitivity indexes in Table 3 revealed that after considering the correlation between random variables,the correlative index=0.9227 dominates the firstorder sensitivity index of the heat load.The uncorrelative influence and interactive influence were very small and close to zero.Comparing the correlation index in Table 3,it can be observed that the correlation effect of heat load cannot be ignored because the correlation among all heat loads is significant.Conversely,random variables such as photovoltaic power at node 24 and wind power at node 18,which are correlated with wind power at node 25,did not affect the pressure at the gas network node.Therefore,the correlative index of wind power at node 25=-0.0004 is relatively small.In summary,when assessing the impact of random variables on the over-limit risk,the operating modes of coupling units and the correlations between random variables significantly influence the sensitivity index.
To demonstrate the difference in the sensitivity index with and without correlations,the Sobol method was used to calculate a series of sensitivity indexes for the supply water temperature at heat network node 2,disregarding the correlations.The results are presented in Table 4.From Table 2,it can be seen that the contribution of the heat load to the supply water temperature mainly lies in the correlation between loads.However,the Sobol method cannot account for the correlation between heat loads.From Table 4,it can only obtain interaction indexes,which cannot reflect the impact of correlation on the operating state.Consequently,the Sobol first-order sensitivity index calculated for heat load is significantly reduced.To a certain extent,this affected the identification of key random variables,which may cause over-limit operating states.
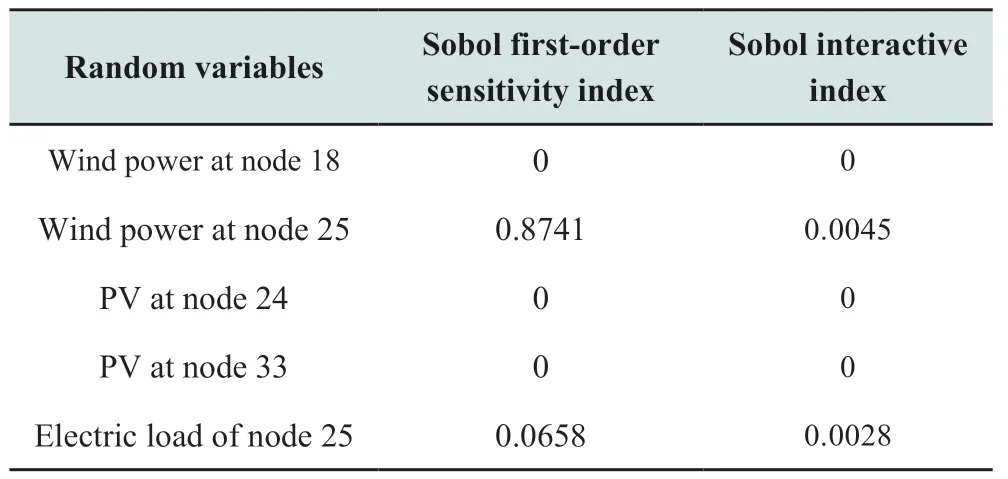
Table 4 Sobol sensitivity indexes of supply water temperature for heat network node 2

continue
4.4 Impact of load fluctuation and correlation on over-limit risk
To further analyze the impact of the random variable fluctuations on the over-limit risk assessment,the standard deviation of the heat load was changed to 0.05,0.075,0.10,0.125,and 0.15 times the mean,respectively.The changes in sensitivity indexes for the supply water temperature at the heat network node 2 are shown in Fig.8.It is evident that as the standard deviation of the heat load increases,the sensitivity indexes of the heat load to supply water temperature continuously increased,whereas those of wind power at node 25 decrease.In other words,as the fluctuation of the heat load increased,the influence of the heat load on the supply water temperature became more pronounced,whereas the influence of other random variables,such as wind power,was weakened.Additionally,increasing heat load volatility amplifies the impact of the correlation between the loads on the supply water temperature.Therefore,higher volatility not only directly increases the individual effects on the over-limit risk but also enhances the impact of correlations with other variables.
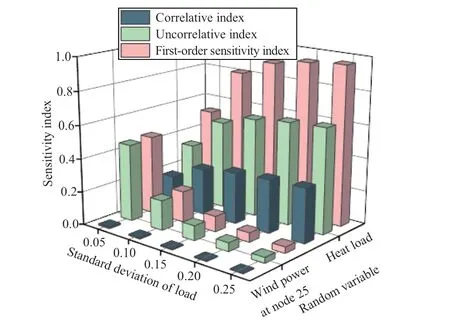
Fig.8 Sensitivity indexes corresponding to different heat load fluctuations
To further analyze the impact of the correlation between random variables on the over-limit risk assessment,the correlation coefficients between heat loads were changed to 0,0.2,0.4,0.6,and 0.8 while keeping the other correlations unchanged.The changes in sensitivity indexes for the supply water temperature at the heat network node 2 are shown in Fig.9.As the correlation coefficient of the heat load increased,the correlation strengthened,and the correlative index gradually increased,and the uncorrelative index decreased.The increase in the first-order sensitivity index for the heat load was mainly due to the increasing correlative index.As the sensitivity indexes of the heat load increased,their contributions to the supply water temperature increased,leading to a corresponding decrease in the contributions of the other random variables.This was reflected in the decreasing sensitivity indexes for wind power at node 25.Therefore,a stronger correlation of random variables increases the impact of the correlations with other variables on the operating state over-limit risk while weakening the independent role of the variable itself and other random variables.

Fig.9 Sensitivity indexes corresponding to different heat load correlations
In conclusion,the volatility and correlation of the random variables were positively correlated with the sensitivity index.In other words,as the volatility and correlation of random variables increased,their influence on the operating state increased,as did the influence of the variables on the operating state and their contribution to the over-limit risk.However,the specific impact mechanisms depended on the operating mode of the IES.
5 Conclusion
In this study,a probabilistic energy flow calculation method based on the PCE was proposed for assessing the operating state over-limit risk in an electric-heat-gas IES.This method considered the uncertainties and correlations of source-load random variables.Additionally,sensitivity indexes that account for correlations were introduced using the ANCOVA theory to evaluate the impact of random variables on the over-limit risk.The main conclusions are as follows:
1)The proposed probabilistic energy flow calculation method accurately and efficiently determined the probability distribution and over-limit probability of operating states,such as voltage,temperature,and pressure.Compared with the Monte Carlo simulation,the proposed method significantly reduces computation time.Furthermore,it improved the accuracy compared to the cumulant method,with a maximum average relative error of only 0.0236% in the expectation values of the state variables.
2)The proposed sensitivity analysis method based on the ANCOVA adequately considered the correlations between random variables.It accurately calculated the firstorder sensitivity,uncorrelative,correlative,and interactive indexes and quantified the impact of multiple random variables from sources and loads on the operating state overlimit risk.
3)The volatility and correlations of the random variables affected the sensitivity index.The specific impact mechanism of the random variables on the operating state over-limit risk was closely related to the operating mode of the multi-energy coupling system.
While the IES modeling in this study focuses on the steady-state stage,future research should consider the timescale differences among various systems and incorporate more detailed dynamic processes.This would impose higher requirements on probabilistic energy flow calculation and risk assessment.In addition,the coupling between the different systems in this study was achieved solely through the CHP unit.Further research is required to investigate the feasibility of the proposed methods under various coupling configurations.
Acknowledgements
This work was supported in part by the National Natural Science Foundation of China (No.51977005).
Declaration of Competing Interest
We declare that we have no conflict of interest.
Appendix A
The power system adopts the classic AC model,and the node power balance equation is:
wherePGiandQGiare the active and reactive output of generators including renewable energy units at the nodei;PLiandQLiare the active load and reactive load at the nodeI;Neis the number of nodes in the power system;Viis the node voltage amplitude;GijandBijare Conductance and susceptance;θijis phase angle differences.
The heat system mainly comprises a water supply pipe network and a return water pipe network.The water flow is transported from the heat source to loads through the water supply network and then returns to the heat source through the return water network.In this paper,the heat system is a two-level heat network whose adjustment method is quantity regulation.It is modeled by a quasi-static thermal model.The model generally includes a hydraulic model and a thermal model.
Based on the two basic laws of node flow continuity and loop pressure balance,the following hydraulic model is established:
whereAsandBhare respectively the node correlation matrix and the branch correlation matrix of the water supply network;mis the pipeline flow rate;mqis the flow rate out of the node;Khis the pipeline resistance coefficient.
Based on the three temperature variables of the nodes in the system,supply water temperatureTS,return water temperatureTr,and outlet temperatureTo,the following thermal model considering pipeline heat loss is established:
where (4)is the node heat balance equation,cpis the specific heat capacity of water,Φinis the thermal power injected into the node.Equation (5)indicates that there is heat loss in the pipeline.Tend,Tstart,andTaare the pipe end temperature,head end temperature,and ambient temperature,respectively.λandLare pipeline parameters.Equation (6)represents the temperature relationship before and after hot water mixing,moutandminare the flow rates of outflow and inflow nodes,ToutandTinare the temperatures of water outflow and inflow nodes.
The natural gas system mainly consists of natural gas sources,gas pipelines,and compressors.The compressor is mainly used to increase the gas supply pressure to ensure the gas supply volume.It is relatively common in high-pressure gas transmission networks.This article studies the medium and low-pressure gas network and omits the compressor model.The natural gas system mainly meets the node flow continuity:
where (7)represents the relationship between the natural gas pipeline flow ratefand the node pressurepi.Kgis the pipeline resistance coefficient,kis related to the pressure level of the gas transmission network,sijrepresents the natural gas flow direction,whenpi>pj,sij=+1,whenpi Multi-energy coupling units in the integrated energy system include combined heat and power (CHP)units,gas boilers,electric boilers,etc.To simplify calculations,this study uses CHP to complete the energy coupling between electric,hot,and gas systems.The energy conversion relationship of the CHP is: whereΦCHPandPCHPare the thermal power and electric power generated by the CHP unit;FCHPis the amount of natural gas consumed by the CHP unit;cmandηeare the thermoelectric conversion efficiency and gas-to-electricity conversion efficiency of the CHP unit. Based on the above four parts of the model,the hybrid energy flow model of the electric-heat-gas IES is established as follows: where lines 1-2 represent the power deviation of the power system,the unknown variables are the voltage phase angle between the PV node and the PQ node and the voltage amplitude of the PQ node.Lines 3-6 represent the thermal power deviation of the thermal system,pressure drop deviation in the loop,supply water temperature deviation,and return water temperature deviation,respectively.The unknown variables are the water temperature of some nodes and pipeline flow,Cs,Cr,bs,brare coefficient matrices.Line 7 represents the flow deviation at nodes in the natural gas system,and the unknown quantity is the pressure of some nodes.Appendix B The cut-in wind speed,cut-out wind speed,and rated wind speed of wind turbines are 3m/s,13m/s,and 25m/s,respectively. Table B1 Parameters of wind turbine and wind speed distribution Table B2 Parameters of photovoltaic units and light intensity distribution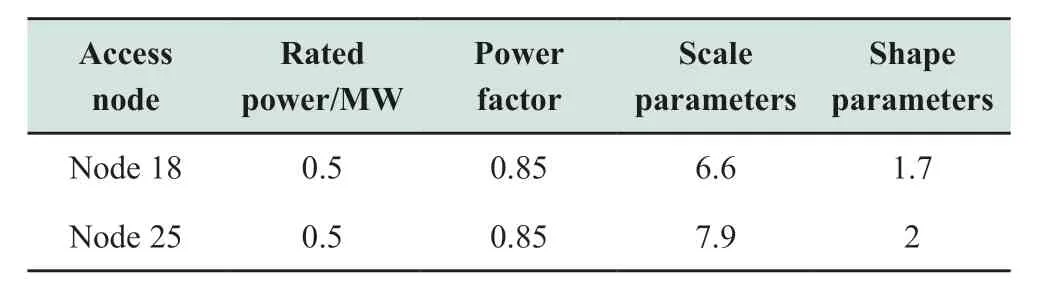
杂志排行

Global Energy Interconnection的其它文章
- Optimal dispatch approach for rural multi-energy supply systems considering virtual energy storage
- Federated double DQN based multi-energy microgrid energy management strategy considering carbon emissions
- Coordinated planning for flexible interconnection and energy storage system in low-voltage distribution networks to improve the accommodation capacity of photovoltaic
- Layered power scheduling optimization of PV hydrogen production system considering performance attenuation of PEMEL
- Application of four machine-learning methods to predict short-horizon wind energy
- A robust optimization model for demand response management with source-grid-load collaboration to consume wind-power