Influence of Surface Types on the Seasonality and Inter-Model Spread of Arctic Amplification in CMIP6※
2023-12-26YanchiLIUYunqiKONGQinghuaYANGandXiaomingHU
Yanchi LIU, Yunqi KONG, Qinghua YANG,2, and Xiaoming HU*,2
1School of Atmospheric Sciences, Sun Yat-sen University and Southern Marine Science and Engineering Guangdong Laboratory (Zhuhai), Zhuhai 519000, China
2Guangdong Province Key Laboratory for Climate Change and Natural Disaster Studies, Zhuhai 519000, China
ABSTRACT A robust phenomenon termed the Arctic Amplification (AA) refers to the stronger warming taking place over the Arctic compared to the global mean.The AA can be confirmed through observations and reproduced in climate model simulations and shows significant seasonality and inter-model spread.This study focuses on the influence of surface type on the seasonality of AA and its inter-model spread by dividing the Arctic region into four surface types: ice-covered, iceretreat, ice-free, and land.The magnitude and inter-model spread of Arctic surface warming are calculated from the difference between the abrupt-4 × CO2 and pre-industrial experiments of 17 CMIP6 models.The change of effective thermal inertia (ETI) in response to the quadrupling of CO2 forcing is the leading mechanism for the seasonal energy transfer mechanism, which acts to store heat temporarily in summer and then release it in winter.The ETI change is strongest over the ice-retreat region, which is also responsible for the strongest AA among the four surface types.The lack of ETI change explains the nearly uniform warming pattern across seasons over the ice-free (ocean) region.Compared to other regions, the ice-covered region shows the maximum inter-model spread in JFM, resulting from a stronger inter-model spread in the oceanic heat storage term.However, the weaker upward surface turbulent sensible and latent heat fluxes tend to suppress the inter-model spread.The relatively small inter-model spread during summer is caused by the cancellation of the inter-model spread in ice-albedo feedback with that in the oceanic heat storage term.
Key words: Arctic amplification, surface type dependence, seasonal energy transfer, effective thermal inertia
1.Introduction
In response to the increase in anthropogenic greenhouse gases, present-day observations (Polyakov et al., 2002; Graversen et al., 2008; Wang et al., 2016) and climate model simulations (Barnes and Polvani, 2015; Hahn et al., 2021) show that the near-surface warming rate of the Arctic is about twice as fast as that of the rest of the regions on Earth, a phenomenon called Arctic amplification (AA).The seasonal pattern of AA shows that the warming of the Arctic reaches its peak in winter and is at its weakest in summer (Serreze et al., 2009).However, the amplitude and seasonal patterns of surface warming over the Arctic (Sejas et al., 2014; Laîné et al., 2016) vary with the underlying surface characteristics(Taylor et al., 2022).Currently, model simulations for AA prediction have large inter-model uncertainties (Ye and Messori, 2021), especially in winter (Hu et al., 2022).Finding out the sources of inter-model differences helps to provide a better understanding of the physical mechanism of AA and further narrows its inter-model spread.
The contributing factors of AA and the relative importance of various feedbacks are still debatable topics.In light of the large amount of solar shortwave radiation reflected by sea-ice-covered surfaces, the surface albedo feedback is widely recognized as the dominant factor of AA (Hall,2004; Screen and Simmonds, 2010; Sejas et al., 2021).However, the fact that the maximum warming occurs in winter when there is little solar radiation over the Arctic suggests the importance of other feedbacks in AA.Experiments under the CO2forcing with a fixed ice coverage still reveal an AA pattern (Alexeev et al., 2005; Langen et al., 2012;Kim et al., 2018).These studies provide evidence of the important roles of other feedback mechanisms for AA.Based on the conventional TOA-based feedback analysis framework, the lapse rate feedback is negative in the tropics but positive in the Arctic, implying that the lapse rate is the largest contribution to AA (Pithan and Mauritsen, 2014).Other feedbacks such as cloud and/or water vapor feedback(Vavrus, 2004; Chen et al., 2011), longwave radiation feedback related to the increase of water vapor and clouds (Winton, 2006), atmospheric heat transfer (Chung and Räisänen,2011; Stuecker et al., 2018), and oceanic heat transfer (Holland and Bitz, 2003; Hwang et al., 2011) can also explain part of the AA.
The sea-ice melting results in a reduction of surface albedo and a consequent increase in the absorption of solar energy by the surface layer of the Arctic Ocean.Because of the large thermal inertia and/or thermal expansion of the surface layer, a large portion of the heat gained from the extra solar energy absorbed is temporally stored by the Arctic Ocean, resulting in a small surface warming in summer.The heat withheld in summer is then released in winter, causing strong surface warming.These processes are referred to as the seasonal energy transfer (SET) mechanism, which is considered the main mechanism of the seasonal pattern of AA(Boeke and Taylor, 2018; Dai et al., 2019; Chung et al.,2021; Hu et al., 2022).Specifically, seasonal energy exchange in sea-ice retreat regions contributes significantly to AA (Boeke and Taylor, 2018).Recent studies indicate that the change in thermal inertia is the main contributing factor to the seasonal cycle of AA (Dwyer et al., 2012; Sejas and Taylor, 2020; Hahn et al., 2022; Hu et al., 2022).Regionally, changes in thermal inertia depend on the surface types to a large degree, which suggests that differences in AA over different surface types may be attributed to the differences in the specific heat capacity and the depth of the surface layer.
The main processes accounting for AA are also the main sources of inter-model spread in projected AA by multi-model simulations.Several studies point out that surface albedo feedback can largely explain the inter-model spreads of AA (Holland and Bitz, 2003; Pithan and Mauritsen, 2014; Hu et al., 2020, 2022).Furthermore, ocean heat transport (Mahlstein and Knutti, 2011), internal climate variability (Ye and Messori, 2021), and seasonal energy exchange related to local feedback processes (Boeke and Taylor, 2018) are important processes related to the differences in model simulations of AA.
In this study, we aim to analyze the influence of surface types on the seasonal pattern of AA and its inter-model spreads.For this purpose, we use the climate feedbackresponse analysis method (CFRAM; Cai and Lu, 2009) to attribute AA over various surface types to an individual set of feedbacks.CFRAM is an atmosphere–surface coupling method based on the energy balance of the atmosphere and the underlying land/ocean column.CFRAM allows us to quantitatively separate the contribution of radiative and non-radiative processes to AA.Partial temperature changes (PTCs)due to the isolated response of a single feedback process to external forcing are additive.It follows that the sum of PTCs is the total response to external forcing.
The remainder of the paper is organized as follows.Section 2 presents the data and methods.Section 3 describes the differences in Arctic warming and its inter-model spread over four surface types.Conclusions and discussions are given in section 4.
2.Data and methods
The data used in this study is obtained from the Coupled Model Intercomparison Project Version 6 (CMIP6).The climate response to CO2quadrupling is defined as the 20-year mean in 121–140 years of CO2quadrupling (abrupt-4×CO2)experiments compared to their counterparts last 50 years of the pre-industrial (PI) experiments.Table 1 lists the 17 CMIP6 models used in this study and the corresponding global mean surface temperature response.All data are monthly mean outputs derived from the models, archived and freely accessible at https://esgf-node.llnl.gov/search/cmip6/and https://www.wcrp-climate.org/wgcm-cmip/wgcm-cmi p6.Variables used in this study are surface temperature, air temperature, specific humidity, cloud amount, cloud liquid/ice water content, surface upwelling and downwelling shortwave/longwave radiation, downward solar energy flux at the top of the atmosphere (TOA), surface upward sensible and latent heat fluxes, and sea-ice concentration (SIC).The differences in surface temperature between the abrupt-4 ×CO2experiments and PI experiments over the Arctic region(60°–90°N) represent Arctic surface warming.We consider one standard deviation of the individual models’ simulations from the multiple model ensemble (MME) mean as the intermodel spread.
Following Taylor et al.(2022), the entirety of the Arctic region is divided into four categories of different surface types: ice-covered, ice-retreat, ice-free, and land surface according to the SIC of each grid point in different months simulated by 17 CMIP6 models (see definition in Fig.1).The spatial distributions of the surface types in individual models are shown in Fig.1 based on changes in annual mean SIC values.It should be noted that for monthly surface temperature change, the surface type is identified based on monthly SIC values.Figure 2 displays the seasonal cycle of the areal mean MME climatological SIC in PI experiments(Figs.2a–c) and abrupt-4 × CO2experiments (Figs.2d–f),as well as the difference in SIC between these two experiments (Figs.2g–i).In the PI experiments, most ice-covered and ice-retreat regions are occupied by sea ice.Driven by the quadrupling of CO2, the ice-retreat region experiences the largest sea-ice loss, and ΔSIC reaches its maximum in December-January-February and its minimum value in July-August-September (Fig.2h).In contrast, sea-ice loss reaches its maximum value in September and its minimum value in March (Fig.2g).
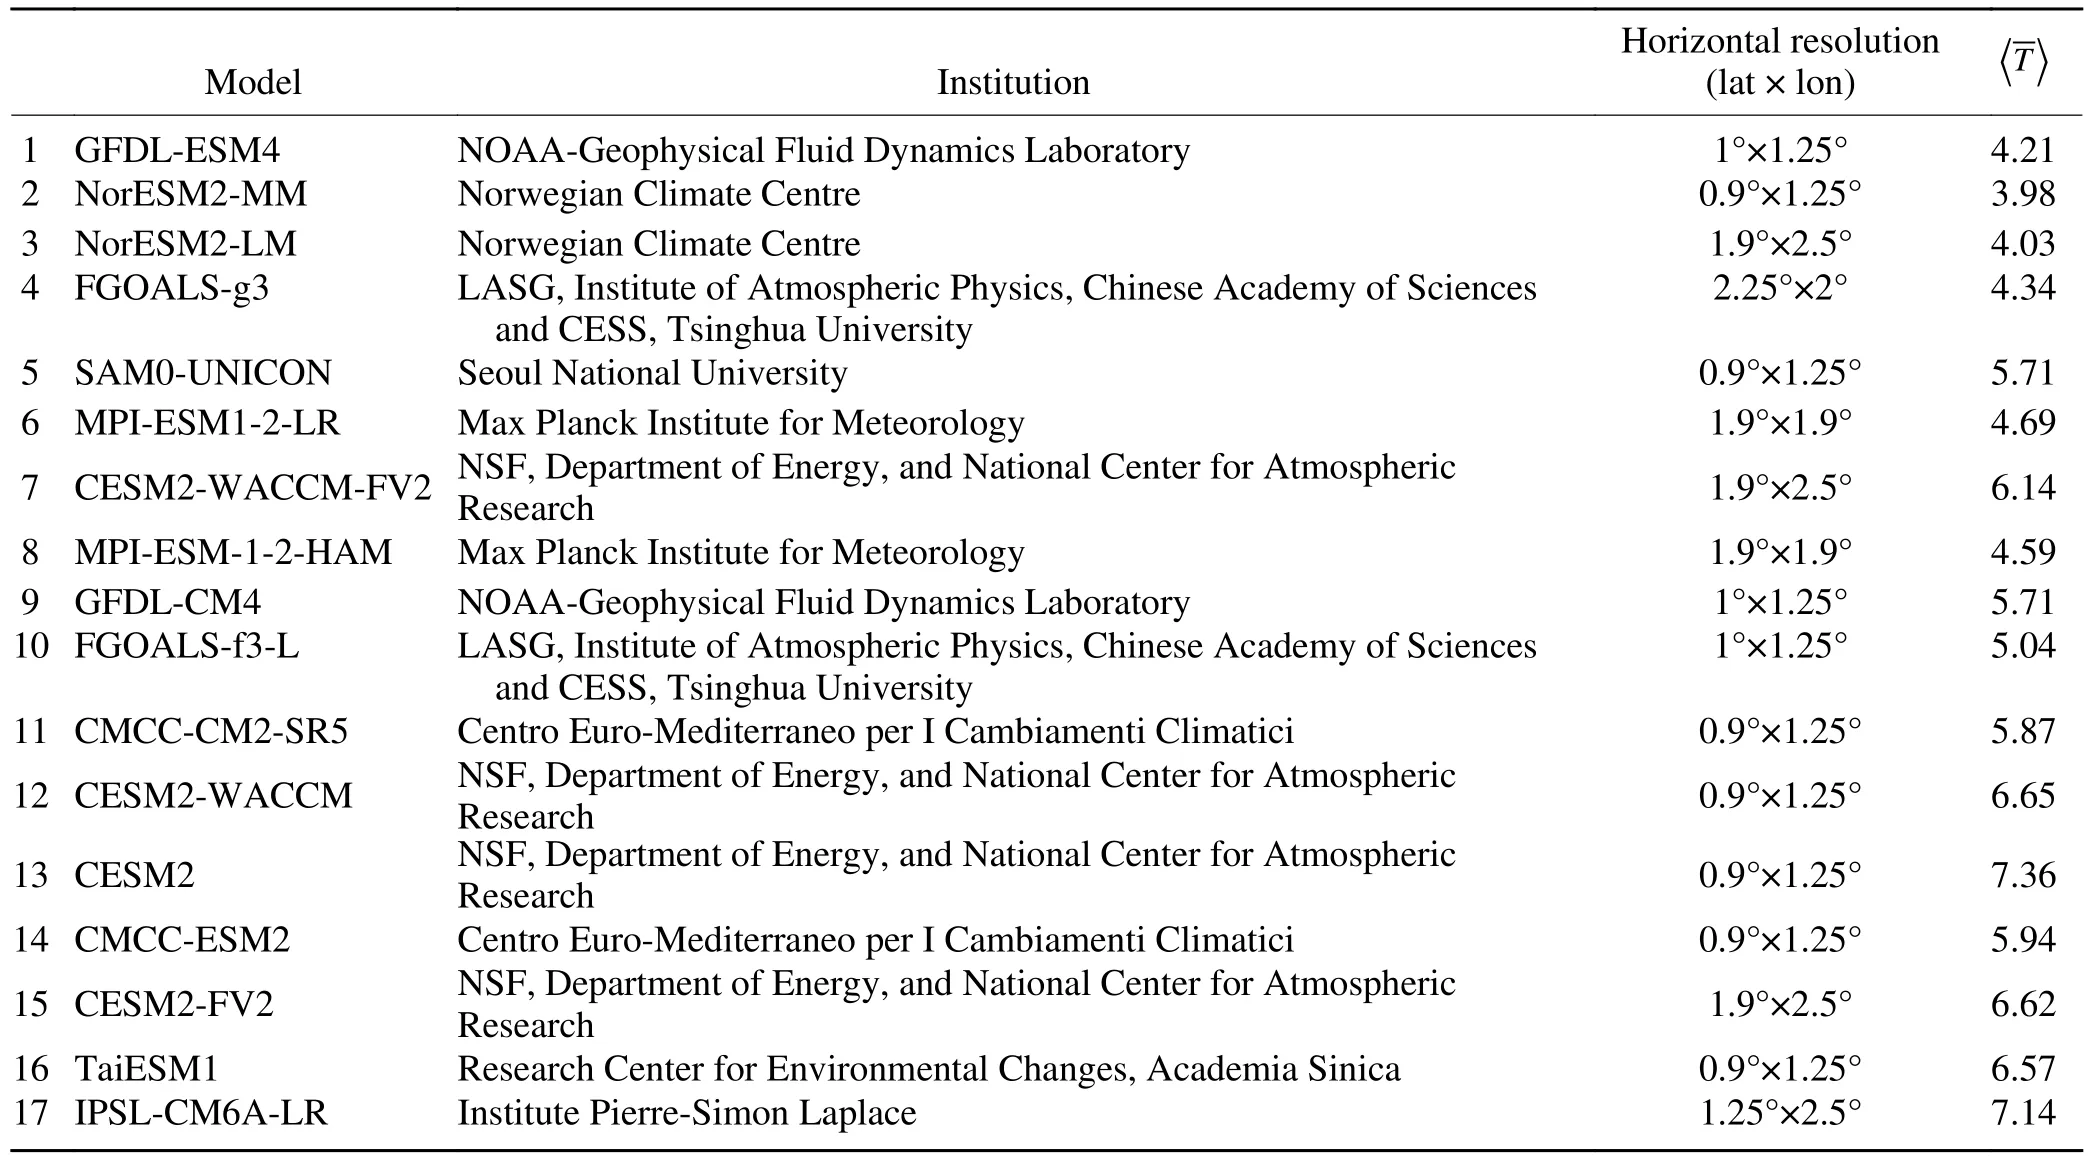
Table 1.A list of the CMIP6 models analyzed in this study and their horizontal resolutions of the atmospheric component.〈 T〉 denotes the global mean surface warming (K) simulated by each model.
To quantitatively evaluate the contribution of each radiative or non-radiative feedback process to Arctic surface warming and identify the main sources of its inter-model spreads,we applied the CFRAM analysis method to decompose the total Arctic surface warming over the four surface types(shown in Fig.3) into partial surface temperature changes(PTCs) due to individual external forcing and internal climate feedback processes.Based on the surface energy balance,the response of the surface temperature to quadrupled CO2( ∆T) can be decomposed as
where Δ stands for the response to CO2quadrupling as defined above; R represents the infrared longwave radiation within individual layers (related to temperature); S represents the absorbed shortwave radiation fluxes; Q represents the convergence of total energy due to the atmospheric and oceanic dynamic processes, as well as the heat storage in the ocean and land; LH and SH indicate surface turbulent latent and sensible heat transfer from the surface to the atmosphere; T indicates the surface temperature; ( ∂R/∂T) is the Planck feedback matrix whose its j-th column corresponds to the vertical profile of changes in longwave radiative flux due to 1 K warming at the j-th level alone.The superscripts of the terms on the right-hand side denote the feedback processes, namely CO2for 4×CO2forcing, AL for albedo, WV for water vapor,CLD for cloud (including longwave and shortwave effects)feedbacks, ATM for atmospheric heat transport, SRF for surface heat storage and oceanic heat transport, and SH and LH for the surface sensible and latent heat fluxes, respectively.
Surface energy flux perturbations due to individual radiative processes are calculated by perturbing the corresponding variable in the radiative transfer model (Fu and Liou, 1992).The sum of surface energy flux perturbation due to non-radiative processesis estimated based on the energy balance between radiative and non-radiative processes.LH and SH are obtained directly from model simulation.Then, energy convergence due to the ATM and SRF terms can be calculated as the residual atmospheric and surface components in the non-radiative energy perturbation[see Hu et al.(2017) for details].Linearization and offline calculation may introduce errors in the decomposition.As shown in Fig.4, the error term is very small because shadings(the sum of PTCs) and contours (model simulated total temperature change) nearly resemble each other.
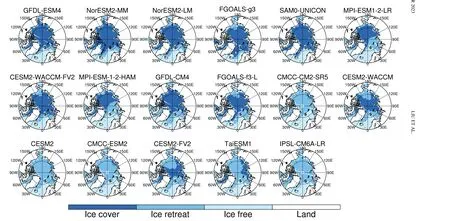
Fig.1.Spatial distributions of four surface types over 17 CMIP6 models.The four surface types include ice-covered regions (sea-ice concentration >15% in PI experiments and Abrupt-4×CO2experiments), ice-retreat regions (sea-ice concentration >15%inPIexperiments and sea-ice concentration <15% in Abrupt-4×CO2 experiments), ice-free ocean (sea-ice concentration <15% in PIexperimentsand Abrupt-4×CO2 experiments), and land.

Fig.2.The box plots (from top to bottom: maximum, upper quartile, median, lower quartile, and minimum values separately; see y-coordinate) are given for the seasonal cycles of the multi-model ensemble mean of the sea-ice concentration (%) over ice-covered regions (left column), ice-retreat regions (middle column) and ice-free ocean(right column), simulated by PI experiments (a–c) and Abrupt-4 × CO2 experiments (d–f) over 17 CMIP6 models, (g,h) the changes in sea-ice concentration (ΔSIC) between Abrupt-4 × CO2 experiments and PI experiments over the three surface types.
According to Sejas and Taylor (2020), Hahn et al.(2022), and Hu et al.(2022), changes in effective heat capacity and thermal inertia due to sea-ice cover account for a large degree of the seasonality of Arctic surface warming.To examine the contribution to the term ∆TSRFfrom thermal inertial change, we calculate the effective thermal inertia (ETI) over the four surface types following Hu et al.(2022)
where < > stands for the areal mean of all grid points in the region of each surface type north of 60°N; Tsis the surface air temperature; Ceffcorresponds to the effective heat capacity of a given surface type.For ocean or sea-ice grid points, Ceffis defined as:
In Eq.(3),εmeans SIC (sea-ice concentration), which varies spatially and seasonally; Co(4187 J kg–1K–1) and CI(2108 J kg–1K–1) are the heat capacities of water and ice,respectively;ρo(1000 kg m–3) andρI(910 kg m–3) are the density of water and ice, respectively; Ho(30 m) and HI(1 m)approximately correspond to the mean depth of (mixedlayer) water and sea ice, respectively.We have confirmed that the seasonal patterns of Δ(ETI) for each of the 17 CMIP6 climate simulations are not sensitive to the choice of Ho(varying from 20–80 m) and HI(varying from 0.5–1.5 m).Therefore, we only report the results obtained with Ho= 30 m and HI= 1 m.Similarly, for land grids, Ceffis defined as,
In Eq.(4), CL(1180 J kg–1K–1in PI experiments and 1250 J kg–1K–1in abrupt-4 × CO2experiments) represent the heat capacity of land;ρL(1800 kg m–3) is the density of land; HL(0.2 m) corresponds to the approximate mean depth of the land surface layer.The change of ETI in response to the quadrupling CO2forcing is given by:
Again, Δ in Eq.(5) is the difference between the two equilibrium states; Δ(ETI) represents the heating rate caused by changes in effective heat capacity and the seasonal cycle of surface temperature.
Here, we wish to point out that the exclusion of the nonlinear term, ∆ (-(∂
3.Results
3.1.Multi-model ensemble mean
Figure 3 shows the spatial distribution of annual mean MME Arctic surface warming (Figs.3a–d) and zonal mean of the seasonal cycle of MME Arctic surface warming(Figs.3e–h) over the four surface types: ice-covered region,ice-retreat region, ice-free region, and land.The number of models for each type to calculate the annual mean warming is given in Figs.3i–l.Driven by a quadrupled CO2concentration, the MME of the global mean warming value is 5.56 K.The AA phenomenon exists throughout the Arctic, except for the ice-free region.Correspondingly, the seasonal pattern of Arctic warming–maximum warming in winter and weak warming in summer–also occurs in all regions except for ice-free regions.The ice-retreat region has the strongest warming and the largest seasonal contrast of AA.All of these features are consistent with previous studies (Boeke and Taylor,2018; Dai et al., 2019; Sejas and Taylor, 2020; Taylor et al.,2022).Next, we aim to find the key processes responsible for the differences in magnitude of surface warming over the various surface types.
Figures 4 and 5 show the zonal mean of the MME of the CFRAM-based partial temperature changes due to individual climate feedback processes over the four surface types.It turns out that PTCs due to ice-albedo feedback (∆TAL,Figs.4a–d), surface heat storage (∆TSRF, Figs.4e–h) and the upward surface turbulent sensible and latent heat fluxes(∆TSH+LH, Figs.4i–l) are the three most important factors for shaping the seasonal cycle of surface warming over the Arctic area, except for ice-free regions where the ice-albedo feedback (∆TAL, Fig.4c) is nearly negligible.The partial temperature changes due to the reduction of upward surface turbulent sensible and latent heat fluxes contribute positively to surface warming throughout the year over the ice-free region.In contrast, oceanic heat storage always suppresses the warming.Unlike over the ice-free region, the partial temperature changes due to oceanic heat storage feedback, cloud longwave feedback, and atmospheric dynamic feedback are the three main positive contributors to the warming in cold months over the sea-ice region, whereas the increase of upward surface turbulent sensible and latent heat fluxes act to suppress the warming.The partial temperature changes due to ice-albedo feedback, the upward surface turbulent sensible and latent heat fluxes feedback, and the water vapor feedback are the leading contributors to the summer warming, while the negative oceanic heat storage opposes the warming over the sea-ice region.The surface warming over the land region has a similar seasonal pattern as the sea-ice region.The ice-albedo feedback and the surface heat storage term over land are relatively weak.The change in the upward surface turbulent sensible and latent heat fluxes leads to surface cooling over land.The seasonal patterns of the partial temperature changes caused by other feedback processes over the land regions are consistent with their counterparts over the sea-ice region.
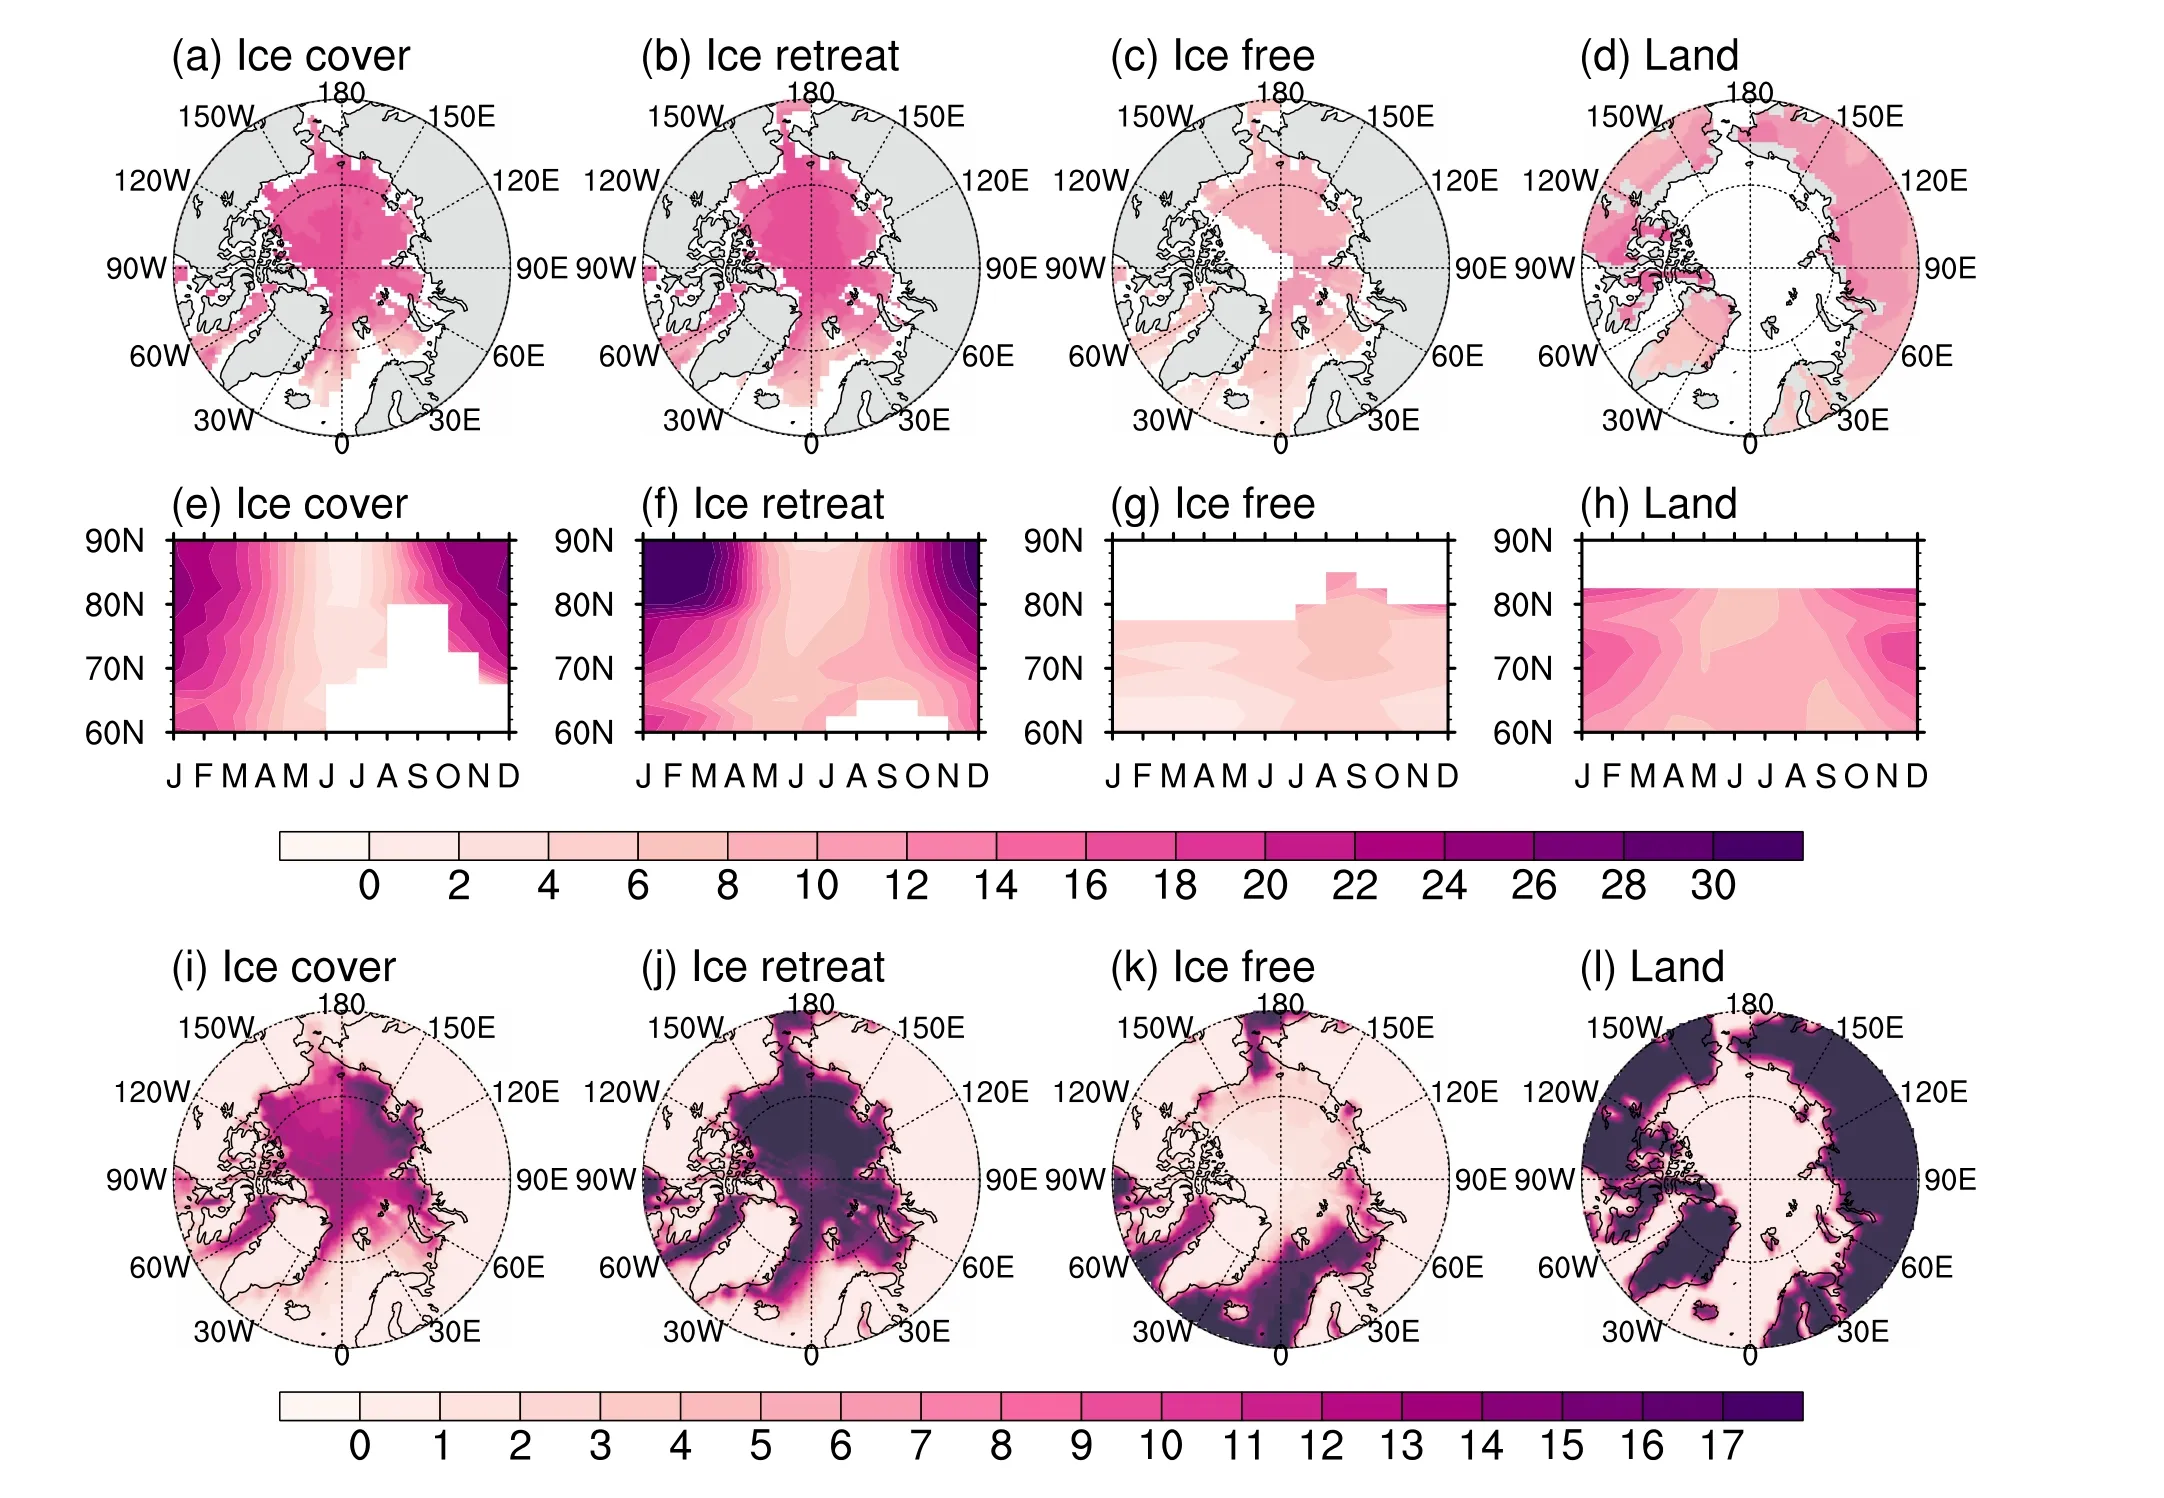
Fig.3.Spatial distributions of the MME annual mean of surface warming (K, top row), the seasonal cycles of the MME zonal mean of surface warming (K, middle row) simulated by CMIP6 Abrupt-4 × CO2 experiments of the 17 models listed in Table 1, and the number of models used to create the surface type averages (bottom row) within each grid box in Figs.3a–d.The four columns from left to right are for gridpoints characterized as ice-covered, ice-retreat, ice-free-ocean, and land-only,respectively.
Figure 6 shows the change of ETI as calculated from the difference between abrupt-4 × CO2and pre-industrial experiments of 17 CMIP6 models.Positive Δ(ETI) indicates that the heating effects caused by changes in effective heat capacity influence the seasonal cycle of surface temperature and vice versa.It is seen that the ice-retreat and ice-covered region, under a condition of more sea-ice loss (Figs.2g–i),has a large Δ(ETI) relative to the ice-free and land regions.As sea ice melts, sea-ice-covered ocean transitions to open ocean, increasing the effective heat capacity and ETI.The greater the ETI is, the slower the summer warming and the greater the warming in cold months.This explains the pronounced seasonal asymmetry of AA over sea-ice regions.The weak warming over the ice-free region is related to the large ETI of the ocean rather than the change in ETI, as there is a small (Δ(ETI)) over the ice-free region.Our results indicate that the change of ETI is the main factor responsible for the SET mechanism that amplifies the seasonal asymmetry of AA, and the different surface types will affect AA through the magnitude of ETI changes.
3.2.Inter-model spread
The spatial distribution and zonal mean of the standard deviation of Arctic warming simulated by the 17 models departures from the MME are shown in Fig.7.The ice-free region has a weak inter-model uncertainty in all months,while the other three regions present stronger inter-model differences, with their maximum differences occurring in winter, especially in the January-February-March (JFM)months over the ice-covered region, suggesting that the model uncertainty is largely related to sea ice.The source of inter-model spreads can be identified by the PTCs associated with various climate feedback processes obtained from CFRAM decomposition.Figure 8 displays the zonal mean of the inter-model spreads of the partial temperature changes due to the ice-albedo feedback, the surface heat storage term, and the upward surface turbulent sensible and latent heat fluxes, noting that these represent the main sources of inter-model spreads.The maximum JFM intermodel difference over the ice-covered region is mostly caused by the oceanic heat storage term and the upward surface turbulent sensible and latent heat fluxes.In summary,the ice-albedo feedback and surface heat storage term are the main contributors to the inter-model spread in warm seasons.

Fig.4.Seasonal cycles of the multi-model ensemble mean of the zonal mean of partial surface temperature changes (K) due to individual processes as a function of latitude (ordinate) and time (month, abscissa) for the four surface types.The four columns from left to right are for ice-covered grid points, ice-retreat grid points, ice-free ocean grid points, and land-only grid points, respectively, (a–d) due to changes in ice albedo, (e–h) due to changes in surface heat storage and oceanic heat transport, (i–l) due to changes in sensible and latent heat fluxes at the surface, and (m–p) the sum of partial surface temperature changes.The contours in (m–p) are the results shown in Figs.3e–h.The close agreement between the shadings and contours in (m–p) indicates a robust CFRAM-based decomposition of the (total) surface warming.
Next, we investigate the contributions of PTCs to the inter-model spread in Arctic warming for the four surface types.Figure 9 provides an overview of the inter-model spreads of the annual mean Arctic surface warming and the PTCs due to various climate feedback processes over the four surface types.Figures 9a and 9c (boxplots, left-column)show that the inter-model spread in the annual mean Arctic surface warming over the ice-covered region (Fig.9a) is similar to that over the ice-retreat region (Fig.9c).The annual warming over the ice-free region shows the smallest intermodel spread (Fig.9e).
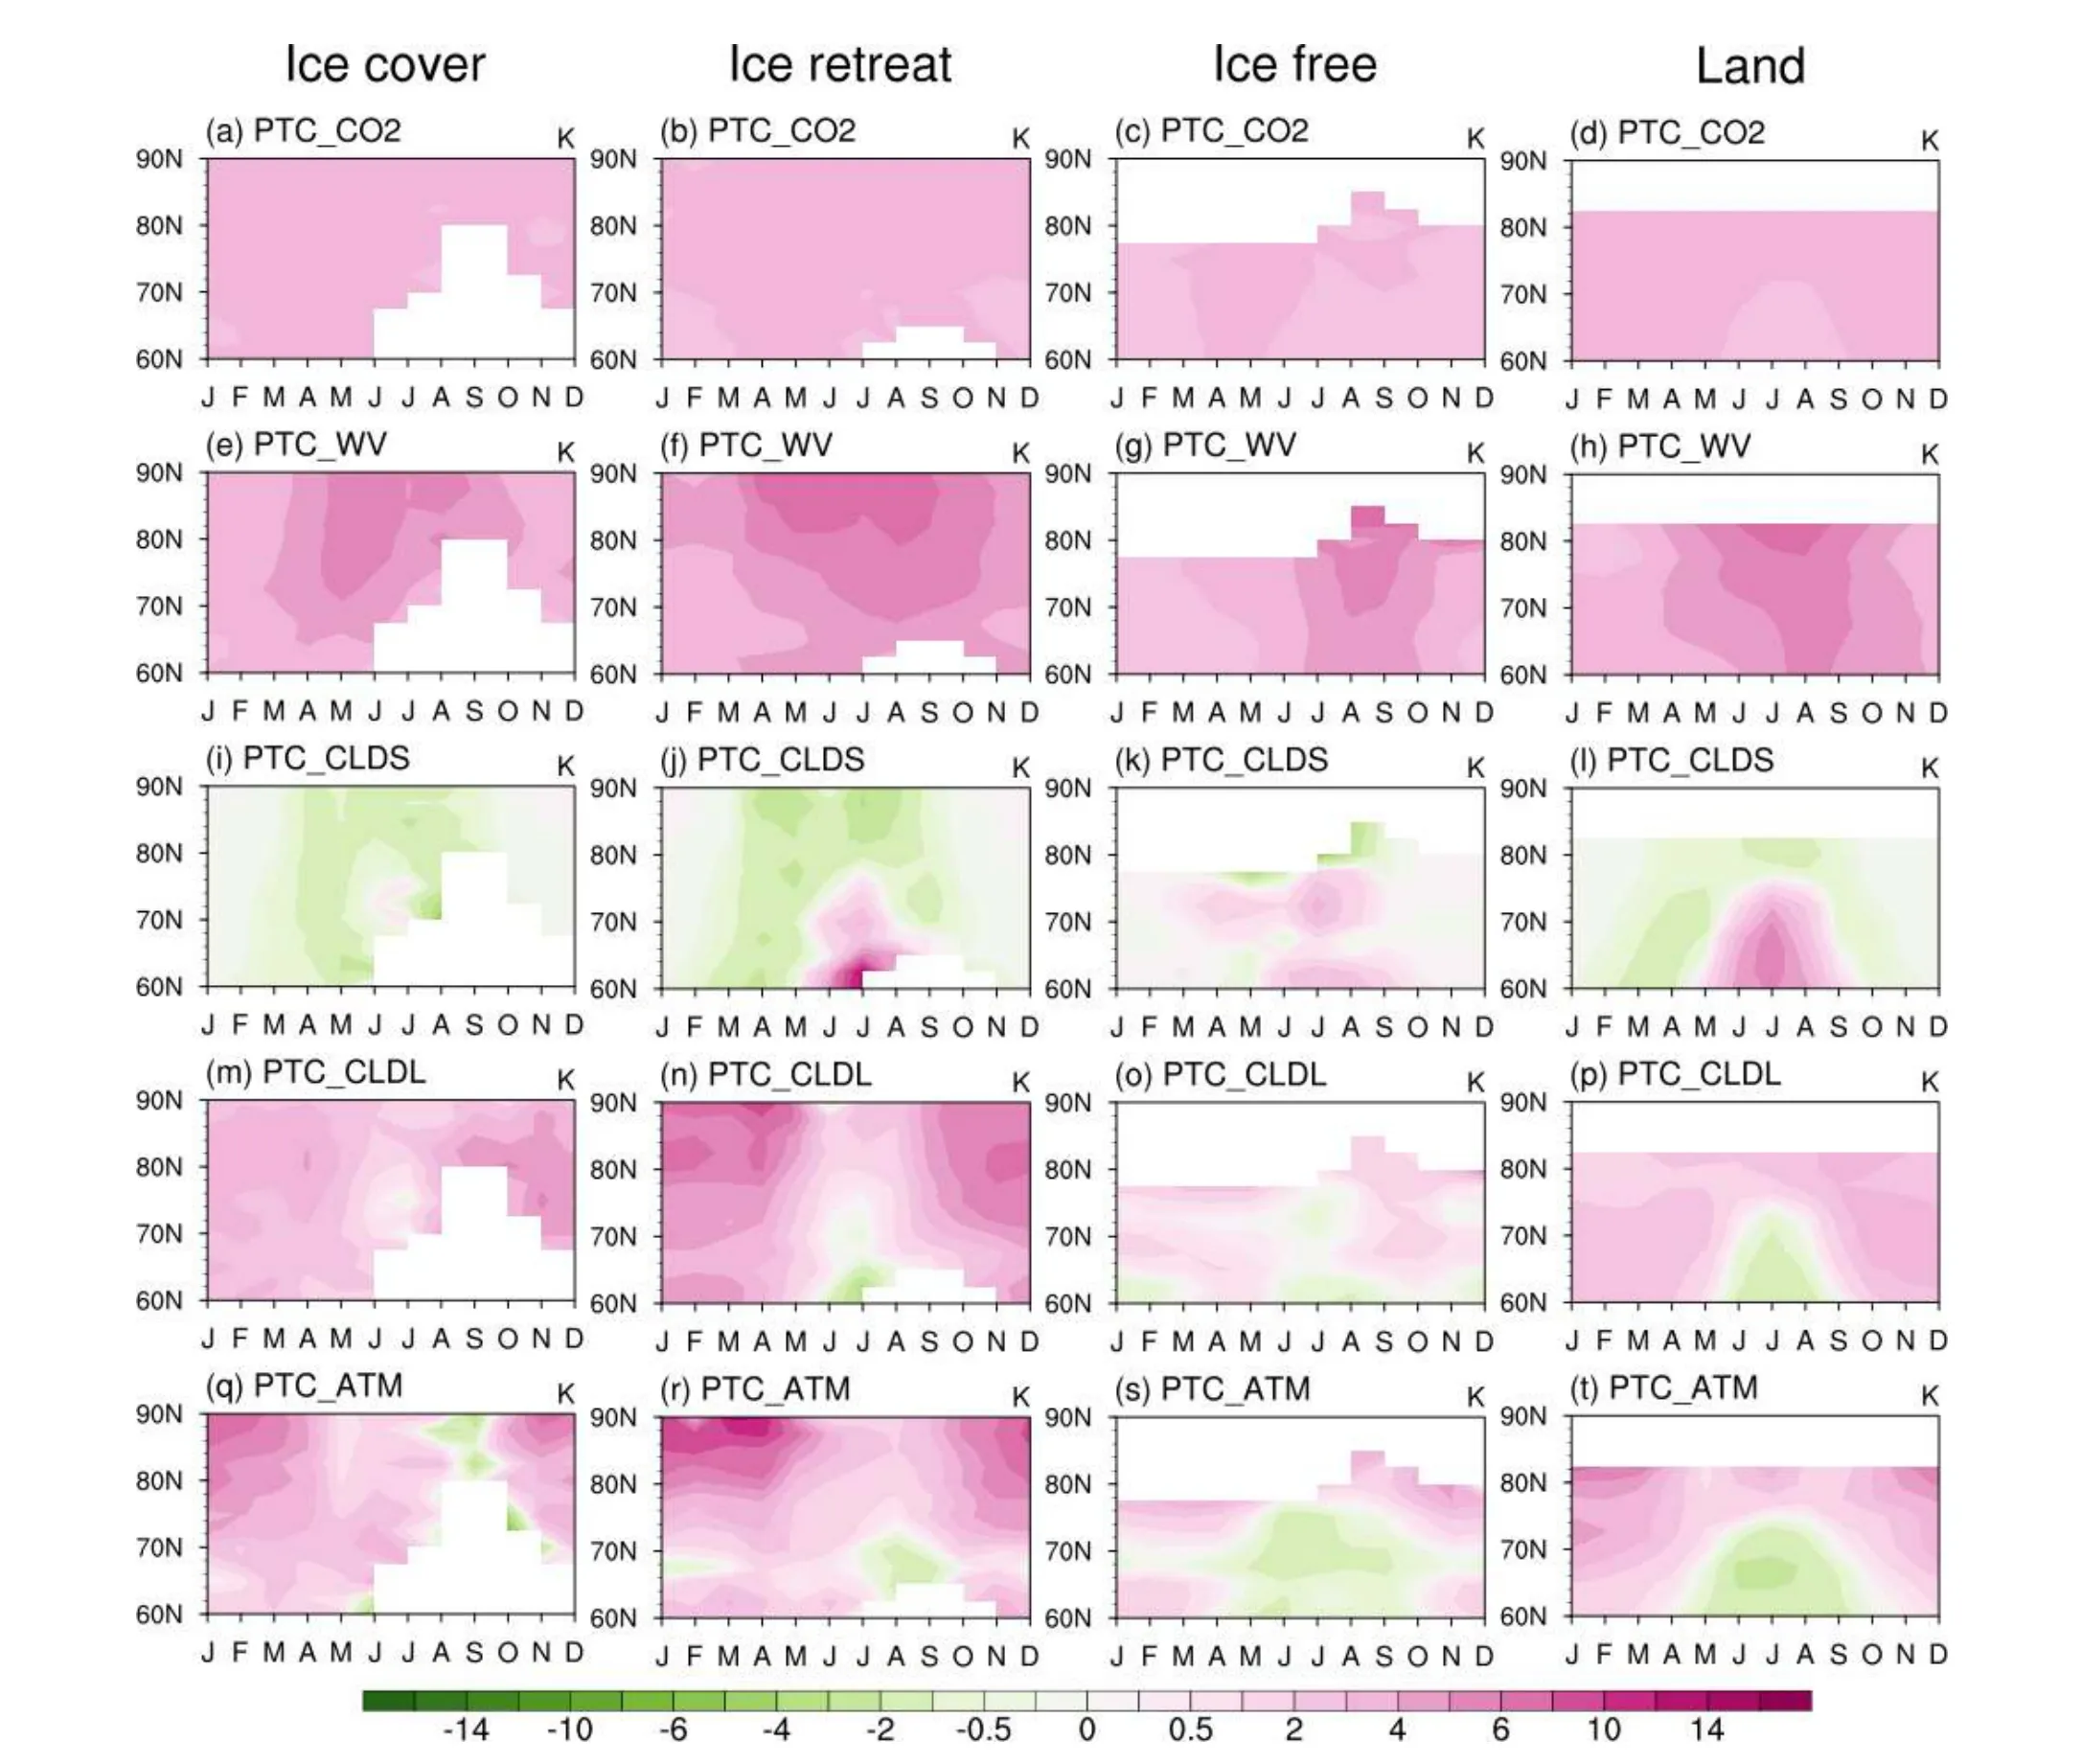
Fig.5.Seasonal cycles of the multi-model ensemble mean of the zonal mean of partial surface temperature changes (K) due to other processes not presented in Fig.4.
Given the dominant role of the ice-covered region in contributing to the warming spread in JFM, we first discuss the sources of warming spread over the ice-covered region.As shown in Fig.9a, the ice-albedo feedback induces the maximum annual warming (9K), and its inter-model difference is also the largest (about 12K).The spread in the albedo feedback term is significantly and positively correlated with the spread in total warming (Table 2, r=0.67), suggesting the dominating role of albedo feedback in contributing to the spread in total warming (Fig.9b).The oceanic storage term contributes a weaker surface annual mean warming (3K),yet its difference among the models is notable (about 10K),almost as large as that of ice-albedo feedback.However, the positive correlation between the spreads in total warming and the PTC_SRF term (r=0.52) is weaker than that between total warming and the PTC_AL term.The enhancement of the upward surface turbulent sensible and latent heat fluxes act to suppress the annual mean surface warming.Their inter-model spreads are significantly and negatively correlated with the spread of the Arctic annual warming.It is to be expected that models with stronger warming would also have stronger damping effects from the LH and SH terms (Fig.9b).The atmospheric dynamic term also contributes to the inter-model spread in the Arctic warming(about 3K in terms of MME) and its spread positively correlated with the spread in total Arctic warming (r=0.68).The longwave cloud feedback also contributes to the annual mean warming, but its spread is not well correlated with the inter-model spread in total surface warming.The contributions from the rest of the feedback processes only slightly influence the inter-model differences.These include water vapor feedback, shortwave cloud feedback, and CO2forcing.Larger spreads in the ice-albedo feedback and oceanic heat storage term suggest that improvements in simulating snow/ice coverage, mixed layer thickness, and oceanic downward heat diffusivity are important for narrowing the differences in future Arctic surface warming projections.From the combination of Fig.9b, Fig.8b, and Fig.1, it can be deduced that models with more sea-ice loss more significantly deviate from the MME, further proving the importance of improving the forecast skill of sea-ice coverage simulation to decrease the inter-model spread.
Over the ice-retreat region, contributions of individual terms to the spread in total Arctic warming share similar features with those over the ice-covered region, except for the SRF term (Figs.9c, d).PTCs due to the SRF term show a larger inter-model spread than that over the ice-retreat region, which is consistent with a larger spread in Δ(ETI)than that over the ice-covered region (Fig.6b vs.Fig.6a).The small ice-albedo feedback over the ice-free region contributes to the Arctic warming, resulting in the weakest annual warming among the four surface types (Fig.9e).There is a large cancellation between the SRF term and LH +SH term, despite their large magnitudes (Fig.9f); these three terms are poorly correlated with the inter-model spread in the total surface warming.Over the land, amplitudes of all PTCs, as well as their inter-model spread, are smaller than the corresponding terms over the ocean (Fig.9g).PTCs due to the water vapor feedback and surface heat storage are significantly and positively correlated with the spread in annual mean total warming.Other terms do not show a correlated relationship with total warming.
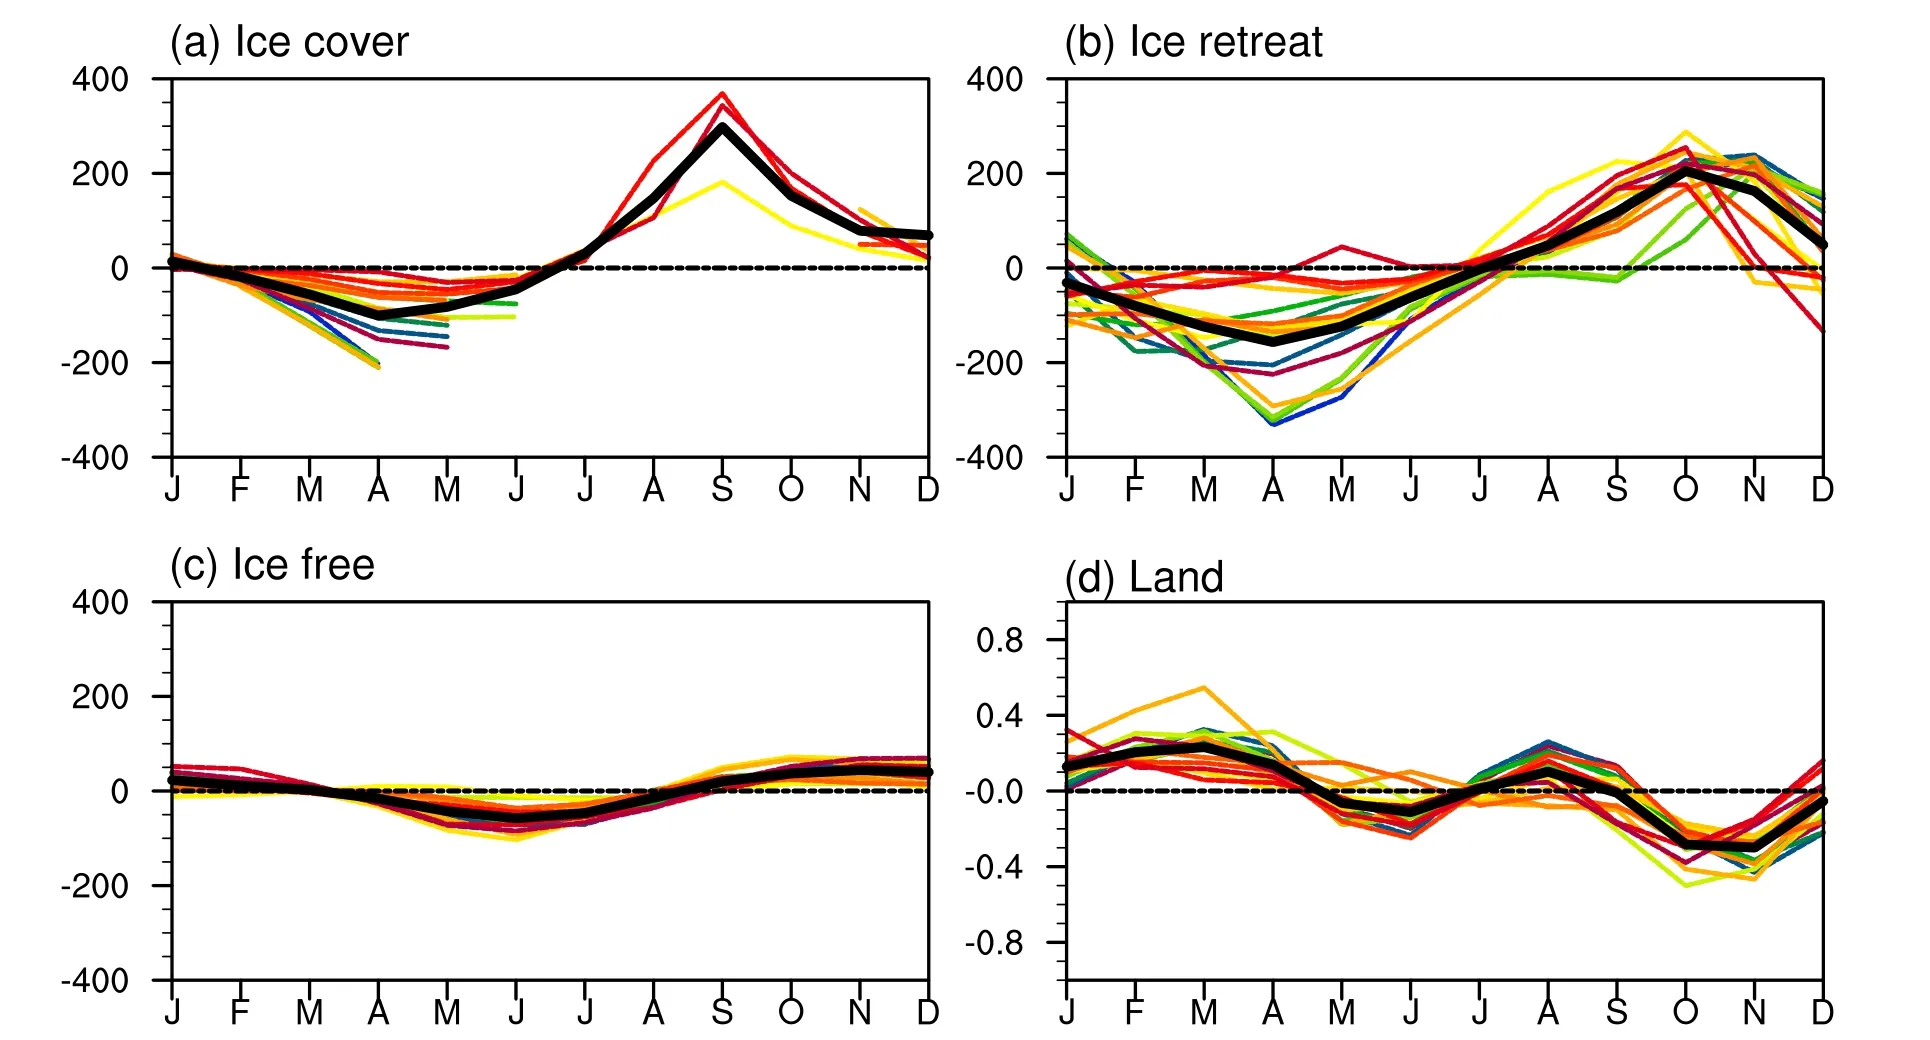
Fig.6.Seasonal cycle response of the effective thermal inertia (Δ(ETI)) in units of W m–2, Δ(ETI), to the quadrupling CO2 forcing for individual models (color lines) and their MME mean (thick black line), over (a) icecovered regions, (b) ice-retreat regions, (c) ice-free ocean, and (d) land.
4.Conclusion
In this study, we discussed the surface type dependence of the seasonality and inter-model spread in AA simulated in the abrupt-4 × CO2experiments of 17 CMIP6 climate models using the climate feedback-response analysis method(CFRAM).The Arctic is divided into four surface types: icecovered region, ice-retreat region, ice-free region, and land.Our findings indicate that the magnitude and seasonal pattern of AA are sensitive to surface types, whose characteristic distribution is mainly caused by the SET mechanism.The SET mechanism is sensitive to the differences in the change of ETI in response to the quadrupling of carbon dioxide forcing.
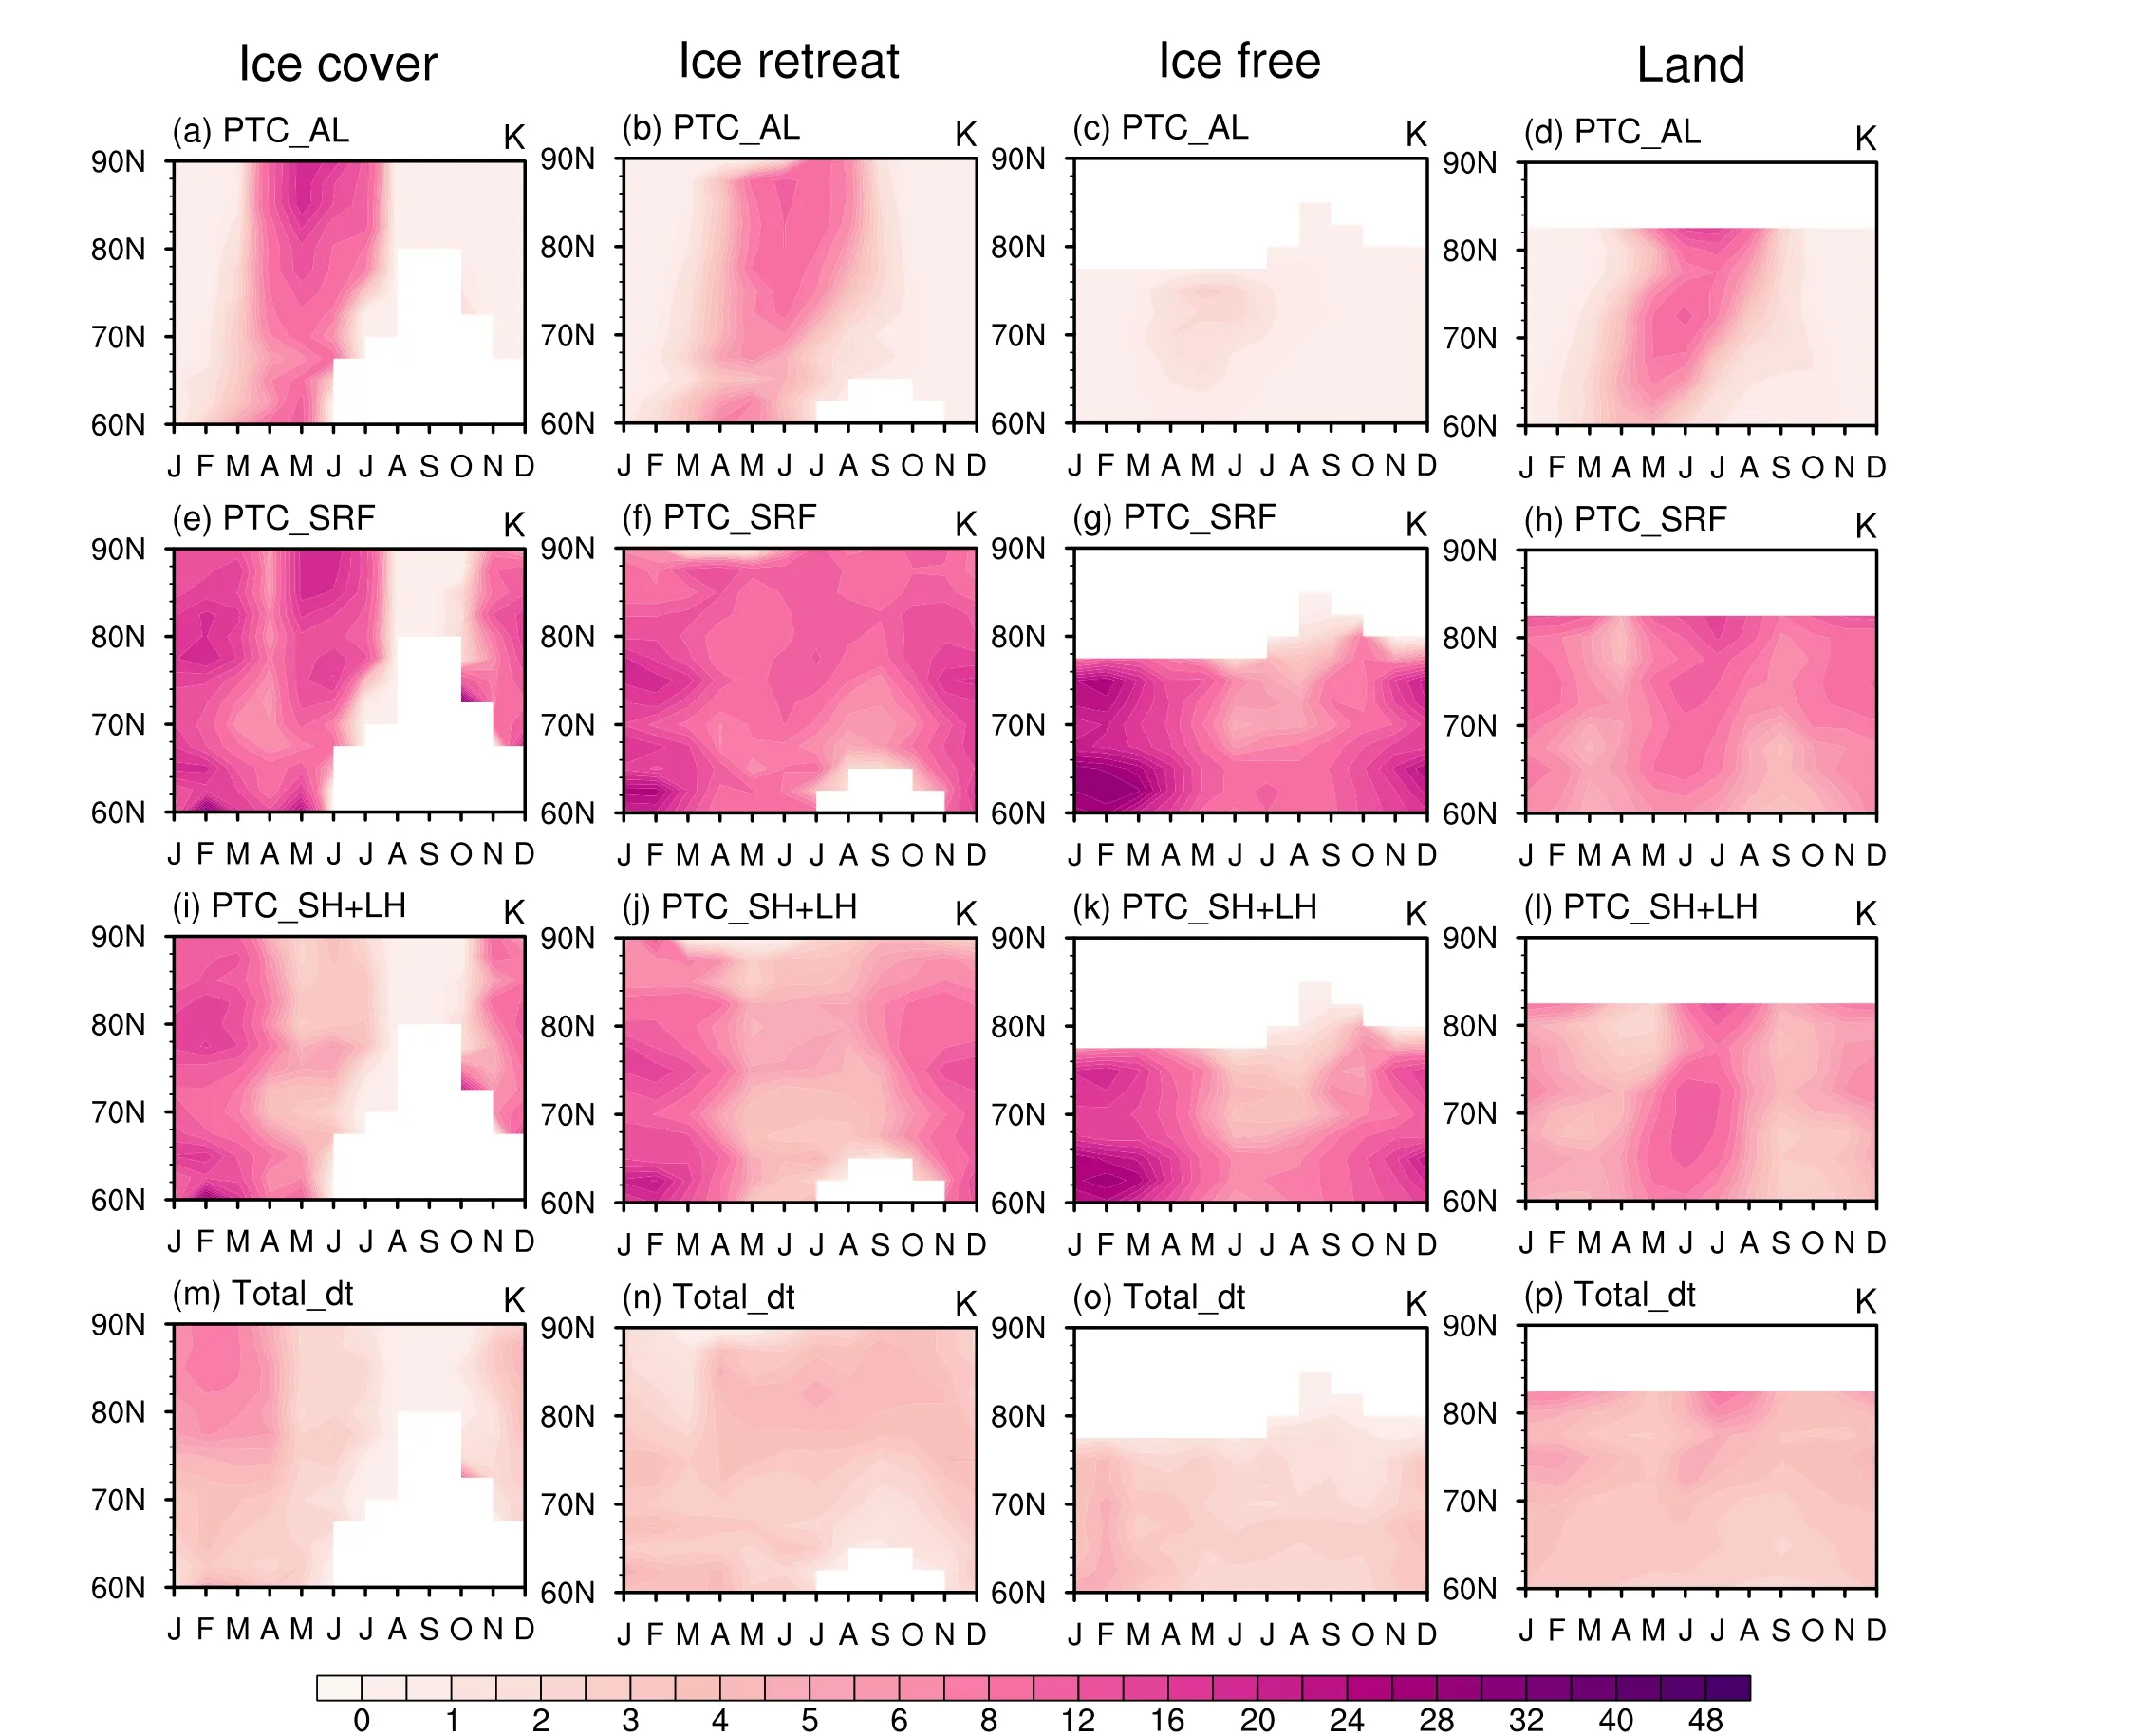
Fig.8.As in Fig.4, but for the standard deviation of inter-model spreads of partial temperature changes (K) due to individual processes.
All of the regions present pronounced AA, but their magnitude and seasonality differ depending on surface types.The ice-covered region, ice-retreat region, and land exhibit maximum winter warming with a strong annual pattern,while the sea-ice-free region has weaker and seasonally uniform warming (Fig.3).Upward surface turbulent sensible and latent heat fluxes act to dampen the surface warming as well as its inter-model spread, playing a major role in the relative uniform warming of the ice-free region (Fig.4).Compared to the ice-free region, the surface heat storage term,via an increased ETI, partially cancels out the heating accompanied with ice melting in summer and transfers it in winter,leading to the strong AA in cold months.We have calculated the changes of effective thermal inertia, Δ(ETI), for different surface types in the Arctic (Fig.9).The result proves that Δ(ETI) amplifies Arctic seasonal warming by suppressing summer warming and amplifying winter warming in sea-ice regions.Therefore, the largest sea-ice loss and the maximum change of ETI occur in the ice-retreat region, which also shows the most significant seasonal contrast of AA.
There are large inter-model spreads of the CMIP6’s Arctic surface warming over the ice-covered region, especially in January, February, and March (JFM) (Fig.6).We found that the strong oceanic heat storage term is the main source of the largest inter-model spread in JFM over the ice-covered region.Partial temperature changes due to ice-albedo feedback have the largest inter-model spread in summer, while those due to the upward surface turbulent sensible and latent heat fluxes tend to offset the inter-model spreads.We conclude that surface type plays a key role in the seasonality and inter-model spreads in AA by the combined effect of the SET mechanism and the change of ETI.
This study sheds light on the surface-type dependence of local feedback processes and total Arctic surface warmingdriven by an increase in CO2concentration, which may help to reduce model projection uncertainty.Moreover, significant bias exists in the model simulations of surface warming in the Arctic.This study may also help to understand the source of the modeling bias in the Arctic.Since our analysis relies entirely on climate model output, it would be useful to research the surface-type dependence of the behaviors of these feedbacks based on observations.

Table 2.Cross-model correlation coefficients between the total annual mean Arctic surface warming and PTCs over four surface types.The bold font denotes the correlation coefficients that are statistically significant at the 99% confidence level.
Acknowledgements.We are grateful for the editor and the insightful comments and constructive suggestions of two anonymous reviewers that led to significant improvements in the presentation.This study was supported by the National Natural Science Foundation of China (Grant No.41922044), the National Key Research and Development Program of China (Grants Nos.2019YFA0607000, 2022YFE0106300), the National Natural Science Foundation of China (Grants Nos.42075028 and 42222502),Southern Marine Science and Engineering Guangdong Laboratory(Zhuhai) (Grant No.SML2021SP302), and the fundamental research funds for the Norges Forskningsråd (Grant No.328886).All data used in this study are derived from model simulations produced by the Coupled Model Intercomparison Project Version 6(CMIP6), which are archived and freely accessible at https://www.wcrp-climate.org/wgcm-cmip/wgcm-cmip6.
杂志排行
Advances in Atmospheric Sciences的其它文章
- The Arctic Sea Ice Thickness Change in CMIP6’s Historical Simulations※
- The Influence of Meridional Variation in North Pacific Sea Surface Temperature Anomalies on the Arctic Stratospheric Polar Vortex※
- A Parameterization Scheme for Wind Wave Modules that Includes the Sea Ice Thickness in the Marginal Ice Zone※
- Evaluation of the Arctic Sea-Ice Simulation on SODA3 Datasets※
- Simulations and Projections of Winter Sea Ice in the Barents Sea by CMIP6 Climate Models※
- Arctic Sea Level Variability from Oceanic Reanalysis and Observations※
