Arctic Sea Level Variability from Oceanic Reanalysis and Observations※
2023-12-26JinpingWANGandXianyaoCHEN
Jinping WANG and Xianyao CHEN*,2
1Frontier Science Center for Deep Ocean Multispheres and Earth System, Key Laboratory of Physical Oceanography,Ocean University of China, Qingdao 266100, China
2Laoshan Laboratory, Qingdao 266237, China
ABSTRACT Quantifying the contributions to Arctic sea level (ASL) variability is critical to understand how the Arctic is responsing to ongoing climate change.Here, we use Ocean Reanalysis System 5 (ORAS5) reanalysis data and tide gauge and satellite altimetry observations to quantify contributions from different physical processes on the ASL variability.The ORAS5 reanalysis shows that the ASL is rising with a trend of 2.5 ± 0.3 mm yr-1 (95% confidence level) over 1979–2018,which can be attributed to four components: (i) the dominant component from the global sea level increase of 1.9 ± 0.5 mm yr-1,explaining 69.7% of the total variance of the ASL time series; (ii) the Arctic Oscillation–induced mass redistribution between the deep central basin and shallow shelves, with no significant trend and explaining 6.3% of the total variance; (iii)the steric sea level increase centering on the Beaufort Gyre region with a trend of 0.5 ± 0.1 mm yr-1 and explaining 29.1%of the total variance of the ASL time series; and (iv) the intrusion of Pacific water into the Arctic Ocean, with no significant trend and contributing 14.2% of the total ASL variability.Furthermore, the dramatic sea ice melting and the larger area of open water changes the impact of the large-scale atmospheric forcing on the ASL variability after 1995, and the ocean dynamic circulation plays a more important role in the ASL variability.
Key words: sea level variability, Arctic Ocean, sea level rise, steric sea level, global warming
1.Introduction
The Arctic sea level (ASL) has risen during recent decades in response to processes associated with global warming that have changed the atmospheric circulation, sea ice,and ocean temperature and salinity fields.It is important to understand the ASL change and its associated mechanisms and impacts on global climate, e.g., controlling stratification of the sub-Arctic oceans and modulating the strength of Atlantic Meridional Overturning Circulation (AMOC;Aagaard and Carmack, 1989; Proshutinsky et al., 2002;Wang et al., 2017).
The estimations of the ASL trend based on satellite altimeter are not consistent across different groups owing to the limited data availability in the Arctic Ocean.Carret et al.(2017) estimated the regional averaged sea level trend in the Arctic Ocean (66°–80°N) to be 2.10 ± 0.63 mm yr-1over 1992–2014, consistent with Cheng et al.(2015) over the region of 66°–82°N, but lower than the 3.6 ± 1.3 mm yr-1over 1993–2009 reported by Prandi et al.(2012) within 66°–82°N, which does not include data from the ICESat and CryoSat-2 missions.Satellite altimeter observations reveal that the largest trend of sea level rise is located in the Beaufort Gyre region where the linear trend can be as large as 15 mm yr-1(Proshutinsky et al., 2009; Farrell et al., 2012; Giles et al., 2012).The rapidly rising sea level in the Beaufort Gyre region can be explained by an accumulation of freshwater associated with enhanced anticyclonic circulation(Proshutinsky et al., 2002, 2009; Giles et al., 2012).Furthermore, Prandi et al.(2012) demonstrated that the rapid sea level rise during 1993–2009 in the Beaufort Gyre region is mainly due to the steric effect driven by the atmospheric anomaly related to the Arctic dipole pattern.
The Gravity Recovery and Climate Experiment(GRACE) satellite provides more spatially complete ocean mass observations across the Arctic Ocean, regardless of sea ice coverage.GRACE observations reveal coherent basin-wide mass changes across the deep Arctic basin,which can be related to the poleward mass transport into the Arctic Ocean driven by the meridional wind in the Nordic seas and the Bering Strait (Peralta-Ferriz et al., 2011, 2014;Volkov and Landerer, 2013; Volkov, 2014).Armitage et al.(2018) suggested that the Arctic Oscillation (AO) drives alongshore wind anomalies on the shallow continental shelf,and this wind forcing cross-shelf Ekman transport could cause opposite sea level variability between the shallow shelf areas and the deep central basin.
Before the satellite era, sparse tide gauge records measured sea level changes.Previous analyses of ASL back to the 1950s have been investigated only in areas close to the Norwegian and Russian coasts, where a reasonable number of tide gauges are available.Carret et al.(2017) and Svendsen et al.(2016) showed similar ASL trends of 1.58 ±0.23 mm yr-1(1958–2014) and 1.5 ± 0.3 mm yr-1(1950–2010) based on tide gauge observations.Furthermore, tide gauge records reveal that the ASL rise is accelerating, with a trend of 2.25 ± 0.26 mm yr-1since 1980 (Henry et al.,2012).Based on the tide gauge records located along the Russian coastline, Proshutinsky et al.(2001, 2004) found that the decadal sea level variability is strongly correlated with the AO index.However, over 2000–2006, the relations between tide gauge observed sea level and the AO become weaker, since the sea level rises rapidly while the AO index is in a steady low phase (Henry et al., 2012; Carret et al.,2017).Based on multiple ocean model simulations,Koldunov et al.(2014) indicated that the pronounced differences on decadal sea level variability between shallow shelf areas and the deep central basin are mostly determined by salinity variations, which is related to AO-driven cyclonic and anticyclonic atmospheric circulation.
Previous studies have attempted to explain the spatiotemporal ASL variability and its relations to the Arctic warming.This reflects the anthropogenic impacts on the internal Arctic climate variability through changing the mean state of the Arctic system (such as sea ice).However, such studies did not separate the ASL variability into contributions from global warming and internal variability.Using the European Centre for Medium-Range Weather Forecasts (ECMWF) Ocean Reanalysis System 5 (ORAS5; Zuo et al., 2019) dataset, satellite altimeter, and tide gauge observations, we explore sea level change in the Arctic Ocean (north of 65°N; Fig.1c)and quantify the relative contributions from each process to the total ASL variability.
The rest of the paper is organized as follows.In section 2, we introduce the data and methods used in this study.In section 3, we analyze the ASL variability over 1979–2018,attributing the ASL variability to different contributions and their associated dynamics.Section 4 summarizes the main results and conclusions.
2.Data and methods
2.1.Data
2.1.1.ORAS5 reanalysis
The ECMWF ORAS5 reanalysis provides a high-resolution ocean dataset starting in 1979 by assimilating a large number of observations.We use ORAS5’s global monthly sea level, surface wind stress, 3D temperature and salinity datasets on a 0.25° resolution for the period 1979–2018(Zuo et al.2019; https://www.ecmwf.int/en/forecasts/datas et/ocean-reanalysis-system-5).The ORAS5 reanalysis provides data on the global scale, including the Arctic Ocean,allowing the study of Arctic water exchanges with the global ocean.It assimilates satellite altimetry sea level observations starting in 1993 to enable an improved global mean sea level increase.Also, the assimilation of ocean in situ observations improves the sea level in the reanalysis owing to better representation of mesoscale dynamics with increased model resolution.
2.1.2.Tide gauge observations
Monthly tide gauge revised local reference records are available from the Permanent Service for Mean Sea Level(PSMSL; Holgate et al., 2013; https://www.psmsl.org/).We selected tide gauge stations according to the following two criteria: (1) north of 65°N; (2) missing months being less than 25% of the whole study period (1979–2018).After applying these criteria, 63 tide gauge stations were available from 1979 (Fig.1c).The tide gauge records comprise observations of regional sea level variability, including the response to the atmospheric loading (inverted barometer effects; Stammer, 2008).As the ORAS5 reanalysis simulates the sea level change without the inverse barometer effect (Zuo et al.,2019), here we remove the inverse barometer effect from the tide gauge observations.The sea level pressure (SLP)data located at the nearest grid point to the tide gauges is selected to calculate the local inverse barometer effect.
2.1.3.Satellite altimetry observations
We use the Archiving, Validation and Interpretation of Satellite Oceanographic data (AVISO) of sea level anomalies from January 1993 to December 2018 (https://www.aviso.altimetry.fr/en/data.html) at 0.25° resolution.The AVISO dataset provides sea level measurements over ice-free ocean.
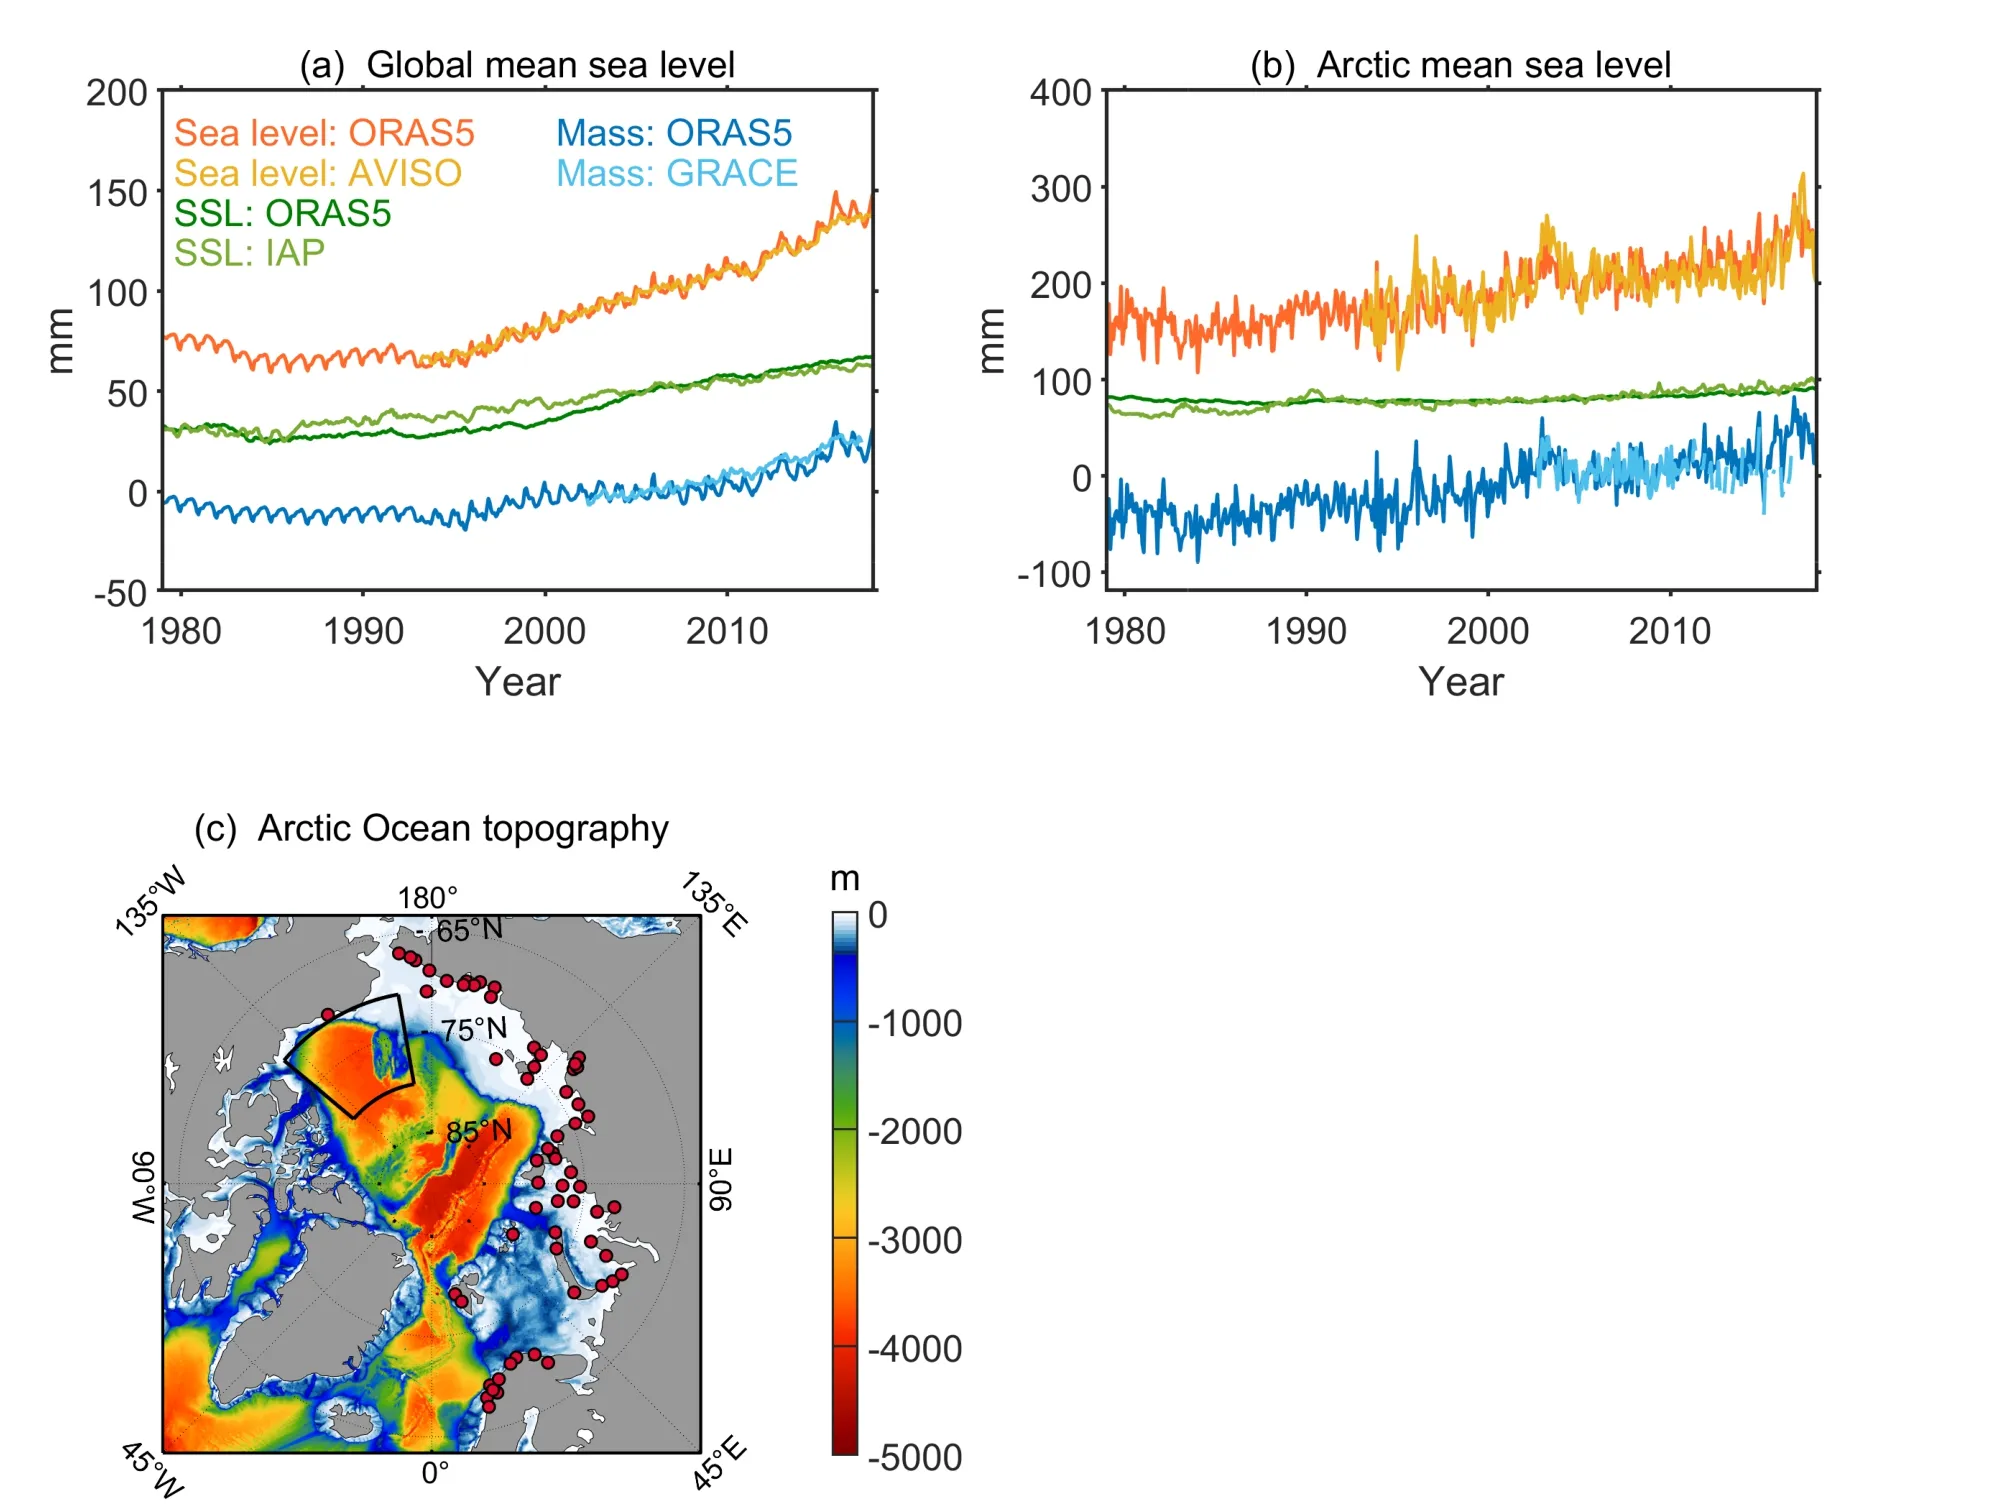
Fig.1.Area-averaged monthly time series over (a) the global ocean and (b) the Arctic Ocean (north of 65°N) for the total sea level (top), steric sea level (middle), and mass component (bottom), based on the ORAS5, AVISO, IAP, and GRACE datasets.(c) The topography in the Arctic Ocean (units: m).The red dots denote the tide gauge stations.The black frame in (c) denotes the Beaufort Gyre region (70°–80°N, 130°–170°W).
2.1.4.Atmospheric reanalysis data from ERA-Interim
We use the SLP from ECMWF’s ERA-Interim atmospheric reanalysis (Dee et al., 2011; https://apps.ecmwf.int/datasets/data/interim-full-moda/levtype=sfc/).The AO index data (Thompson and Wallace, 1998) are from the National Oceanic and Atmospheric Administration (NOAA)Earth System Research Laboratories (https://www.esrl.noaa.gov/psd/gcos_wgsp/Timeseries/AO/).The AO index is obtained by projecting the 1000 millibar geopotential height anomalies on the loading pattern of the AO, which is defined as the leading mode of the empirical orthogonal function (EOF) analysis of the 1000 millibar height anomaly over 20°–90°N.The monthly AO index is normalized and has a zero mean and standard deviation of one over the research period (1979–2018).
2.1.5.Profile data from EN4
The EN4 database was developed by the Met Office Hadley Centre (Good et al., 2013; http://www.metoffice.gov.uk/hadobs/) and provides in situ quality controlled ocean profiles starting from 1900.In this study, we only use the information on the position of each temperature profile to show the evolution of the observation coverage in the Arctic Ocean.
2.1.6.Steric sea level
The Institute of Atmospheric Physics (IAP), Chinese Academy of Sciences (Cheng et al., 2017), provides gridded steric sea level estimates above 2000 m since 1940 (http://159.226.119.60/cheng/).The large quantities of ocean in situ observations from the NOAA National Centers for Environmental Information (Boyer et al., 2013) and Argo observations are included to reconstruct the global steric sea level change.
2.1.7.Ocean mass observations from GRACE
We use GRACE observations from the Jet Propulsion Laboratory (https://podaac.jpl.nasa.gov/dataset/TELLUS_GRAC_L3_JPL_RL06_OCN_v04), which is derived from GRACE and GRACE-FO gravity measurements (Landerer and Swenson, 2012).
2.1.8.Volume transport observations through the Bering Strait
We use the northward volume transport observations through the Bering Strait provided by the University of Washington Applied Physics Laboratory (Woodgate, 2018; http://psc.apl.washington.edu/HLD/).The monthly mean volume transport is estimated by mooring observation A3 located in the central Bering Strait.Previous studies indicate the northward velocity observed at site A3 is a good proxy of the total volume transport due to the strong barotropic and homogeneous Bering Strait inflow (Woodgate et al., 2012, 2015).
2.2.Methods
2.2.1.Sea level components
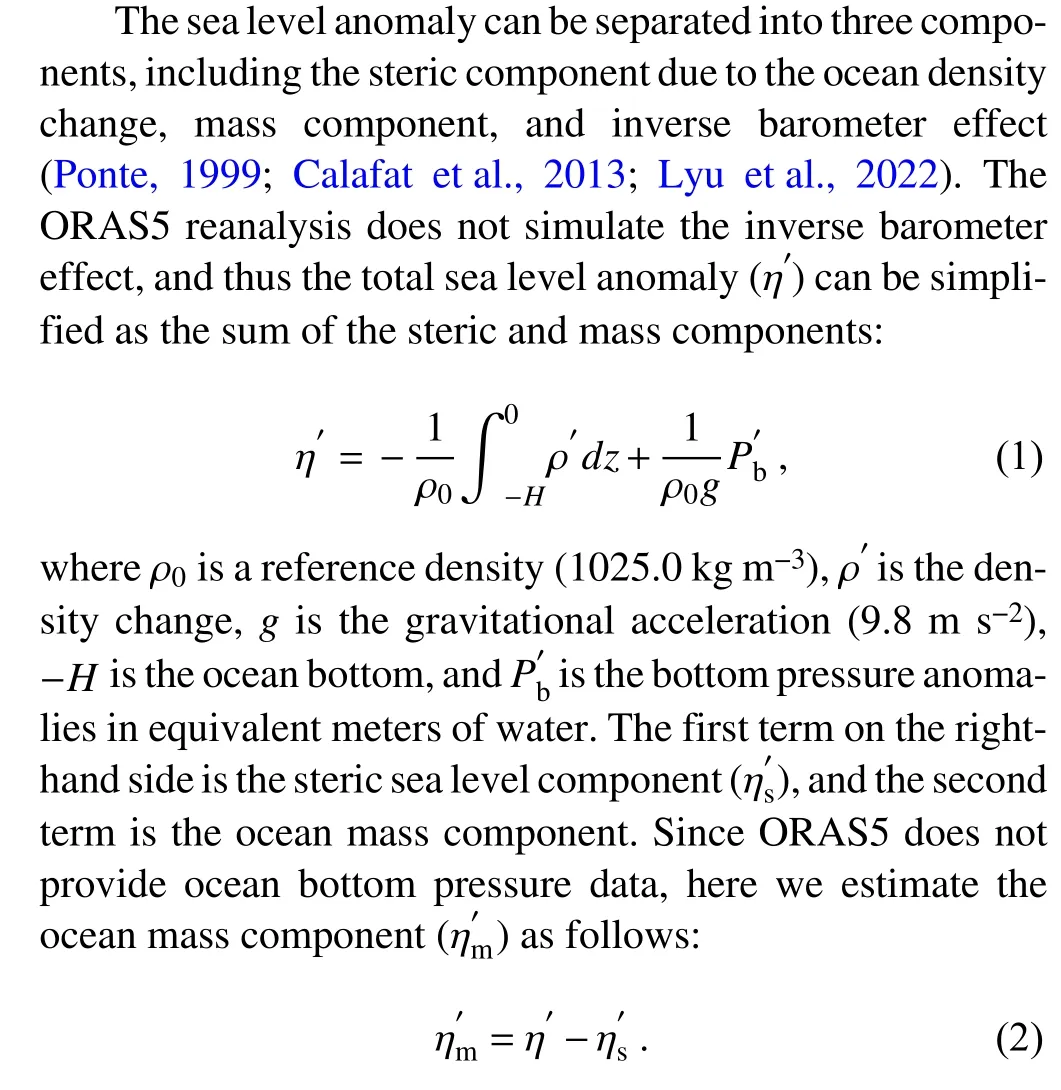
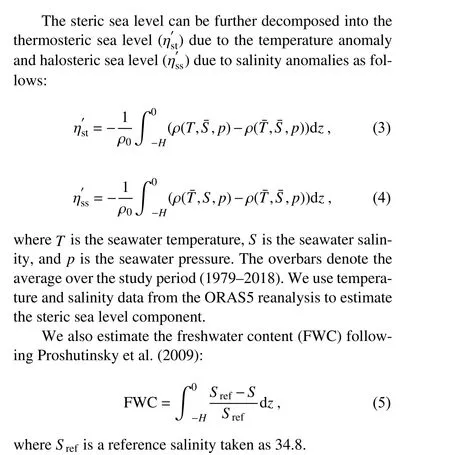
2.2.2.Pairwise-rotated EOF analysis
To investigate the spatiotemporal sea level variability in the Arctic Ocean, EOF analysis is performed on the ASL change over the period 1979–2018.To focus on the regional sea level variability in the Arctic Ocean, we use the sea level departure fields (hereafter denoted as SSH*; Chen et al., 2017a), which is derived by removing the global areaweighted mean sea level time series at each grid point.The SSH* fields present the Arctic regional sea level change due to local dynamics (Fig.2).The leading three EOFs and the corresponding principal component (PC) time series are shown in Fig.3, which account for 28%, 19% and 11% of the total variance of SSH* respectively.However, EOF2 and EOF3 have collocated centers of anomalies in the Beaufort Gyre domain (Figs.3b and c), where the EOF2 pattern appears with positive anomalies and EOF3 with negative sign.The conventional EOF method calculates the mathematical spatial orthogonality between different modes, but physically the second and third modes here are mixed with one another.This may be due to the lack of spatial orthogonality of the physical modes themselves (Chen et al., 2017a).In order to improve the independence between the mixing modes EOF2 and EOF3, we orthogonally rotate a pair of standardized PCs through angle θ following Chen et al.(2017a):

Fig.2.(a) Spatial trend map of the ASL departure from the global mean sea level (denoted as SSH*, which equals SSH - [SSH], where [*] denotes the global average of the anomaly field) in mm yr-1 over 1979–2018.The dotted region indicates the area exceeding the 95% confidence level.(b) Area-averaged monthly SSH* time series over the Arctic Ocean (north of 65°N).
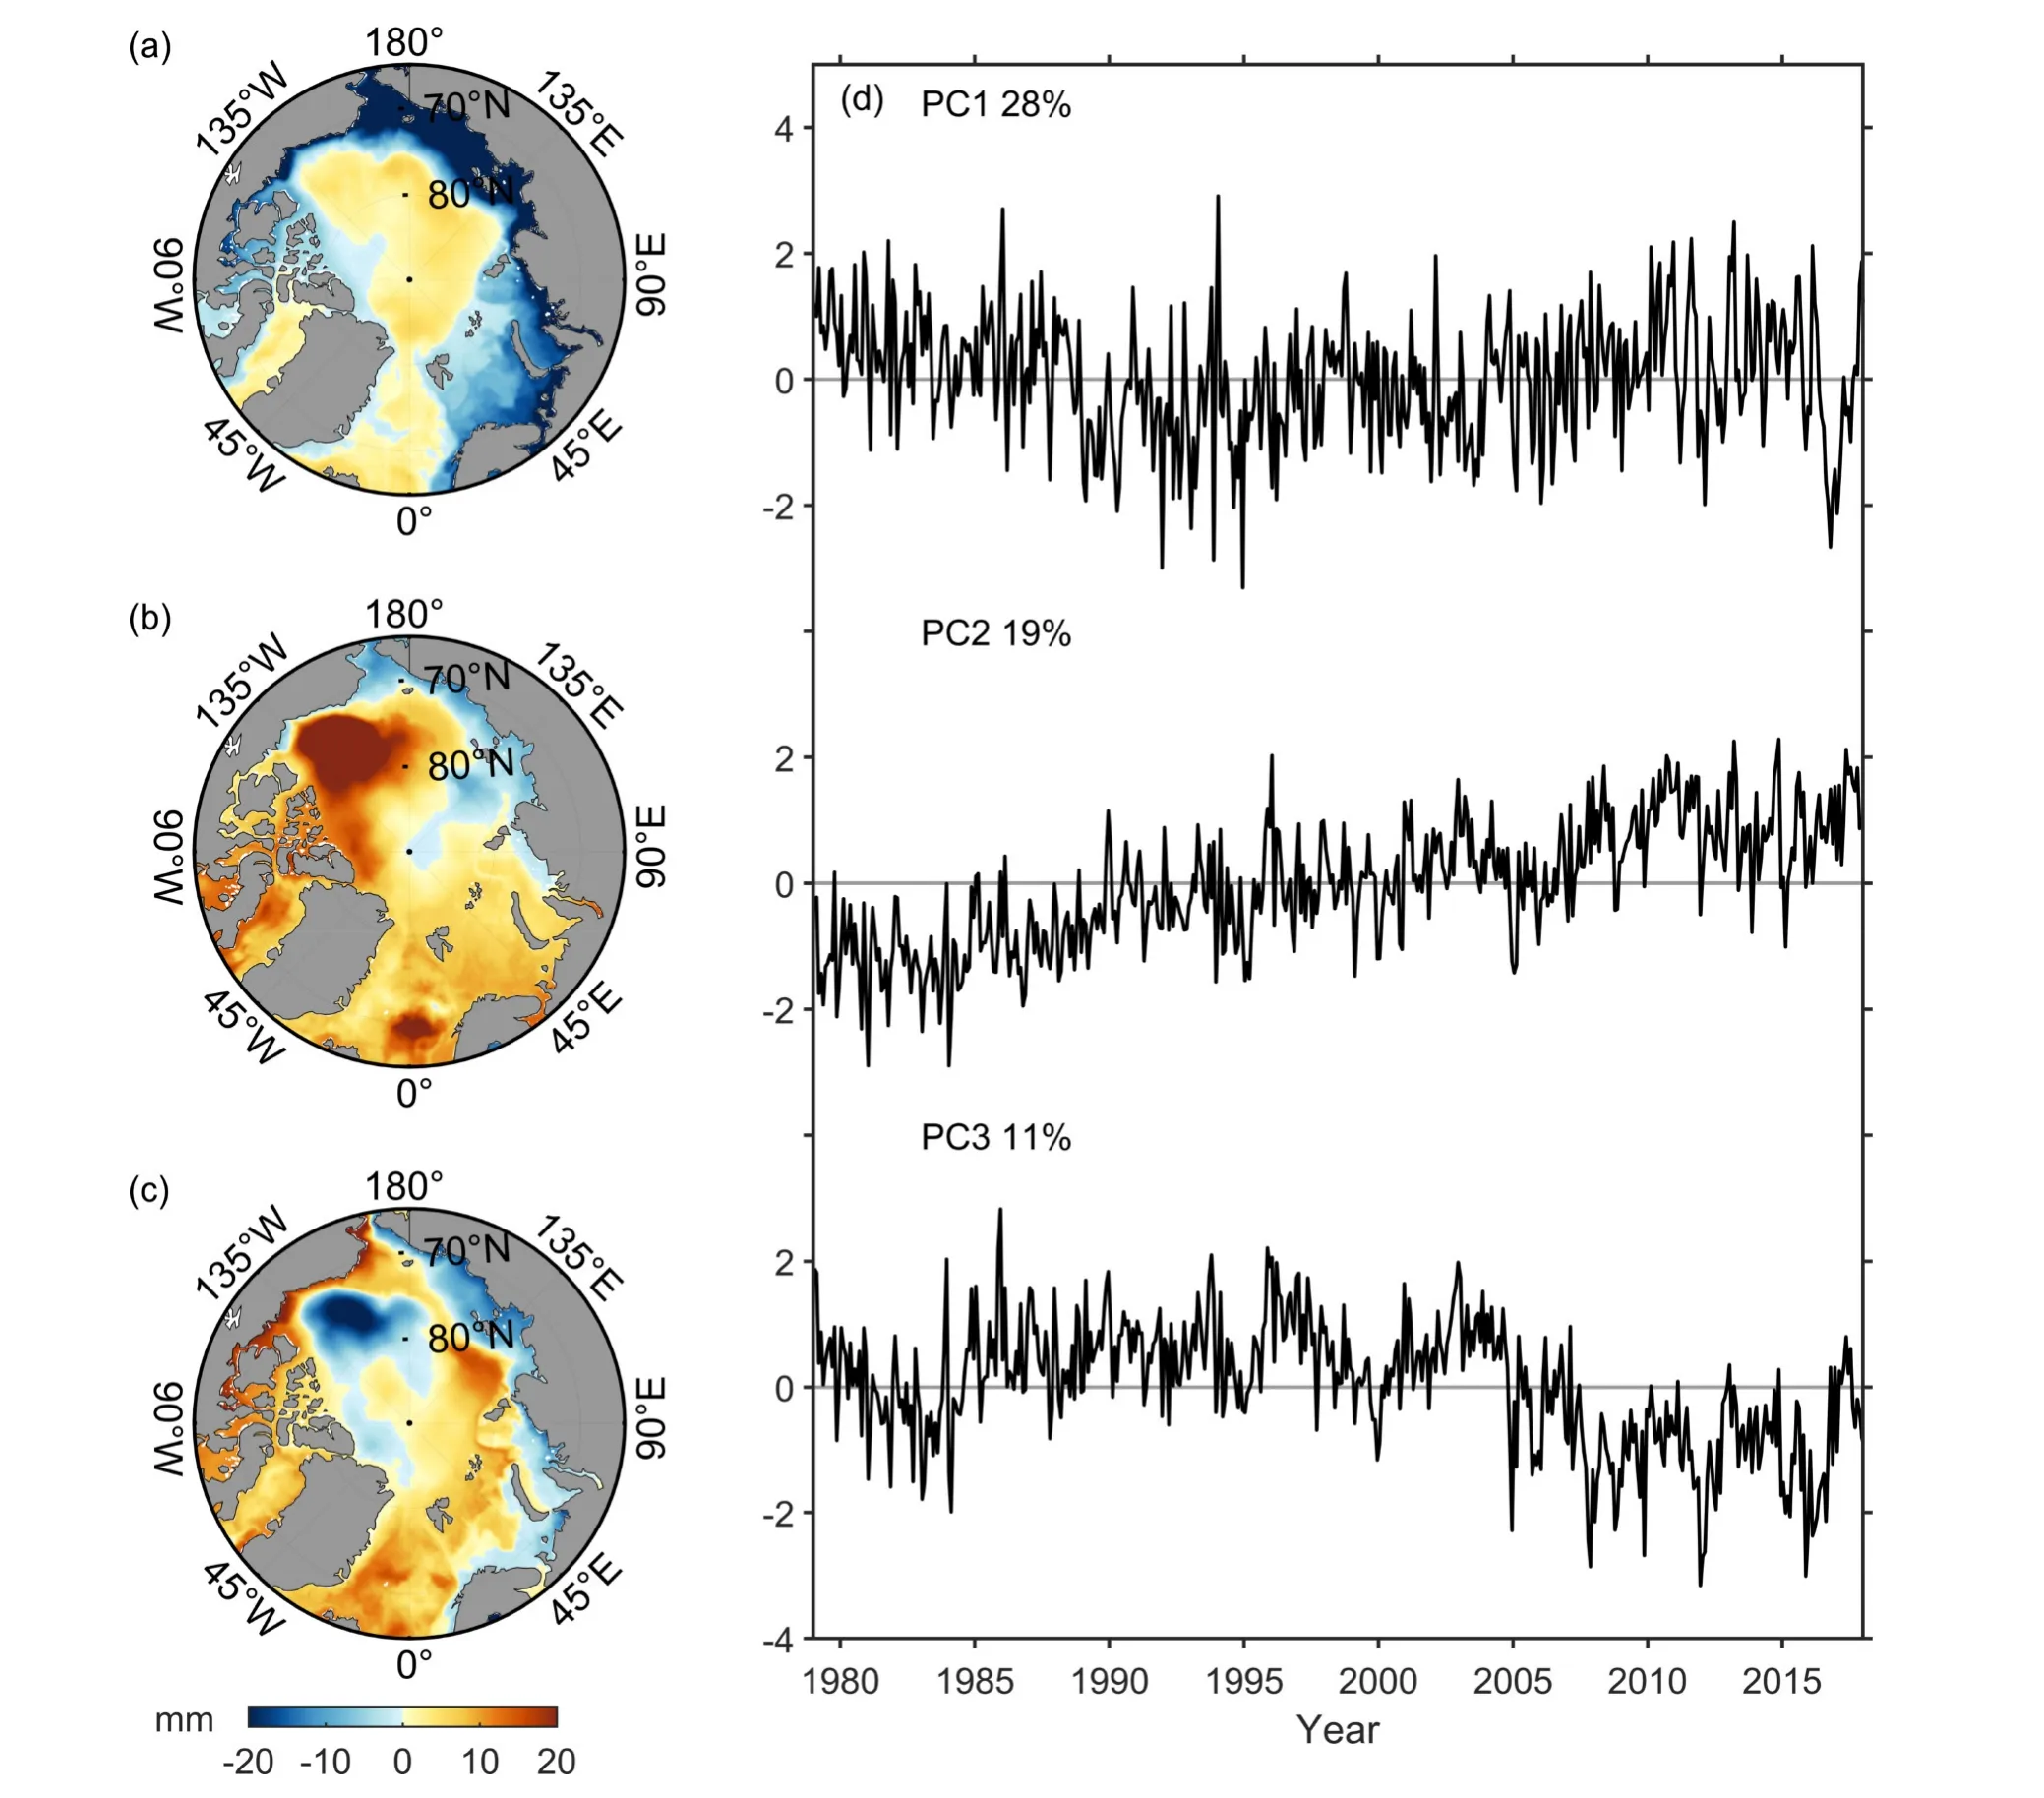
Fig.3.Conventional EOFs (a–c) and PCs (d) of the monthly Arctic SSH* based on ORAS5 over 1979–2018.Percentages of explained variance are given in the top left of each part in (d).The units of the EOF patterns are mm,and the PCs time series are normalized to be dimensionless.
where PCiand PCjrefer to the PC2 and PC3 based on the conventional EOF results, andrPCiandrPCjdenote the results after rotation.EOF2 and EOF3 are rotated through the same angle θ like their corresponding PCs:
The explained variances of pairwise-rotated modes are as flows:
where EVARiand EVARjdenote the explained variance of EOF2 and EOF3 based on the conventional EOF analysis,andrEVARiandrEVARjdenote the results after pairwise rotation.After the above rotation process, the PCs retain the temporal orthogonality, while the orthogonality of the corresponding EOFs is relaxed to present the physical modes.
Here, we adopt the frequency-averaged squared covariance (FASC) criteria for selecting the optimal rotation angle( θ) following Chen at al.(2017a).The FASC criteria minimize the frequency dependent covariances between the PCs in the interannual, decadal, and multidecadal frequency bands to derive the optimal rotation angel.The FASC metric for PC2 and PC3 is shown in Fig.4 as a function of rotation angle, with a minimum close to 40°.The pairwise-rotated EOF2 and EOF3 for the optimal rotation angle of 40° is shown in Fig.5.The pairwise rotation between EOF2 and EOF3 eliminates the mode mixing over the Beaufort Gyre region (Figs.4b and c).The results hereafter are based on the pairwise-rotated EOF shown in Fig.5.
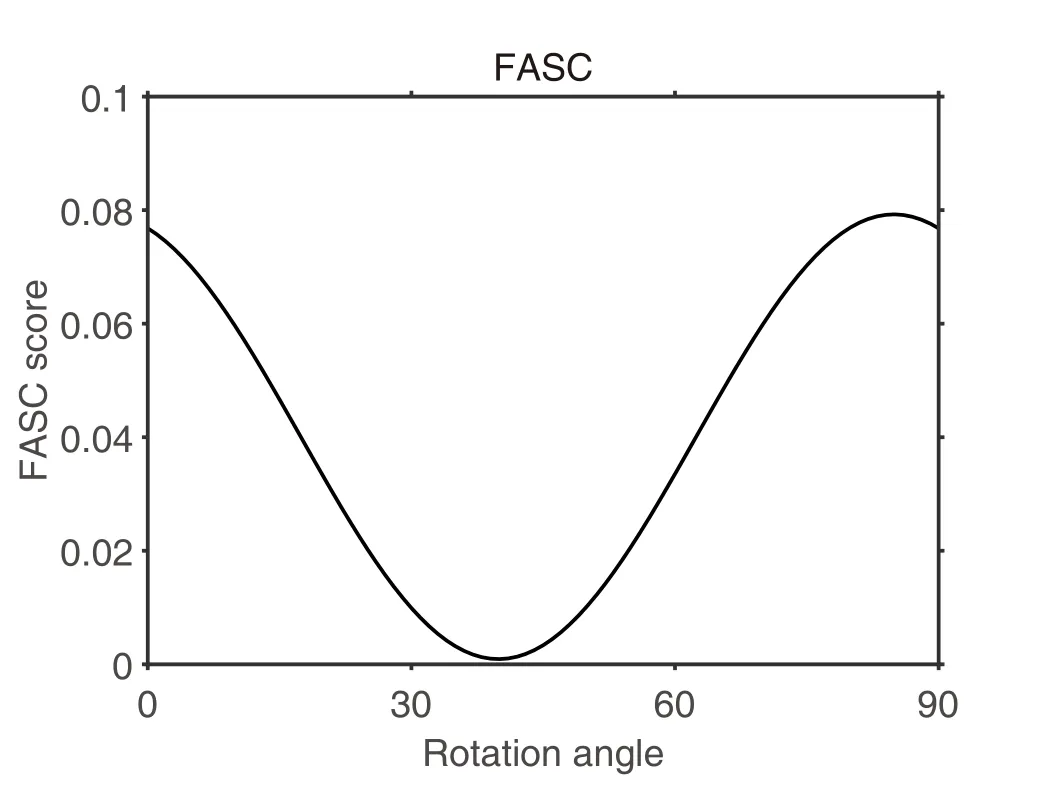
Fig.4.The FASC metric for PC2 and PC3 plotted as a function of rotation angle (degree).
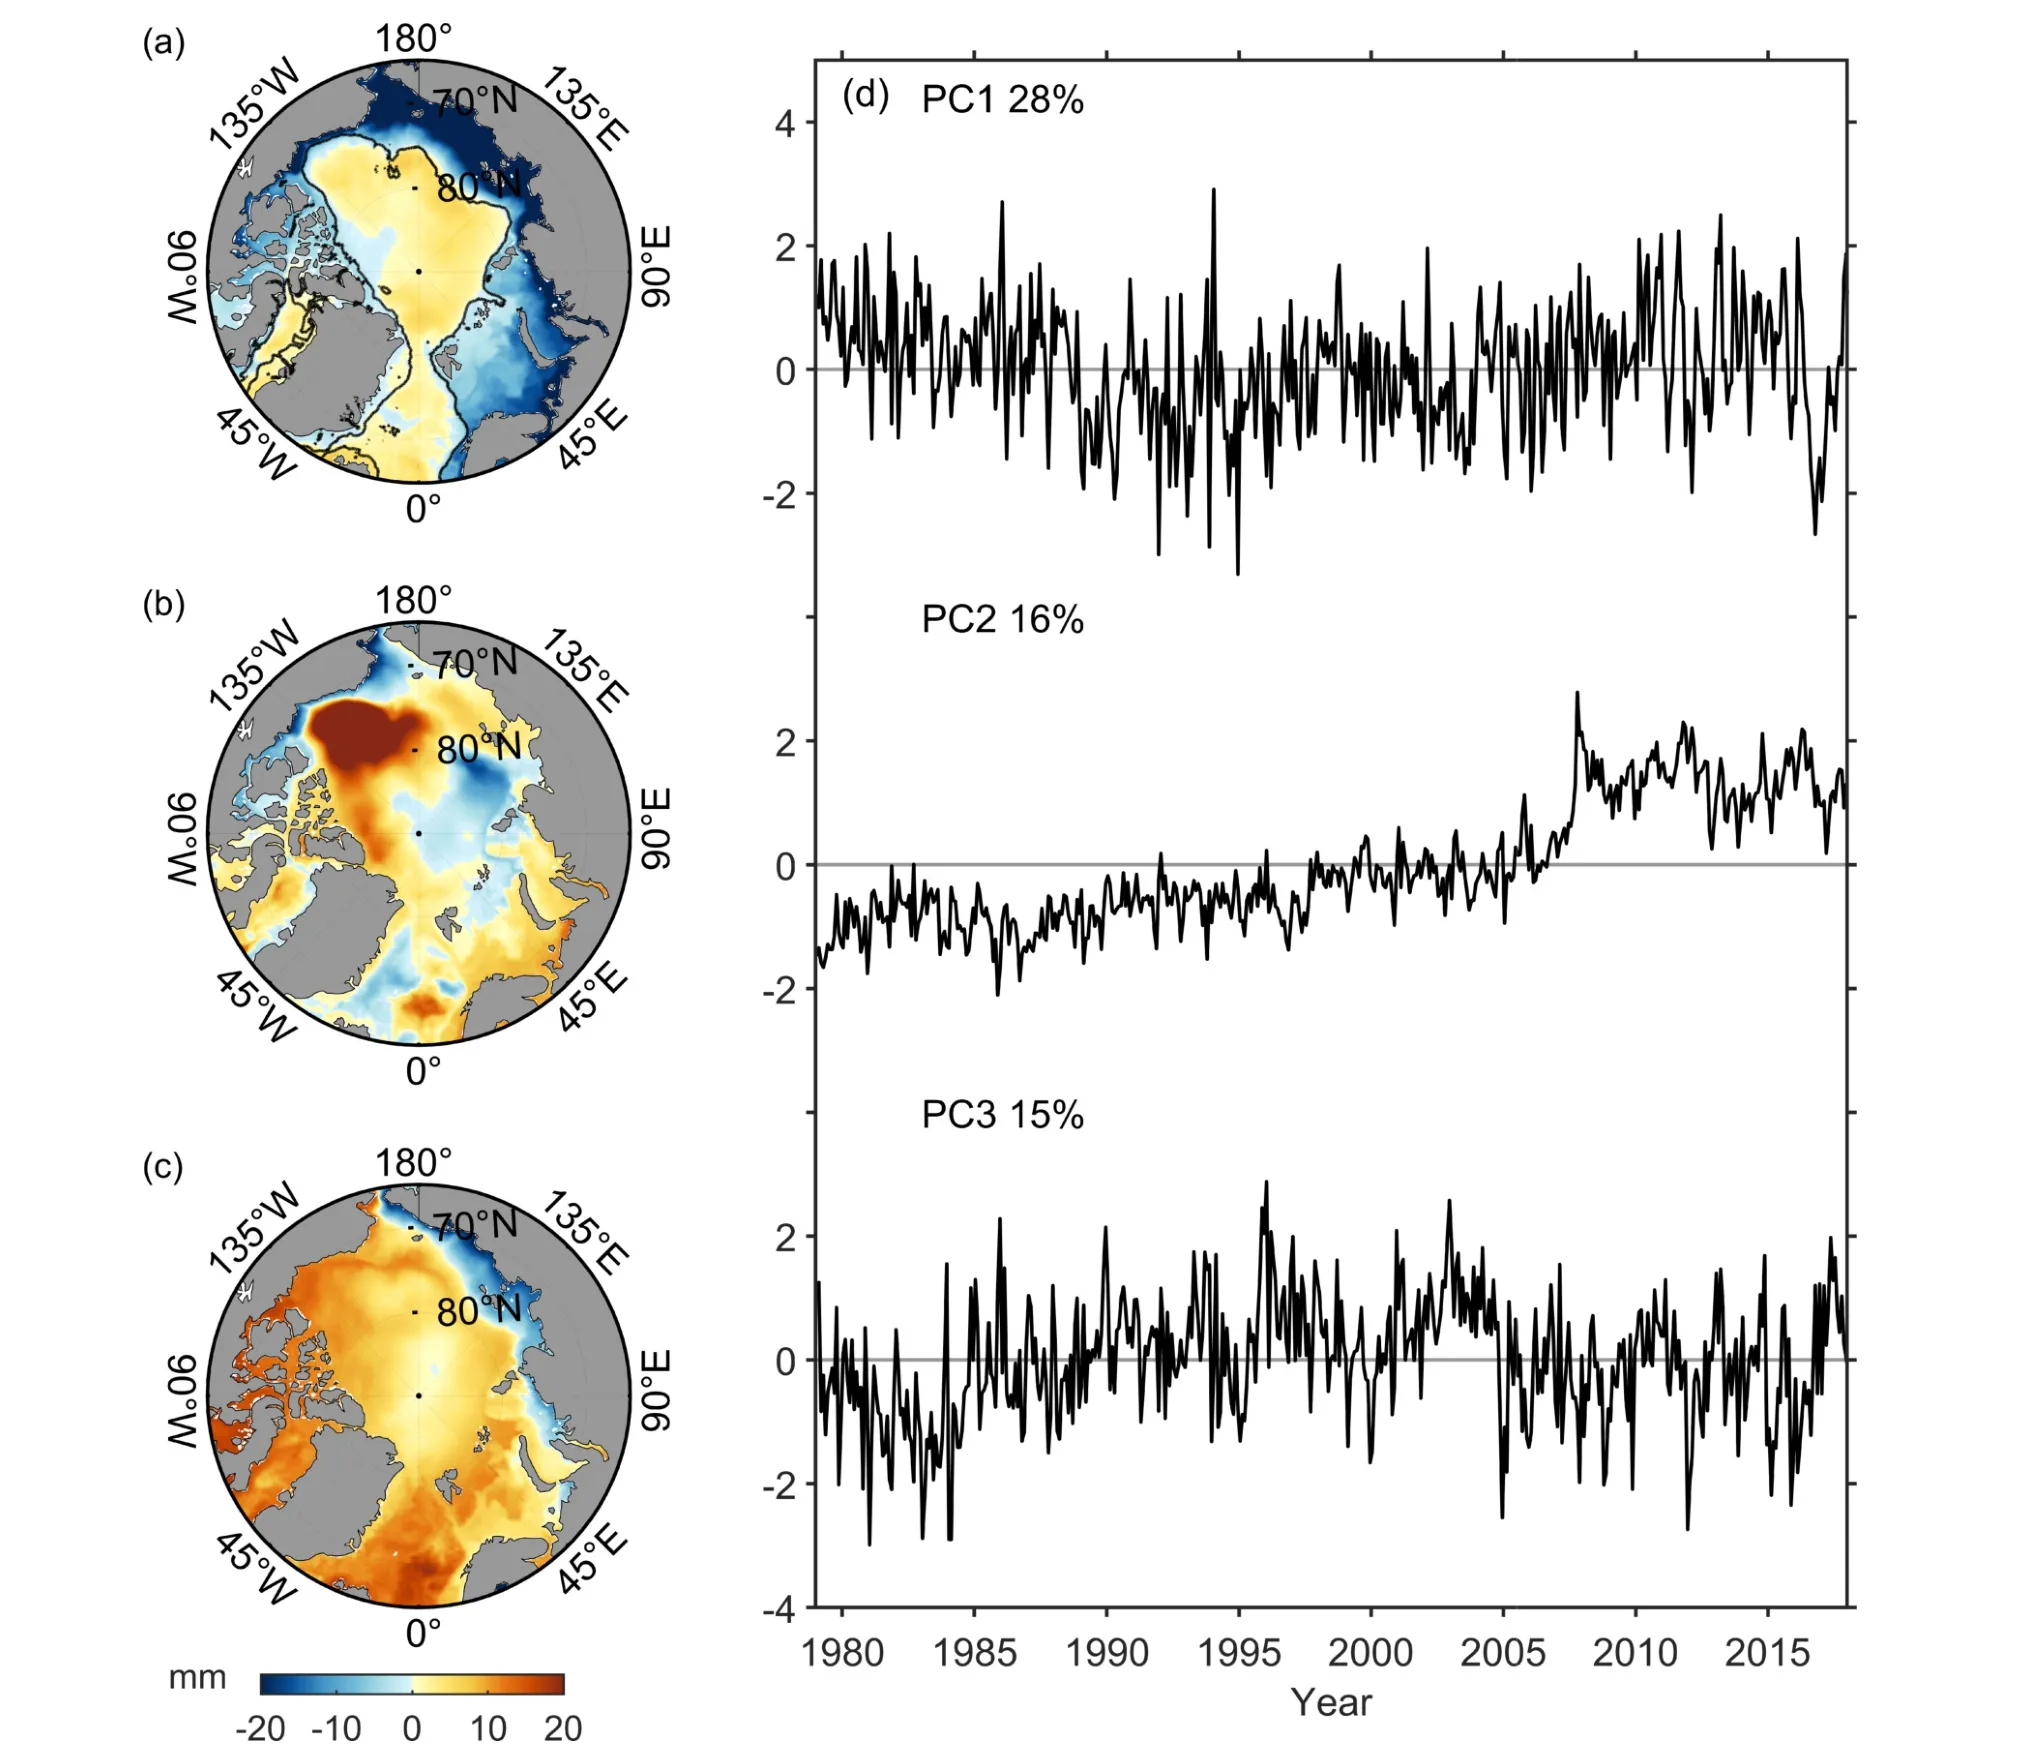
Fig.5.The rotated EOF results of Arctic SSH*: (a) EOF1, the same as Fig.3a, in which the black solid line denotes the 500-m isobath from ETOPO2; (b, c) the pairwise-rotated (b) EOF2 and (c) EOF3; (d) the corresponding PCs.The units of the EOF patterns are mm, and the PC time series are normalized to be dimensionless.The percentages of explained variance are listed in the top left of each panel in (d).
2.2.3.Uncertainty analysis
The significance of the correlation and regression coefficients is tested by considering the effective degree of freedom(Ne), calculated following Bretherton et al.(1999) as

3.Results and discussion
3.1.Sea-level components in the Arctic Ocean
Our understanding of ASL rise is limited due to the uncertainty in the satellite altimeter and GRACE observations and the lack of in situ hydrographic measurements in the Arctic Ocean.The budget of the ASL trend cannot be closed yet, with a residual trend of more than 1.0 mm yr-1(Raj et al., 2020).In the period 1993–2018, the ORAS5 reanalysis over the whole global ocean and satellite observations show comparable global mean sea level rise rates of 3.1 ± 0.1 mm yr-1and 3.0 ± 0.1 mm yr-1(95% confidence level), respectively.The regionally averaged sea level over the whole Arctic Ocean based on ORAS5 is 3.3 ± 0.4 mm yr-1over 1993–2018, consistent with the trend of 2.7 ± 0.7 mm yr-1from satellite altimeter observation, within the 95% confidence level.The global mean steric sea level from ORAS5(1.1 ± 0.3 mm yr-1) and IAP (0.9 ± 0.1 mm yr-1) data exhibit comparable upward trends over 1979–2018 within the 95% confidence level (Fig.1a).The mean steric sea level in the Arctic Ocean shows a smaller trend of 0.3 ±0.3 mm yr-1based on ORAS5 than IAP of 0.7 ± 0.1 mm yr-1over 1979–2018 (Fig.1b).This lower trend from ORAS5 could be explained by the lack of in situ observations in the Arctic Ocean to assimilate in the model, especially the salinity profiles (Zuo et al., 2019).Direct observations of the mass component are not available before the GRACE satellite.Based on the ORAS5 reanalysis, the mass component can be evaluated by subtracting the steric component from the total sea level (Fig.1).In the Arctic Ocean, the mass component is the dominant contributor (89.0%; 2.3 ± 0.3 mm yr-1)to the regional mean sea level trend (2.5 ± 0.3 mm yr-1)based on ORAS5 reanalysis.
Figure 2a shows the spatial trend map of the Arctic SSH* fields, which represent the Arctic regional ocean mass redistribution and the regional steric sea level change.A particularly strong sea level rising signal is found in the Beaufort Gyre region, while most areas of the Eurasian basin show negative trends.Integrating over the Arctic Ocean, we note that the opposite trend centers in Fig.2a offset each other, leading to an upward trend of 0.8 ± 0.4 mm yr-1over 1979–2018 (Fig.2b).
3.2.Mode 1: Mass redistribution related to the atmospheric forcing
The EOF1 map reveals an antiphase pattern between the central basin and the coastal shelf area of Arctic Ocean,and the spatial distribution agrees well with the bathymetry(500-m isobath; Fig.5a).This result is consistent with results from Proshutinsky et al.(2007) who also showed a similar of EOF1 pattern based on a regional model in the Arctic Ocean.The first EOF mode accounts for 28% of the total variance (Fig.5a).The PC1 does not show a significant trend (p = 0.88) and correlates significantly with the AO index (-0.44; p < 0.01).Regional model simulation and altimeter observations also reveal this correlation between PC1 and the AO index (Proshutinsky et al., 2007, Prandi et al., 2012).When projecting the SLP and surface wind stress fields on PC1, we note the regression map resembles the AO pattern, with the anomaly center located in the central Arctic basin (Figs.6e and h).This negative correlation between the AO index and PC1 time series indicates the potential impact from the atmospheric forcing on the regional sea level variability in the semi-enclosed Arctic Ocean between the shallow coastal areas and the deep basin(Proshutinsky and Johnson, 1997).Positive AO is characterized by cyclonic atmospheric circulation, and the resulting Ekman transport moves the water from the central Arctic basin to the shallow coastal areas.Hence, the regional sea level decreases in the central Arctic basin and increases in the shallow coastal areas, while the regional sea level change is opposite during negative AO phases (Armitage et al., 2018).Furthermore, the regression map of the wind stress field shows a strongest alongshore wind signal at the eastern coastline of the North Atlantic (Fig.6h).Previous studies indicate these alongshore winds along the European coastline cause barotropic coastally trapped waves, which can propagate along the shallow continental slope and ultimately induce the anti-phase oscillation between the deep central basin and shallow shelf areas (Volkov and Landerer,2013; Fukumori et al., 2015).Recently, Danielson et al.(2020) found the high-frequency (several days) ASL variability is associated with the fast propagation of large-scale continental shelf waves, which is spatially coherent over hundreds of kilometers.
The correlation coefficient between the PC1 and AO index is -0.68 (p < 0.01) over 1979–1995, while the correlation coefficient reduces to -0.24 and is insignificant (p =0.18) after 1995.This indicates that the relationship between regional sea level variability in the Arctic Ocean and large-scale atmospheric forcing related to the AO changes after 1995.We use the tide gauge records to validate this changing relationship between local sea level variability and the large-scale atmospheric forcing.Figure 7a depicts the normalized mean sea level time series based on tide gauge observations in the Arctic Ocean (tide gauge locations shown in Fig.1c).The observed mean sea level time series from tide gauges shows correlation with the AO index, with a significant correlation coefficient of 0.45 (p < 0.01).Projecting the SLP and surface wind stress on the normalized mean sea level from tide gauge observations shows an AOrelated pattern (Fig.7b), indicating these opposite signals in the shallow coastal region and the central deep basin are potentially driven by the large-scale atmospheric process related to the AO.The correlation between the observed sea level from tide gauges and the AO index also becomes weaker from 1995, with a significant correlation coefficient of 0.65 (p < 0.01) over 1979–1994 and insignificant correlation coefficient of 0.32 over 1995–2018 (p = 0.05).
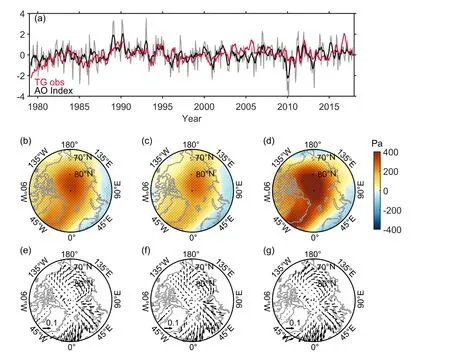
Fig.7.(a) The mean sea level from tide gauge observations (TG obs; red; 5-month running mean).The AO index (grey) and 5-month running mean time series are superimposed (black).Both the AO index and mean sea level from tide gauge observations are normalized to be dimensionless.(b) Regression map by projecting the SLP upon the normalized mean sea level from tide gauge records.(c) As in (b) but during months with less sea ice coverage (SON).(d) As in (b) but during months with more sea ice coverage (JFM).Units for (b–d) are Pa.The dotted region indicates the area exceeding the 95%confidence level.(e–g) As in (b–d) but for wind stress regressed on the normalized mean sea level from tide gauge observations.Units for (e–g) are N m-2.
Both tide gauge observations and the ORAS5 reanalysis data show the contribution of atmospheric forcing to regional sea level variability becomes much smaller during the latest two decades than before 1995, indicating the dominant process contributing to Arctic regional sea level is changing under the climate change situation.Arctic sea ice has experienced an accelerating decline since 1996 (Comiso et al., 2008; Stroeve et al., 2012), which may be the reason for the changing relationship between the atmospheric forcing and the regional sea level variability in the Arctic Ocean.Recent studies indicate that sea ice plays an important role in modulating the ocean–atmosphere interaction in the Arctic Ocean (Meneghello et al., 2017; Dewey et al., 2018).
To investigate the impact of sea ice on the AO-related sea level variability, we divide the sea level change into months with more sea ice [January–March (JFM)] and months with less sea ice [September–November (SON)].The PC1 during SON with less sea ice indicates a lower correlation coefficient with the AO index (0.32; p = 0.12) than during JFM with more sea ice (0.53; p < 0.01).When projecting the regional sea level change (SSH*) on the PC1 during SON (months with less sea ice) and JFM (months with more sea ice), the regression coefficient map shows a lower positive center during SON (Fig.6c) in the Arctic central basin than during JFM (Fig.6d).Furthermore, the SLP regression coefficients in the central Arctic Ocean during SON are weaker than the corresponding coefficients during JFM(Figs.6f and g).This indicates the relationship between the sea level variability and AO-related atmospheric forcing is stronger during higher coverage of sea ice (JFM).The wind stress regression coefficient maps are comparable during SON and JFM (Figs.6i and j).Similarly, we project the SLP and wind stress fields on the normalized mean tide gauge observations (Fig.7).During JFM (months with more sea ice), the positive SLP regression coefficients in the central Arctic Basin are stronger compared with the coefficients during SON (months with less sea ice; Figs.7b–d).The wind stress regression coefficient also presents a stronger anticyclonic pattern during JFM (months with more sea ice), while the associated coefficient is weaker during SON (months with less sea ice; Figs.7f and g).
The above results indicate the AO-related sea level variability in the Arctic Ocean is mainly a response to the largescale atmospheric forcing process, which is mediated by the coverage of sea ice.The sea ice blocks the direct effects of atmospheric forcing at the sea surface.When the coverage of open water increases, the direct air–sea interactions become more intense and the regional sea level variability response to the atmospheric forcing becomes more complicated rather than the barotropic response.Here, we use the tide gauge observations and ORAS5 reanalysis during different time periods to demonstrate that the sea level variability of mode 1 is mainly related to the AO-related atmospheric forcing and modulating by the sea ice coverage.
3.3.Mode 2: Steric sea level rise in Beaufort Gyre
The second EOF mode of SSH* explains 16% of the total variance (Fig.5b).This mode shows a strong positive anomaly in the Beaufort Gyre region, in agreement with the SSH* trend pattern over 1979–2018 (Fig.2a).EOF2 also shows positive anomalies located in the Norwegian Sea and along the west coast of Greenland.The positive trend in the Norwegian Sea may be related to the increasing warm water from the Atlantic Ocean into the Arctic Ocean recently(Polyakov et al., 2005).Along the west Greenland coast, the sea level rise can be linked to the increase in freshwater from the melting of the Greenland ice sheet, which leads to decreasing salinity and an increasing halosteric sea level(Dukhovskoy et al., 2016; Gillard et al., 2016; Liu et al.,2018).PC2 is highly correlated to the regional mean time series of freshwater content in the Beaufort Gyre region,with a significant correlation coefficient of 0.88 (p < 0.01;Fig.8a), indicating a dominant halosteric contribution in this region.The satellite altimetry and in situ observations indicate the largest increasing signal of ASL is found in the Beaufort Gyre region, which is related to the increased freshwater accumulation in this region due to the intensified convergence over the Beaufort Gyre region (Proshutinsky et al.,2009; Giles et al., 2012; Morison et al., 2012; Armitage et al., 2020).
The regionally averaged freshwater content time series in the Beaufort Gyre shows substantially increasing levels after 1995 (Fig.8a).Figures 8b–e show the coverage of temperature profiles deeper than 300 m from the EN4 dataset during the four periods of 1950–1985, 1985–1995, 1995–2005,and 2005–2018, respectively.The coverage of in situ observations in the Arctic Ocean is still sparse given the harsh environment, leaving much of the central basin area uncovered before 2005.The observational coverage before 1995 is sparse in the Beaufort Gyre region (Figs.8b and c).The number of profiles increases in the Beaufort Gyre from 1995;then, after 2005, the data coverage increases dramatically and the locations of profiles cover almost the whole Beaufort Sea (Fig.8e).This improved observational coverage is mainly due to the increased number of moorings and ice-tethered profilers for the Beaufort Gyre Observing System since 2003 (Krishfield et al., 2008; Toole et al., 2011).Another potential reason is the rapidly decreasing sea ice coverage in the Pacific sector since the 1990s provides more possibilities for in situ hydrological observations.
3.4.Mode 3: Pacific water intrusion
EOF3 reveals a positive-phase spatial pattern almost everywhere in the Arctic Ocean except along the Siberian coastal region (Fig.5c).This mode explains 15% of the total variance.The spatial pattern of EOF3 shows the general water exchange pathway from the Pacific Ocean into the Arctic Ocean, characterized by the inflow from the Bering Strait.The northward volume transport calculated from the ORAS5 reanalysis is significantly correlated with that from the in situ mooring observations from Woodgate (2018),with a correlation coefficient of 0.84 (p < 0.01; Fig.9a).PC3 shows sea level variability in close agreement with the net northward volume transport through the Bering Strait into the Arctic Ocean based on the ORAS5 reanalysis, with a significant correlation coefficient of 0.55 (p < 0.01).This indicates the main contributor to EOF3 is the Pacific water intrusion.
Figure 9b presents the regression map of the regional SSH* on the normalized net northward ocean volume transport from the Bering Strait into the Arctic Ocean from ORAS5.Significant negative regression coefficients are shown in the Siberian coast regions, while the positive regression coefficients occupy a larger area of the central Arctic Ocean.The regression map of SSH* on the normalized Bering Strait volume transport from ORAS5 shows strong northward intrusion (Fig.9b).The atmospheric forcing associated with mode 3 is investigated by projecting the SLP and wind stress on the normalized volume transport through the Bering Strait.The regression maps show the ASL change of this mode is related to the large-scale atmospheric forcing.The SLP regression map shows a positive pressure in the central Arctic Basin and negative pressure over the Eurasian continent.The wind stress regression map associated with the volume transport is consistent with the SLP regression pattern and shows cross Bering Strait wind stress.Previous studies indicate the local wind is correlated with the volume transport through the Bering Strait (Woodgate and Aagaard, 2005; Peralta-Ferriz and Woodgate, 2017).Armitage et al.(2018) suggested that the Bering Strait inflow is related to the AO,with the southward (northward) geostrophic current anomalies from the Pacific Ocean to the Arctic Ocean driven by the along-strait wind anomalies during the positive (negative) phase of the AO.
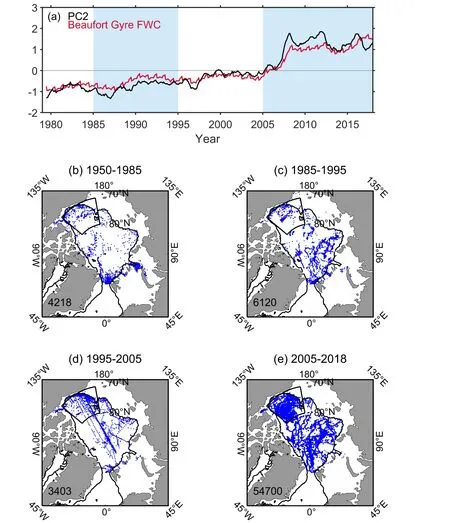
Fig.8.(a) The time series of regional mean FWC in the Beaufort Gyre (red) and PC2 (black).Both the PC2 and regional mean FWC in the Beaufort Gyre are normalized to be dimensionless.The 5-month running mean is used to smooth the time series.(b–e) Locations of observational profiles deeper than 300 m from the EN4 dataset for the different periods of 1950–1985, 1985–1995, 1995–2005 and 2005–2018.The black frame indicates the Beaufort Gyre region.The black thin curve denotes the 500-m isobath.The total number of profiles is shown in the lower left corner.
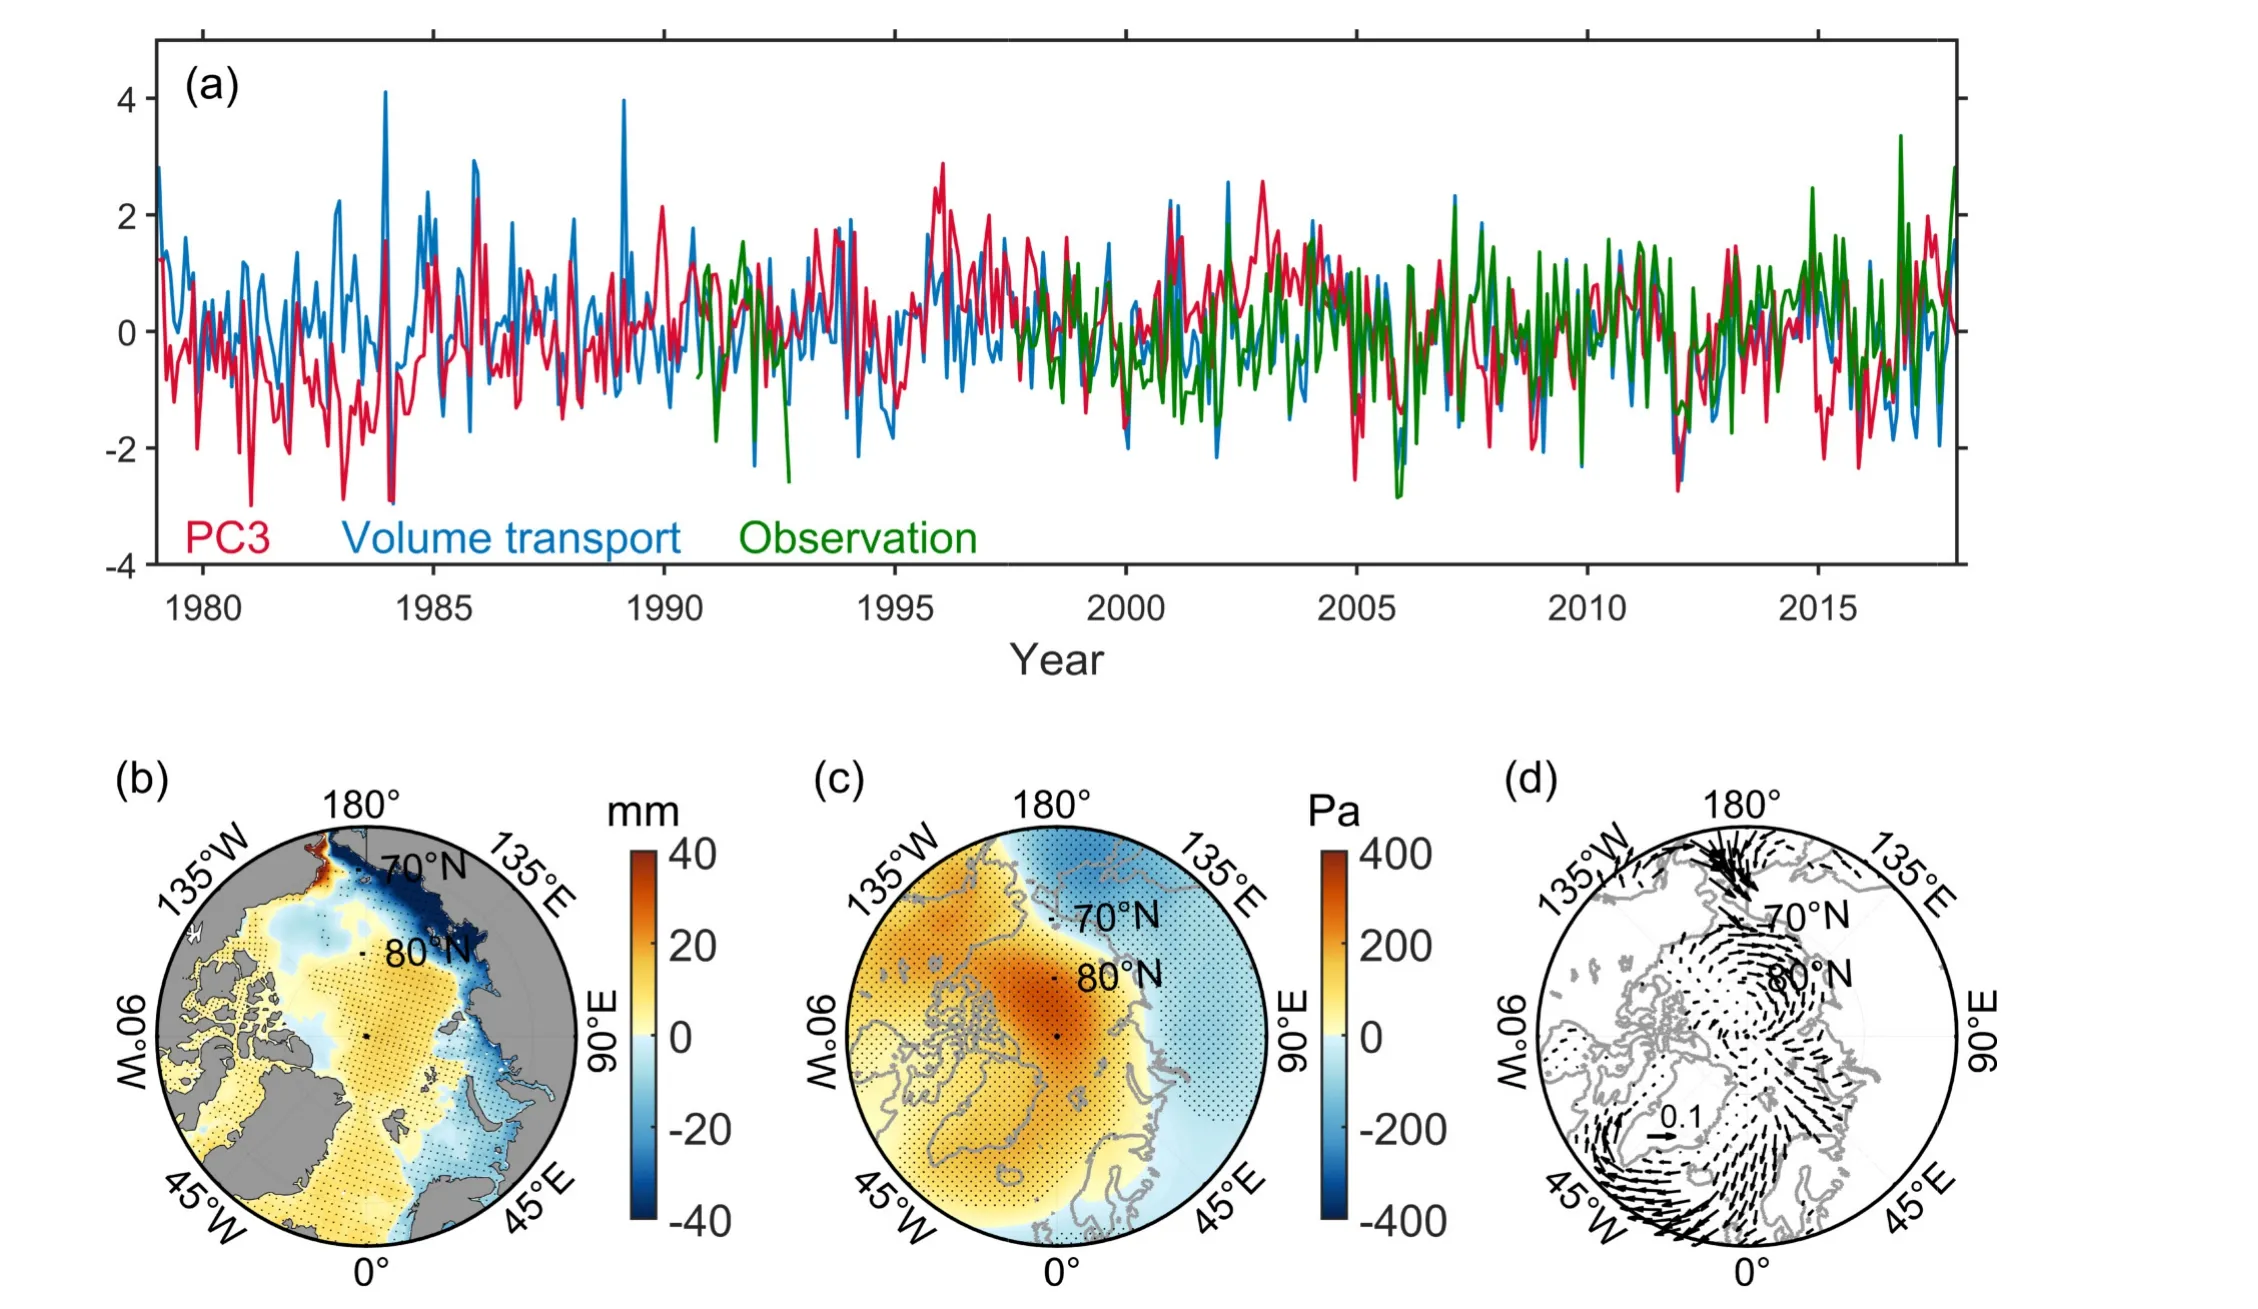
Fig.9.(a) The time series of PC3 (red), net northward ocean volume transport from the Bering Strait into the Arctic basin,based on ORAS5 (blue), and northward volume transport estimated from in situ mooring observations from Woodgate(2018).All time series are normalized to be dimensionless.(b) Regression map by projecting the Arctic SSH* at each grid point upon the normalized net northward ocean volume transport from the Bering Strait into the Arctic basin.Units are mm.(c) Regression map by projecting the SLP at each grid point upon the normalized net northward ocean volume transport from the Bering Strait into the Arctic basin.Units are Pa.The dotted region indicates the area exceeding the 95% confidence level.(d) Regression map by projecting the wind stress at each grid point upon the normalized net northward ocean volume transport from the Bering Strait into the Arctic basin.Units are N m-2.
The wind stress regression map also indicates a prevailing southward component from the Arctic Ocean to the Atlantic Ocean.Considering the sea level in the Canadian Basin shows a significant upward trend recently, the freshwater outflow from the Arctic Ocean to the Atlantic Ocean may increase.This is important since the increasing freshwater transport to the North Atlantic Ocean could impact on the large-scale AMOC (Proshutinsky et al., 2002; Curry and Mauritzen, 2005).
Similar to the EOF1 pattern (Fig.5a), this regression coefficient map of SSH* also reveals an antiphase relation between the deep Arctic basin and the shallow coastal regions, especially in the Siberian coastal regions.Armitage et al.(2018) suggested that the Bering Strait inflow into the Arctic Ocean is related to the AO-driven wind variability.This indicates the net water flux through the Bering Strait may play a role in modulating the opposite signal between the deep basin and shallow shelf areas.
3.5.Decomposition of ASL change
Based on the EOF analysis, we reconstruct the influence from each process on the Arctic regional sea level variability by using the sum of the leading EOFs and corresponding PCs and the global mean sea level.Figure 10 presents the four leading contributions of ASL variability.The sum of contributions agrees well with the Arctic mean sea level variability, except for some extreme values, with an explained variance of 95.0% of the total ASL variance (Fig.10e).The residual time series (Arctic mean sea level minus the sum of contributions) shows high-frequency variability and without a significant trend (p = 0.99; Fig.10f).The residual time series could be related to the high-frequency signals like the synoptic-scale coastal trapped waves, while it is hard to detect by using the ORAS5 reanalysis dataset at a monthly resolution.This is worthy of further investigation in the future.
The decomposition shows the recent Arctic averaged sea level rise is substantially dominated by the global mean sea level increase (Fig.10d).The estimated global mean sea level rate of increase based on ORAS5 is 1.9 ± 0.5 mm yr-1over 1979–2018, which can contribute approximately 69.7%of the total Arctic sea level trend (2.5 ± 0.3 mm yr-1;Fig.10d).We complement the study of Carret et al.(2017)based on GRACE and satellite altimeter observations and indicating the global mean sea level rise is the main contributor for the ASL rise in the last two decades.There has been a remarkable acceleration in the observed global mean mass contributions over the satellite era, dominated by the increasing Greenland ice sheet mass loss (Chen et al., 2017b), implying the ASL may potentially experience accelerated sea level rise during the same period.
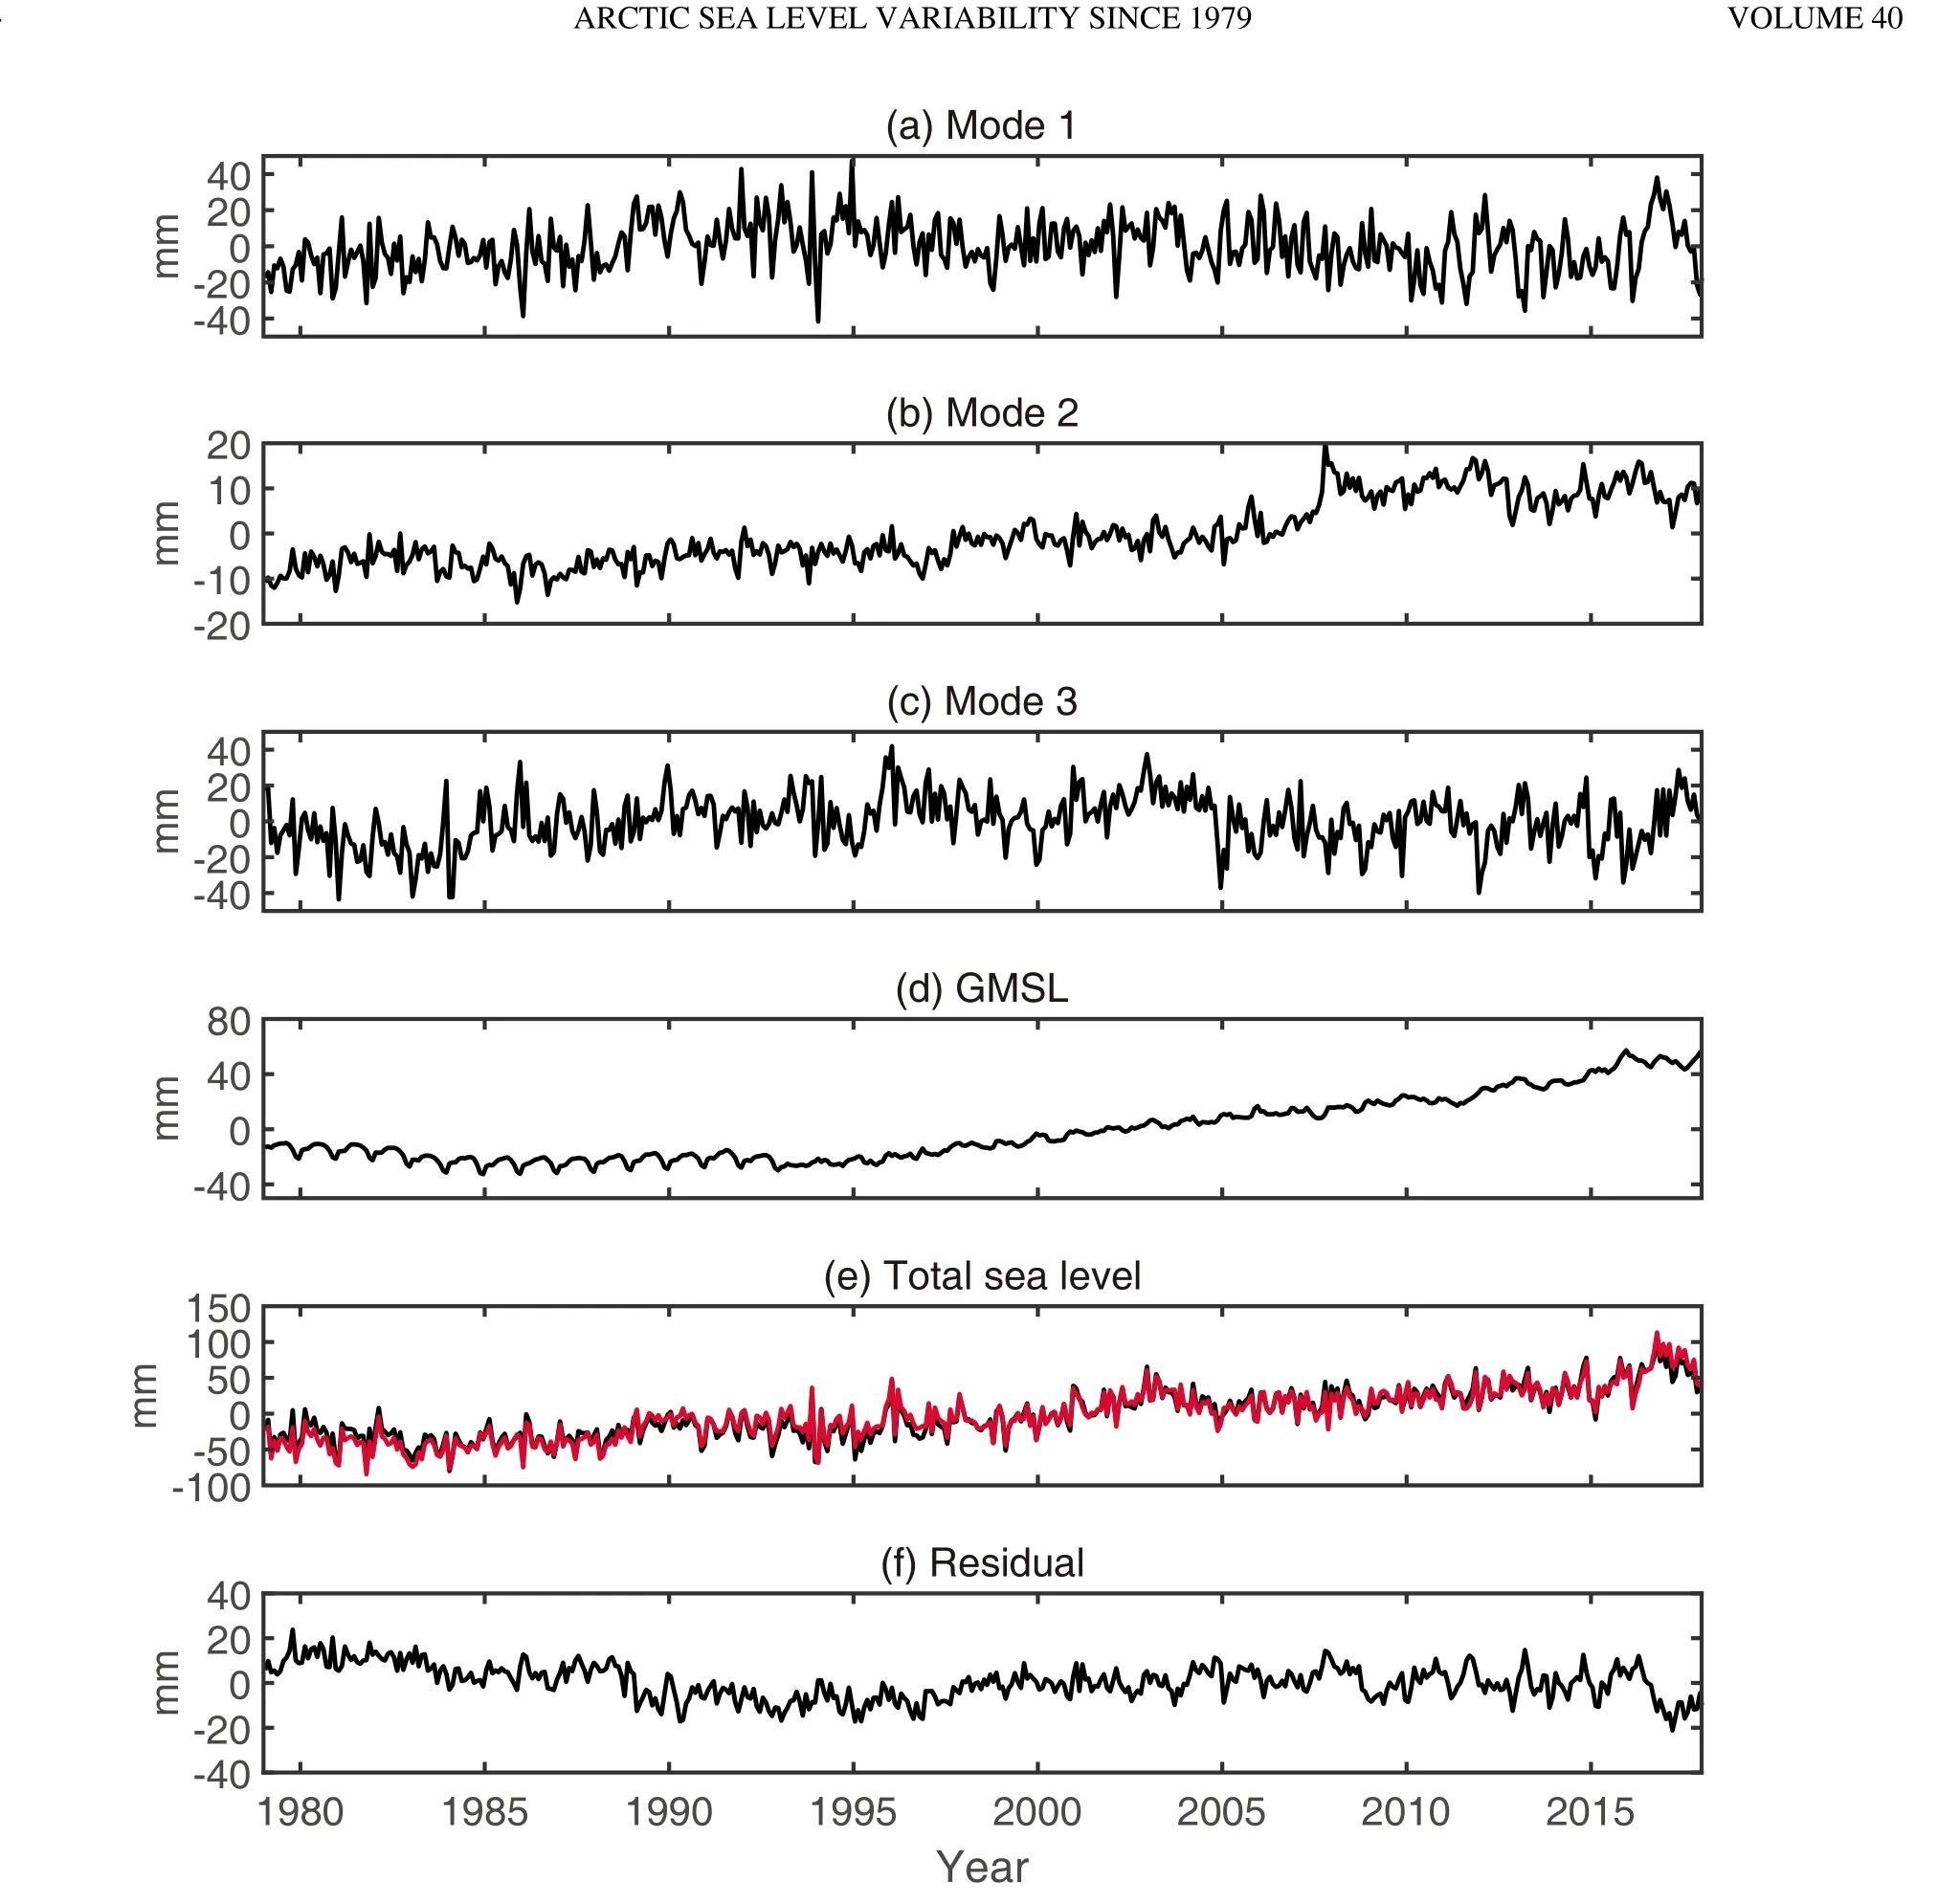
Fig.10.(a) The AO-related sea level variability based on mode 1.(b) The contribution of mode 2 associated with steric sea level variability.(c) The contribution of mode 3 associated with the Pacific water intrusion into the Arctic Ocean.(d) Global mean sea level.(e) The time series of Arctic mean sea level (black) and the sum of each reconstructed ASL component (red).(f) The residual time series (Arctic mean sea level minus the sum of contributions).
The second important component of the ASL variability is the local mass redistribution in the semi-enclosed Arctic basin on interannual time scale, without a significant trend over last two decades (p = 0.02; Fig.10a).As shown in Fig.6, the AO dominants this interannual sea level variability in the Arctic Ocean, leading to cross-shelf ocean water redistribution through Ekman transport and causing an opposing sign between the shallow coastal area and central basin(Volkov and Landerer, 2013; Peralta-Ferriz et al., 2014; Fukumori et al., 2015).However, this interannual sea level variability associated with atmospheric forcing makes little contribution to the recent sea level rise in the Arctic Ocean.
The third contribution is the significant steric sea level increasing located in the Beaufort Gyre region (Fig.5 and Fig.10b).The high correlation coefficient (0.88; p < 0.01)between PC2 and the Beaufort Gyre freshwater content indicates the freshening leads to the steric sea level rising(Fig.8).Koldunov et al.(2014) suggests that the enhanced freshwater accumulation in the Beaufort Gyre is due to Ekman transport convergence in the Beaufort Gyre region driven by the stronger atmospheric anticyclonic circulation anomaly in recent years.This halosteric sea level change in the Beaufort Gyre region and the freshwater outflow into the Atlantic basin have a potential influence on the largescale AMOC in the future.
The last component indicates an interannual sea level variability mainly related to water intrusion from the Pacific Ocean (Fig.9 and Fig.10c).This component is mainly related to the net northward water volume transport from the Pacific Ocean driven by the wind stress across the Bering Strait, with the spatial pattern indicating a basinscale sea level rise, except in regions along the Siberian coastline.
4.Conclusions
In this paper, we investigate the ASL variability over 1979–2018 based on ORAS5 reanalysis data.The dominant contributor to the ASL rise is the global mean sea level increase, which shows an accelerating sea-level rate over the last decade according to the satellite altimetry observations.
On the interannual time scale, the opposite oscillation of the shallow coastal area and the deep ocean basin shown in mode 1 is the response of the ASL to the AO.However,during the past two decades, the relationship between the surface atmospheric forcing (SLP and wind stress) and the Arctic sea-level variability becomes weaker, indicating the impacts of the sea-ice retreat on the regional sea level variability in the Arctic Ocean.As the coverage of sea ice keeps decreasing in the presence of global warming, the air–sea interaction in the Arctic Ocean becomes more complicated.Mode 2 indicates the steric sea level increase due to the global ocean warming is also seen in the Arctic Ocean in the last decade,with a largest positive trend signal found in the Beaufort Gyre region.Because more open water in the Beaufort Gyre region enhances the absorption of heat by the ocean and the intensive anticyclonic circulation anomaly in recent years leads to more freshwater accumulated here, both processes contribute to the steric sea level rise.Finally, the main contributor of the interannual sea level variability shown in mode 3 is related to the intrusion of water transport from the Pacific Ocean, as the dynamical response to the surface winds(Armitage et al., 2018).
The Arctic Ocean is experiencing more rapid climate change than the rest of the world’s oceans.Understanding Arctic sea-level variability is still challenging because of the harsh environment and insufficient observations, including the existence of sea ice, the incomplete coverage of satellite altimeter measurements, and the limited in situ temperature and salinity observations.Understanding and quantifying the contributions of individual ASL components and contributions from different physical processes are important to improve the confidence level and narrow the uncertainty in the model-projected ASL.
Acknowledgements.The authors are thankful to the ECMWF for providing the ORAS5 reanalysis data, as well as to PSMSL for gathering and providing the tide gauge data.This study was supported by the National Key R&D Program of China(Grant No.2019YFA0607000), the National Natural Science Foundation of China (Grant Nos.41825012 and 42206207), and the Fundamental Research Funds for the Central Universities (Grant No.202213048).
杂志排行
Advances in Atmospheric Sciences的其它文章
- Toward Quantifying the Increasing Accessibility of the Arctic Northeast Passage in the Past Four Decades※
- Separation of Atmospheric Circulation Patterns Governing Regional Variability of Arctic Sea Ice in Summer※
- The Arctic Sea Ice Thickness Change in CMIP6’s Historical Simulations※
- Simulations and Projections of Winter Sea Ice in the Barents Sea by CMIP6 Climate Models※
- Evaluation of the Arctic Sea-Ice Simulation on SODA3 Datasets※
- Influence of Surface Types on the Seasonality and Inter-Model Spread of Arctic Amplification in CMIP6※
