A Parameterization Scheme for Wind Wave Modules that Includes the Sea Ice Thickness in the Marginal Ice Zone※
2023-12-26DongangLIUQinghuaYANGAndreiTSARAUYongtaoHUANGandXueweiLI
Dongang LIU, Qinghua YANG, Andrei TSARAU, Yongtao HUANG, and Xuewei LI*
1Navigation College, Dalian Maritime University, Dalian 116026, China
2School of Atmospheric Sciences, Sun Yat-sen University, and Southern Marine Science and Engineering Guangdong Laboratory (Zhuhai), Zhuhai 519082, China
3SINTEF Ocean, Brattørkaia 17C, 7010 Trondheim, Norway
4Norwegian University of Science and Technology, 7491 Trondheim, Norway
ABSTRACT The global wave model WAVEWATCH III® works well in open water.To simulate the propagation and attenuation of waves through ice-covered water, existing simulations have considered the influence of sea ice by adding the sea ice concentration in the wind wave module; however, they simply suppose that the wind cannot penetrate the ice layer and ignore the possibility of wind forcing waves below the ice cover.To improve the simulation performance of wind wave modules in the marginal ice zone (MIZ), this study proposes a parameterization scheme by directly including the sea ice thickness.Instead of scaling the wind input with the fraction of open water, this new scheme allows partial wind input in icecovered areas based on the ice thickness.Compared with observations in the Barents Sea in 2016, the new scheme appears to improve the modeled waves in the high-frequency band.Sensitivity experiments with and without wind wave modules show that wind waves can play an important role in areas with low sea ice concentration in the MIZ.
Key words: wind wave, IMU, wave PSD, wave attenuation, Barents Sea
1.Introduction
The marginal ice zone (MIZ) refers to the area near the edge of sea ice, with an ice concentration between 15% and 80% (Strong and Rigor, 2013).The MIZ is a key region for interactions between the atmosphere, ocean and sea ice(Williams et al., 2013).The strong interactions that take place in the MIZ affect the atmospheric boundary layer and atmospheric processes.Also, they lead to significant differences between waves in the MIZ and open water (Andreas et al., 1984; Zippel and Thomson, 2016).
Sea ice has a significant impact on waves in the MIZ.When waves penetrate the MIZ, their dispersion and attenuation are different from wave propagation in open water.Previous observational studies have shown that the wave amplitude decays exponentially with distance in the MIZ, and the attenuation rate increases with frequency (Wadhams et al., 1988).The attenuation rate of waves in the MIZ under different weather and wave conditions has been measured in several observational studies.The findings have shown that waves with long wavelengths can penetrate deep into the pack-ice areas of the Southern Ocean (Kohout et al., 2014, 2020; Meylan et al., 2014) and the Arctic MIZ (Collins III et al., 2015).The presence of sea ice also limits the effect of wind on waves, which reduces off-ice wind to generate a significant wave field (Masson and LeBlond, 1989).This means that the momentum flux transferred from the atmosphere to the waves is limited (The WAVEWATCH III® Development Group, 2016).However, in recent field observations, the wave growth was observed under grease ice (Kodaira et al.,2021) and pack ice (Johnson et al., 2021).This means that sea ice cannot completely block the wind.These complex physical processes make wave prediction in the MIZ very challenging.
WAVEWATCHIII (WW3) is a commonly used wave model, developed at the US National Centers for Environmental Prediction in the spirit of the WAM model (The Wamdi Group, 1988; Tolman, 1991; Komen et al., 1994; Tolman et al., 2002; The WAVEWATCH III® Development Group,2016).Through the addition of source/sink terms, WW3 has the ability to work in the MIZ.WW3 treats ice as a continuous cover and scales its attenuation effect linearly by the sea ice concentration (Tolman, 2003; Rogers and Zieger, 2014).On the other hand, the conventional treatment for wind input in partially ice-covered seas is to scale it by the fraction of open water.However, while such scaling may seem reasonable in areas of thick ice cover, it is not so suitable for the pliable thin ice cover often found in the MIZ (Rogers et al.,2016).A recent theoretical study demonstrated that wind waves can be generated under soft ice cover, and the critical factors involved are the ice elasticity and ice thickness(Zhao and Zhang, 2021).Also, the agreement with observations in WW3 is stronger when additional wind input for wave generation is permitted in high concentrations of sea ice (Cooper et al., 2022).The Arctic sea ice is obviously reducing, especially in terms of the sea ice thickness (Li et al., 2022), so adding the sea ice thickness to the wind wave module will help the model cope with the changes of sea ice.
In this paper, we propose a parameterization scheme that includes sea ice thickness to improve the model’s capability to take into account the wind force that acts on the waves under the ice cover.The rest of the paper is organized as follows: In section 2, the new parameterization scheme is described.In section 3, the data and model design are explained.Results are presented and discussed in section 4.Conclusions are given in section 5.
2.The new parameterization scheme
We use WW3 (Version 5.16) in this study, in which the radiative transfer equation used for the spectral energy balance is
whereN=E/σ is the wave action spectral density and σ is the angular frequency;E=E(x,t,θ,σ) is the directional wave spectral energy density at locationx, timetand in the direction θ ; andc=cg+U, withcgandUdenoting the group and current velocity, respectively.The source termSincludes contributions from many mechanisms.Those relevant to the present study are
whereSinis the wind input andSdsis the dissipation due to wave breaking, which are combined in the wind wave module;Snlis the nonlinear transfer between different frequencies; andSiceis the ice source, i.e., the damping caused by the presence of ice cover.Since WW3 was developed for open water, in order to make it suitable for the MIZ,Sin,SdsandSiceare modified by the sea ice concentrationC, andSnlis the same as that in open water.Therefore, in the MIZ,the above equation becomes
The existing parameterization scheme does not explicitly consider sea ice thickness, which means the wind cannot influence the waves in high sea ice concentration areas, even though the ice thickness may be low.
Previous field observations have found that the wave growth can be observed under grease ice (Kodaira et al.,2021).It is generally agreed that the transfer of momentum from wind to waves occurs through normal rather than tangential stresses (Hristov et al., 2003).These normal stresses can be transmitted through deformable sea ice.If the sea ice is an elastic material, then the waves under it are affected by its elasticity (e.g., Wang and Shen, 2010).Also, energy transfer relies on the elasticity of sea ice from wind to wave in the vertical direction.Accordingly, wind can indirectly act on the sea surface through the flexible ice cover and generate wind waves.
However, in the current parameterization scheme, wind waves cannot be generated and break under thin ice.In a study comparing model results with in-situ wave data from the MIZ, it was found that the wave spectra in the model underestimated the observation, especially in the high-frequency band (Liu et al., 2020).Thus, we propose a new wind input scheme according to sea ice thickness, as follows:
Figure 1 shows the new coefficient in different situations.Under the new parameterization scheme, when the sea ice thickness is lower than the area-average sea ice thickness, partial penetration of wind energy through the ice cover is permitted.When the sea ice thickness is higher than the average, the original parameterization scheme applies.This change is particularly significant when the sea ice thickness is particularly small.Meanwhile, β can be adjusted to make it suitable for different sea ice types.Different types of sea ice may exist under the same sea ice concentration,which have different physical properties.A larger β value corresponds to a greater wind energy transfer under the ice cover (e.g., the grease ice) and a smaller β value corresponds to the opposite (e.g., pancake ice or ice floes).We choose β=0.5for this study, which appears to fit the data most reasonably.
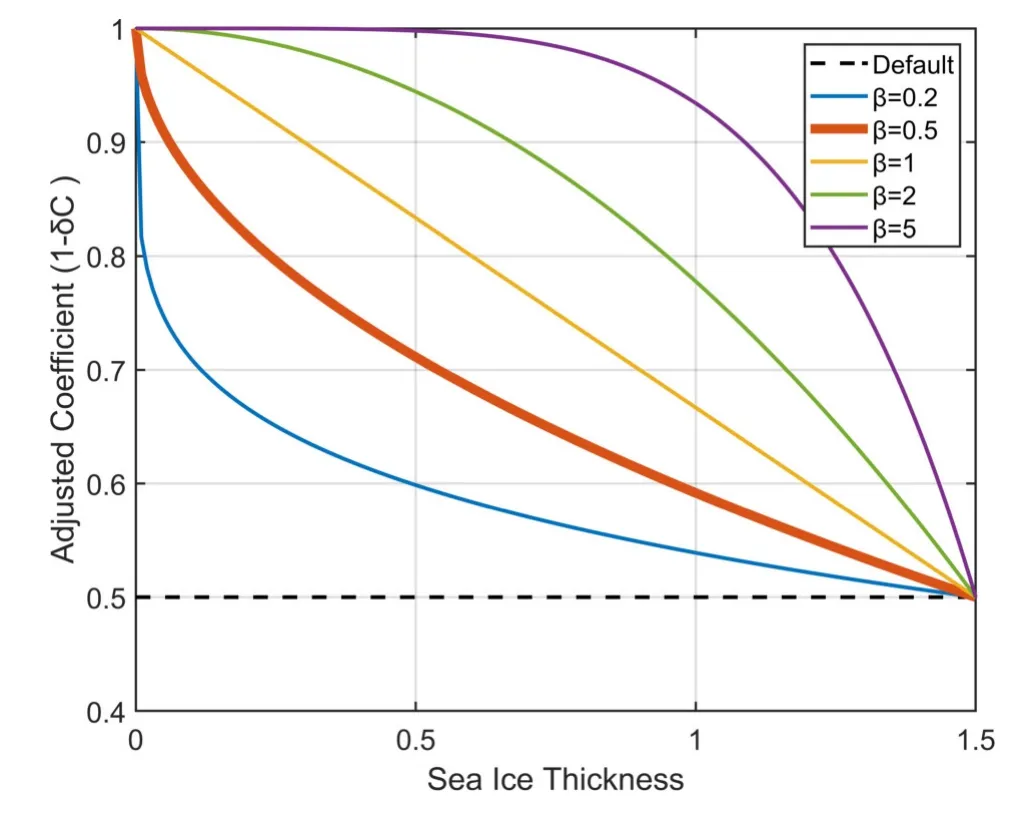
Fig.1.Variation in the adjustment coefficient (1 -δC) with sea ice thickness based on different β when the sea ice concentration is 0.5.The β used in this paper is 0.5 (red line).
3.Data and model design
3.1.Data from the Barents Sea MIZ
Tsarau et al.(2017) deployed several IMUs (inertial measurement units, which can be used to measure acceleration) on ice floes from 0500 to 1300 UTC 5 May 2016 in the Barents Sea.The four IMUs used in the present study were located within (77.17°–77.33°N, 24.85°–25.35°E), as shown in Fig.2.The sea ice concentration at the IMU locations ranged from 20% to 40%, and the average sea ice thickness was 0.3 m.
The raw data provided by the IMUs are acceleration values with a sampling rate of 50 Hz.The power spectral density(PSD) at the four IMU locations of the surface displacement was obtained by integrating the raw data.The wave attenuation between a pair of IMUs at a given frequency was calculated as
where α is the wave amplitude attenuation coefficient,P2andP1are the PSD values of the two IMUs at the same frequency, andDis the projected distance between the two IMUs along the wave direction.Results are shown in Fig.3.The PSD exhibits a single-peak structure with a peak value near 3 m2s and a dominant frequency between 0.1 Hz and 0.16 Hz.The attenuation increases up to 0.18 Hz almost monotonically.
3.2.Model
WW3 provides multiple choices of sea ice modules.In previous work using the same dataset, three modules were studied: IC2, IC3 and data driver module IC4 (Liu and Mollo-Christensen, 1988; Liu et al., 1991, 2020; Wang and Shen, 2010; Ardhuin et al., 2015; Collins and Rogers, 2017).By comparison, it is found IC3 is a suitable theoretical model in the Barents Sea.Therefore, we choose IC3 with parameters calibrated previously for the present study.
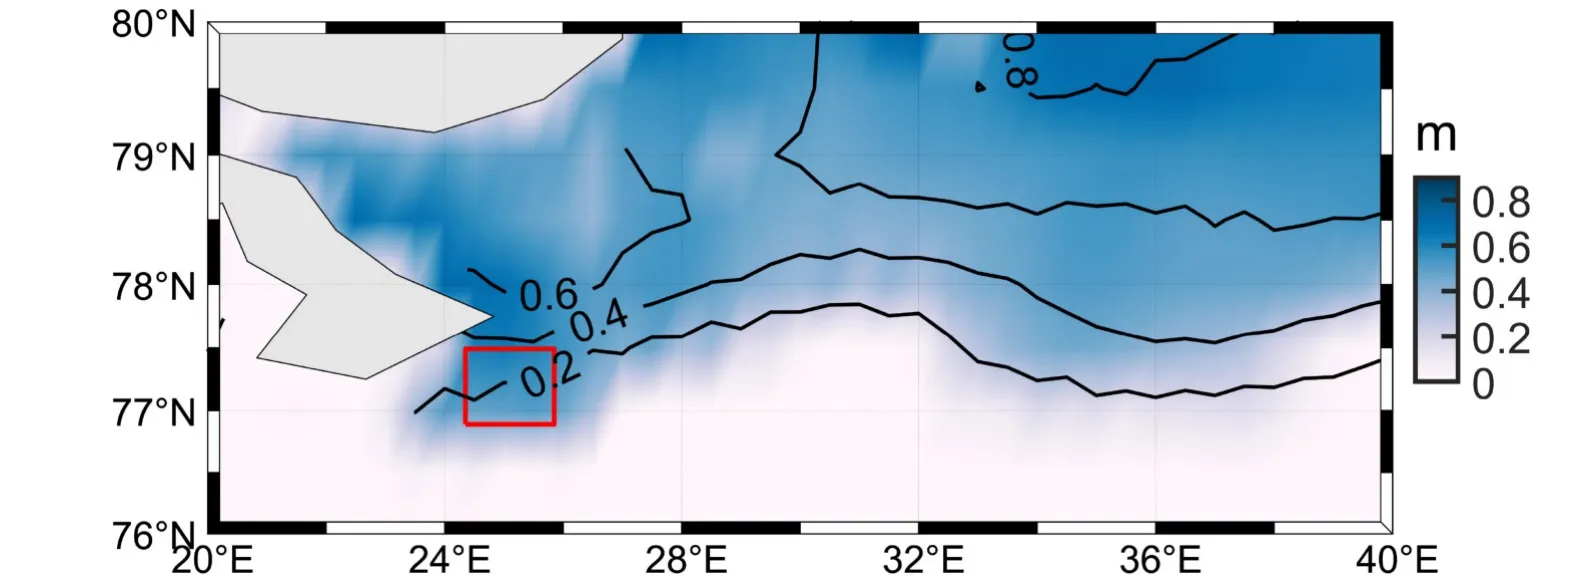
Fig.2.Sea ice thickness from CMST which is a dataset combining satellite remote sensing data and a dynamic ice-ocean model (Mu et al., 2018, background color) and sea ice concentration from National Snow and Ice Data Center(NSIDC, contours) in the study area on May 5, 2016.The red frame outlines the area in which the IMUs are located.
The effective shear modulus (G) and viscosity ( ν) are required by IC3 for simulation, which will directly affect the quality of the results.In order to maximize the simulation capabilities of WW3, the free parameters were calibrated with the IMU data as previously done in Liu et al.(2020).Briefly, an objective function to be minimized is defined as(Cheng et al., 2017)
wherewis the weighting factor:w(f)=S(f)f4, in whichS(f) is the wave spectral density at frequencyfand ////2is theL2 norm of an array.The attenuation coefficient α is calculated from the IMU data andkiis calculated from the model.The norm in the above equation is obtained for each pair of spectral attenuations, α (f) andki(f).The final parameters ( ν= 0.3280 m2s-1,G=31318 Pa) were obtained by a genetic algorithm and Gaussian mixture distribution (Liu et al., 2020).As the sea ice modules and wind wave modules in WW3 are independent and have no interaction, the calibration of the sea ice modules does not affect the wind wave modules.
Figure 4 shows the attenuation results of the IC3 sea ice module and IMU.The thick solid lines are the average, and the thin lines are the results at different times.Each blue line is directly calculated by the IC3 sea ice module according to the parameters at different times.The lines represent the attenuation rate caused by ice at different times.There is no significant difference in attenuation rate between the sea ice module and IMU.In the MIZ, wind and sea ice are the main influences on waves.At present, the attenuation due to sea ice can be well simulated by IC3.Therefore, the reason for the WW3 results being lower than the IMU found in the previous study is likely to be the wind wave modules.
Based on the calibrated model, the wave simulation can begin.The wave model used here is WW3, version 5.16.The simulation domain is (70°–80°N, 10°–40°E), with a 0.25° grid resolution, enclosing the region shown in Fig.2.The domain size is chosen so that the boundary effect does not influence the result over the period of study in the region of interest (76°–78°N, 22°–28°E).
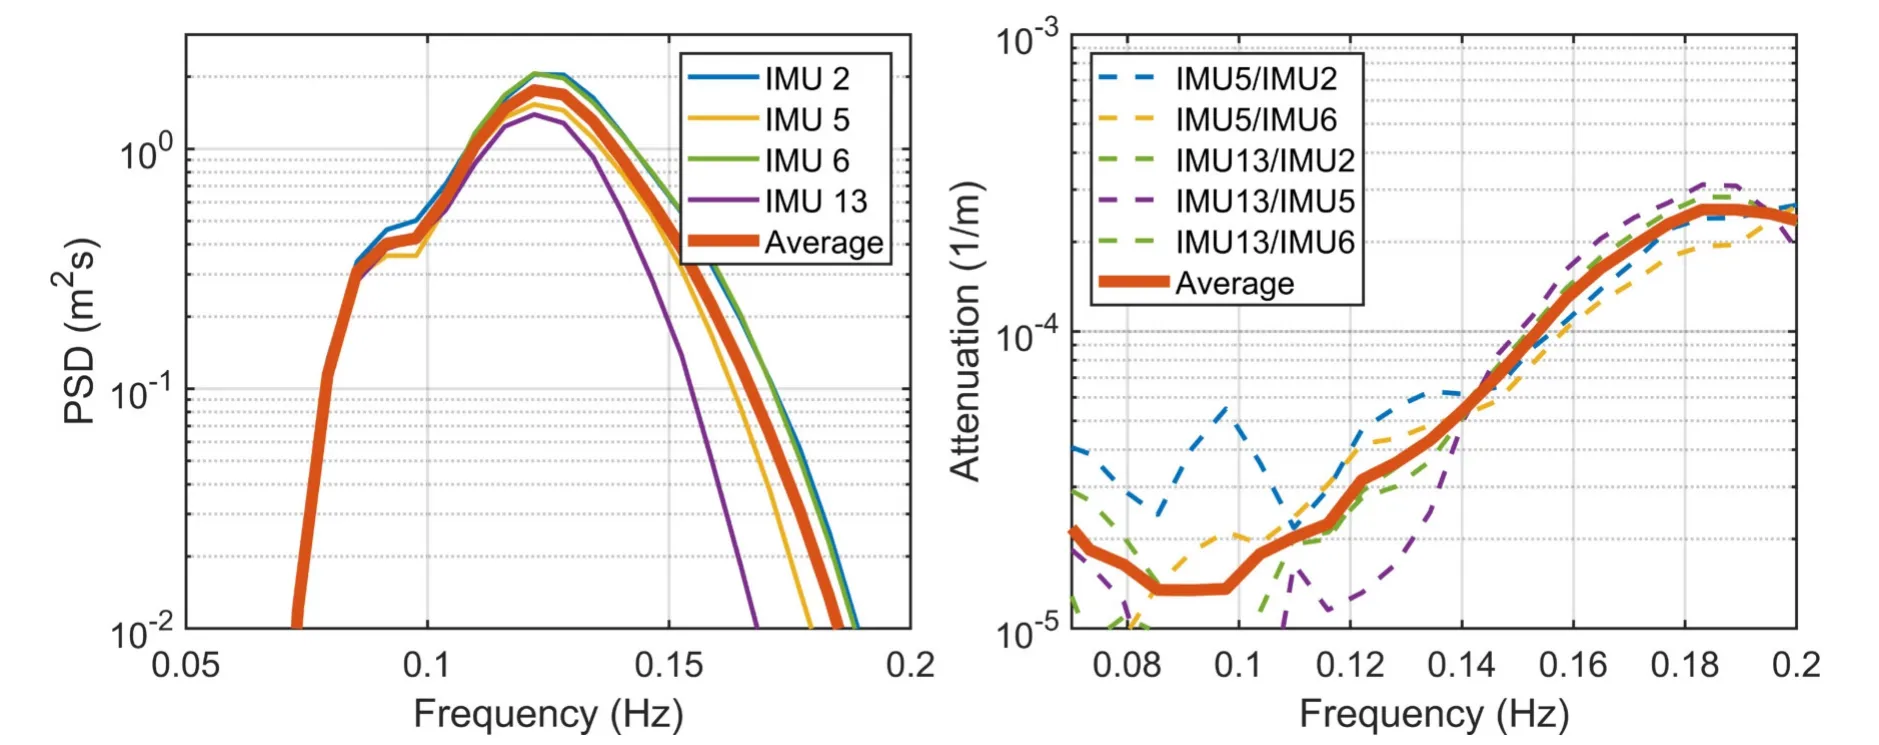
Fig.3.The PSD (left) and attenuation (right) of the IMUs.The red line is the average.
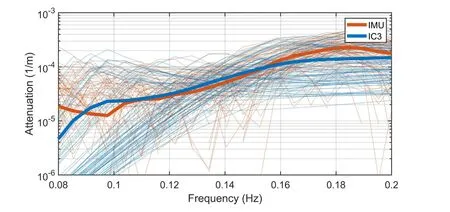
Fig.4.The attenuation results of the IC3 sea ice module (blue) and IMU (red).The thick lines are the average, and the thin lines are the results of different times.
The data for simulating the MIZ waves mainly include wind, sea ice thickness, and sea ice concentration.The wind data used in this study are from ERA5 (https://www.ecmwf.int/en/forecasts/datasets/reanalysis-datasets/era5).The icethickness data are from CMST, which is a dataset combining satellite remote sensing data and a dynamic ice-ocean model(Mu et al., 2018), and the ice-concentration data are from NSIDC (https://nsidc.org/data).Details of these data are shown in Table 1.
Wind is another key factor affecting model accuracy.Figure 5 shows the wind fields obtained from ERA5 at different times at the locations surrounding the IMUs.During the observation time, there was strong wind, with the maximum wind speed reaching 15 m s-1.At this wind speed, the waves under thin ice are likely to be affected by the wind.
4.Results and discussion
Multiple sets of cases are simulated to reveal wind waves under the ice.The WW3 results based on the new parameterization scheme are shown in Fig.6.On the left is the PSD where the IMU is located (the position of the red frame in the right-hand figure), and on the right is the significant wave height.The result of the new scheme is higher in the high-frequency part than the original WW3.In the PSD,high-frequency waves correspond to wind waves.The difference in results means that wind waves in the MIZ are strengthened by introducing the parameterization scheme including sea ice thickness, bringing it closer to the observations.However, despite the introduction of sea ice thickness, the overall PSD is still slightly lower than the observations.Therefore,some important physical processes may still be missing inthe model.The results of significant wave height show that sea ice is still the key factor affecting wave propagation in the MIZ.When a wave propagates into the MIZ, its PSD will be greatly reduced due to the attenuation of sea ice.

Table 1.Coordinates and attributes of the ice floes.
To investigate the basin-wide differences between the new and original scheme, we plot the difference in significant wave height in Fig.7.The difference is mainly concentrated in the area where the sea ice concentration is less than 0.4,with the significant wave height of the new scheme being 0.1 m higher than that of the original scheme.Although this difference of 0.1 m is small, it still has a non-negligible impact in the MIZ.When the wind waves generated in open waters propagate to the MIZ, they will be rapidly attenuated by the sea ice, making it hard for them to propagate long distances.The existence of sea ice causes the MIZ PSD to be concentrated below 0.2 Hz.A wind wave generated in the MIZ is also an important wave energy source.Therefore,the difference caused by wind waves in the MIZ cannot be ignored.
Two additional cases are simulated to explore the impact of the wind forcing on waves in the MIZ.In Eq.(3),the ice concentration C in the wind wave module varies from 0 to 1.In the first case, we setCto 0 in the wind wave module, which means the influence of sea ice on wind is ignored, but its wave attenuation effect is considered.We denote this as “on case”.In this case, the growth and breaking of waves are exactly the same as in open water, which corresponds to the maximum value of wind waves in the MIZ.In the second case, we setCto 1, which means there is no wind input or dissipation due to wave breaking at all.Again,the attenuation is kept the same as in Eq.(3).We denote this case as “off case”, where the waves in the MIZ will not gain additional energy due to wind.In this case, attenuation caused by sea ice is the only effect on MIZ waves, which is mainly composed of swells from open water.Thus, we can find the minimum value of waves and determine if wind waves are an important component.
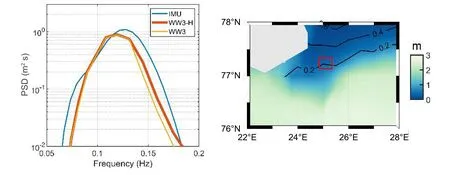
Fig.6.The PSD (left) and significant wave height (right; the black contours are the sea ice concentration) of WW3 based on the new parameterization scheme.The blue line is the IMU; the yellow line is the original WW3 result; and the red line is the new WW3 result.
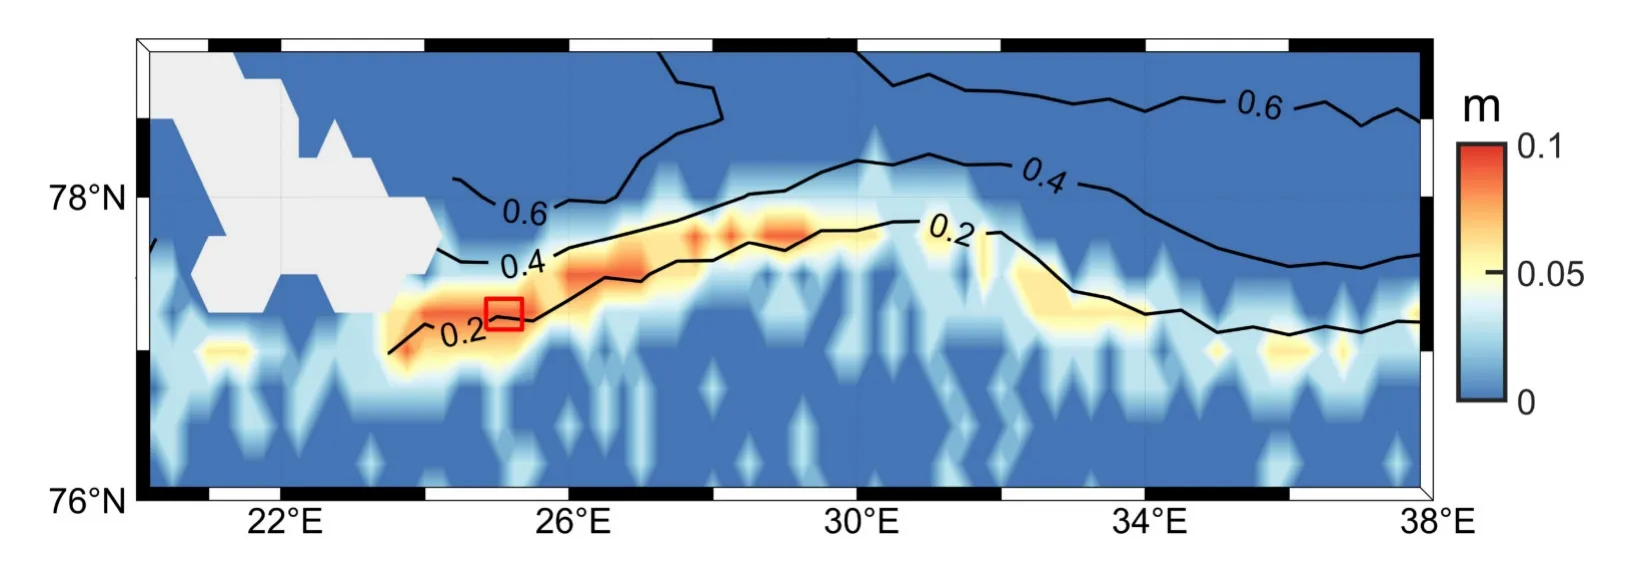
Fig.7.Difference in significant wave height between the new and original scheme.The black contours are the sea ice concentration.The grey region in the top-left corner is land.
The results of the “on case” are shown in Fig.8.On the left is the PSD, from which we can see that the result in the high-frequency part is significantly higher than the original,but still lower than the IMU, which means the reason for the lower model result does not entirely derive from the wind wave module.One of the reasons for this discrepancy may be due to the floe size and sea ice type.Although the WW3 model uses sea ice thickness and sea ice concentration, the sea ice type and floe size are still missing.The floe size in the Barents Sea is small compared to the wavelength.Also,the overestimation of the model on the sea ice effect may lead to the smaller PSD.The type of sea ice is also an important factor.The physical properties of different sea ice types vary widely, which can also cause bias in the simulation results.Limited by the observational data, progress in investigating these mechanisms is difficult.Another possible reason is the constant parameters used in the sea ice module.The parameters do not vary with time and space, which means that during the simulation, sea ice attenuation may be too high in areas with low sea ice concentration, and too low in areas with high sea ice concentration.This will cause the PSD to be lower at the IMU locations.The last possible reason is the nonlinear transfer term (Snl), which represents the process of transferring high-frequency energy to low-frequency energy.TheSnlin the current model was developed in open water, and its applicability in the MIZ remains to be studied.In addition, wind and ice data can also cause errors.The right-hand figure is the difference between the fully opened wind wave module and the original module.Similar to the results in Fig.7, the difference is still concentrated between a sea ice concentration of 0.2 and 0.4, but the difference in significant wave height can reach 0.2 m.
In the second case, the wind wave module is completely turned off in the MIZ.The results of this “off case” are shown in Fig.9.The PSD is shown on the left-hand side, in which the red line represents the turned-off wind wave module result.This result is significantly lower than the original model and IMU, suggesting that the wind wave module in the MIZ is an important component of the model.There are still abundant wind waves in the MIZ, and they constantly transfer energy to low-frequency swells.The difference between the low-frequency waves in the results and the original model is small, which corresponds to the swells propagating into the MIZ from the open water.The figure on the right shows the difference in significant wave height between the original module and the “off case”, which is particularly evident in the area with low sea ice concentration.However, this difference disappears when the sea ice concentration is greater than 0.4.This suggests that wind waves in the original model exist only in areas with lower sea ice concentration.
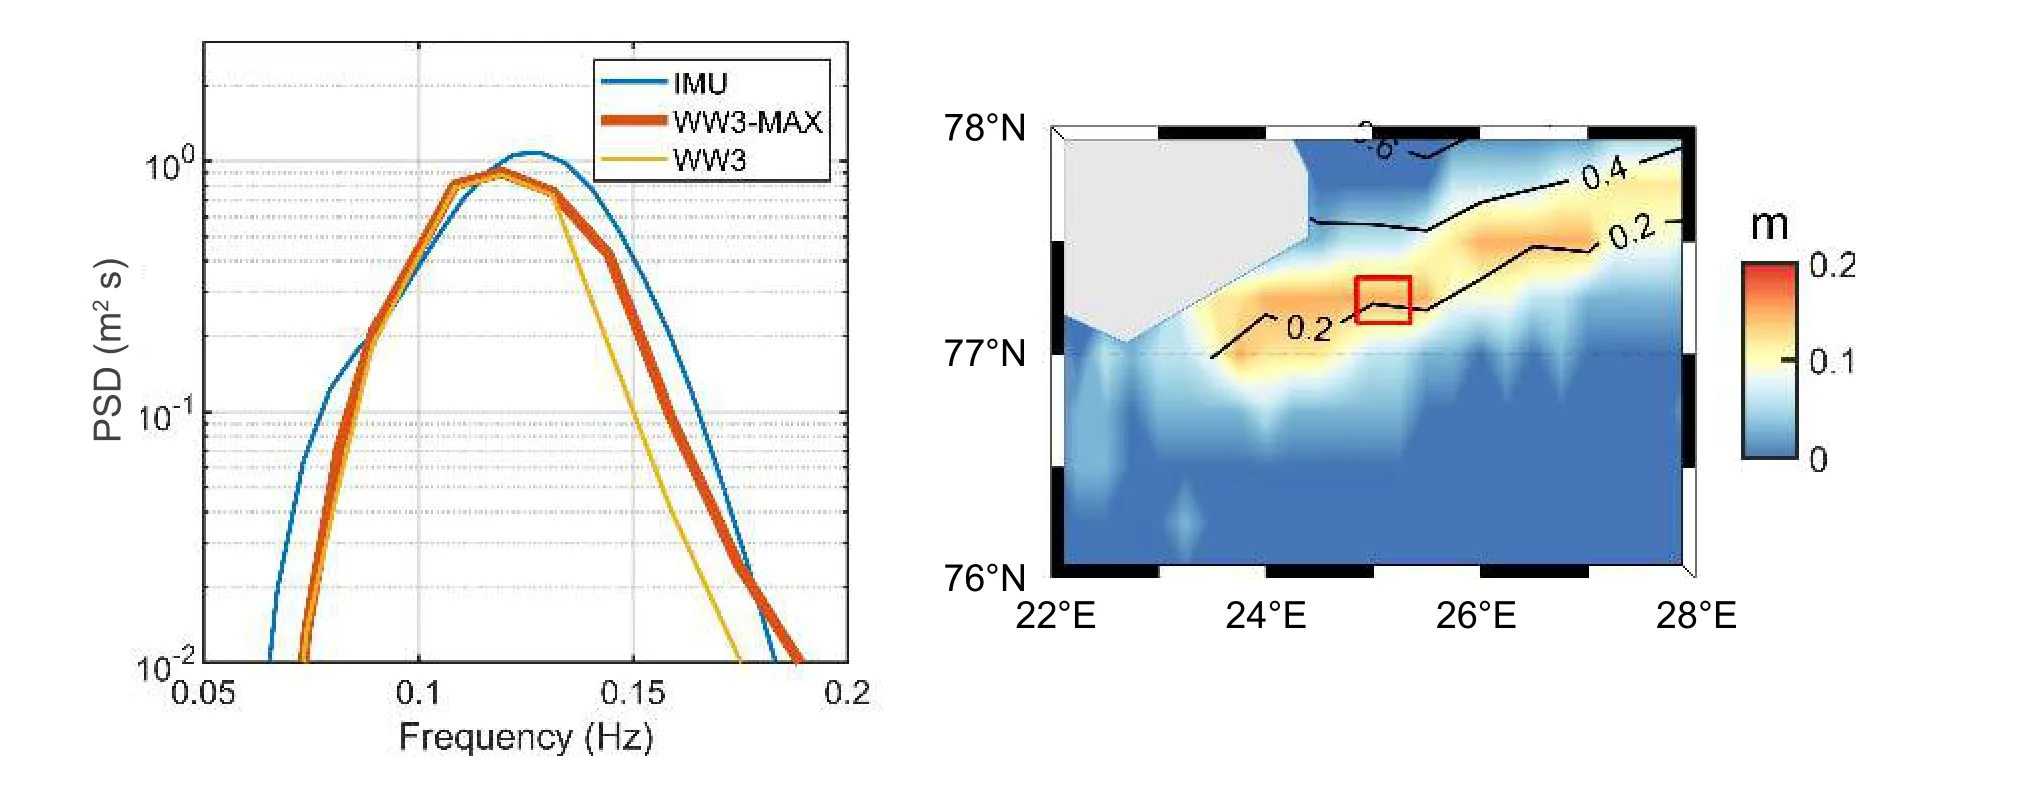
Fig.8.The PSD (left) and significant wave height difference (right) of the fully opened wind wave module in the MIZ.The blue line is the IMU; the yellow line is the original WW3 result; and the red line is the fully opened wind wave module result.
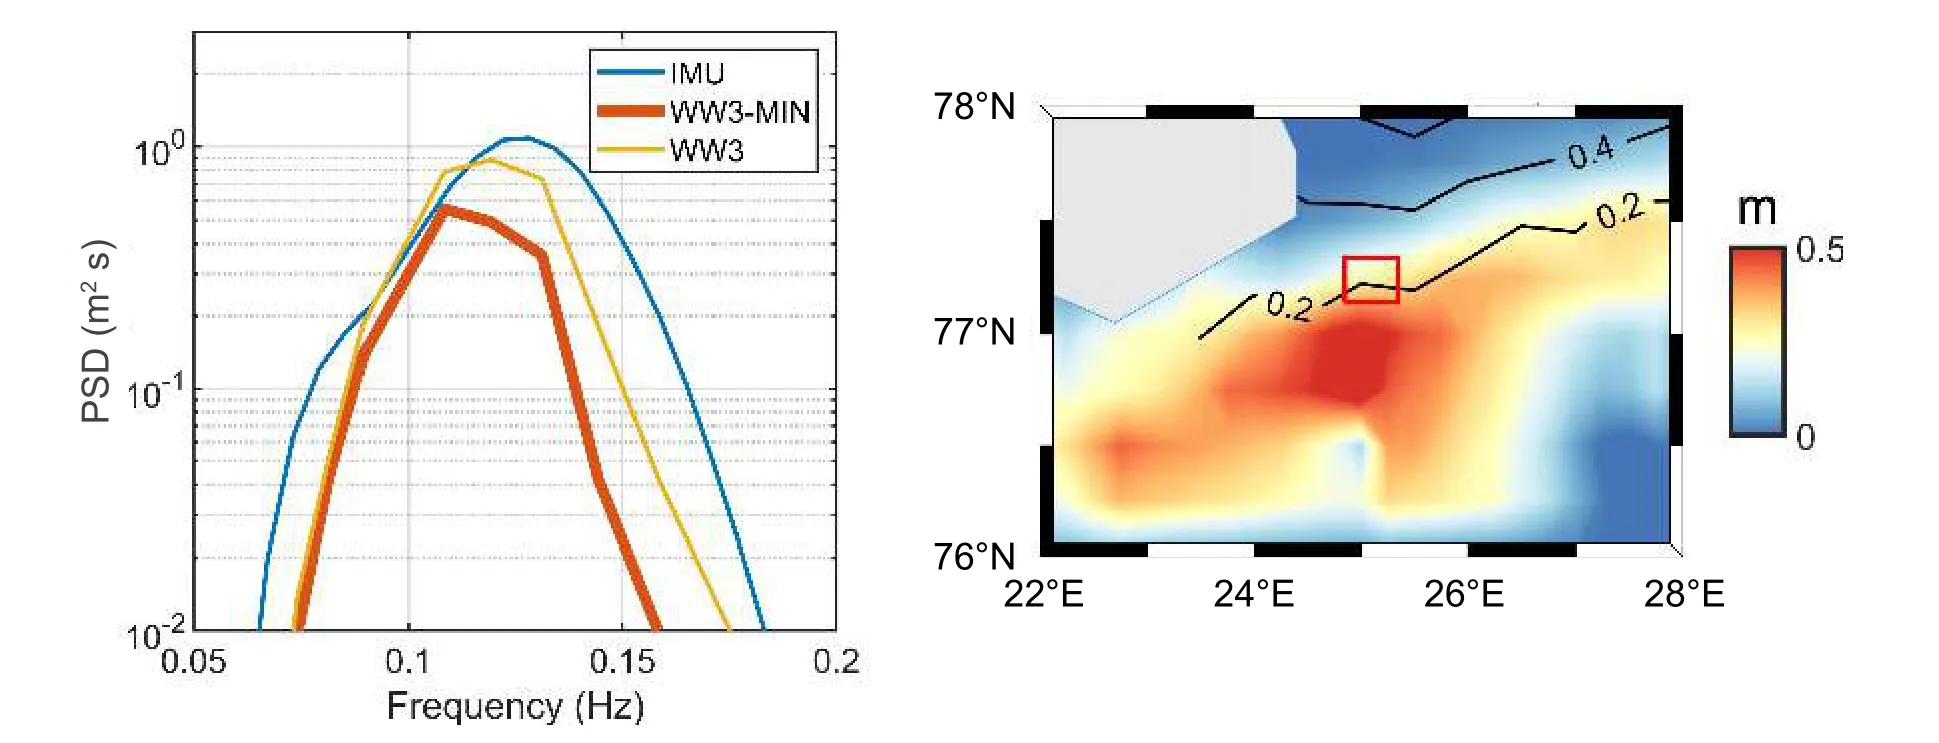
Fig.9.The PSD (left) and significant wave height difference (right) of the turned-off wind wave module in the MIZ.The blue line is the IMU; the yellow line is the original WW3 result; and the red line is the fully turned-off wind wave module result.
The application of the new parametric scheme allows wind wave generation under an ice cover, which has been observed in the field.It improves the wind wave simulations in the MIZ, especially in the high frequency part of the wave spectrum.However, the model still has obvious room for improvement.Due to the lack of accurate wind data, we cannot quantify the impact of sea ice thickness on wind and it is not clear how thick ice needs to be to completely block the wind energy.In a future study, we will add sea ice elasticity to the parameterization scheme to improve the modeling and conduct laboratory work to establish a more accurate parameterization scheme.It is also expected that more field observations and data for waves and local winds in the MIZ will be available to verify the accuracy of our scheme.
5.Conclusion
In this study, we propose a parameterization scheme for wind wave modules that explicitly includes the sea ice thickness.In this new scheme, a parameter δ is introduced to allow partial wind input and dissipation through the ice cover.This parameter is currently formulated to be dependent on ice thickness only.The new scheme improves the current model’s capability to simulate wind waves in the MIZ, and enhances the high-frequency part of the PSD.The difference is mainly concentrated in areas where the sea ice concentration is low.Compared with observations, the result of the new scheme is closer to the IMU in the high-frequency part,but its overall energy is still lower than observed.This discrepancy may be due to the lack of sea ice type and floe size in WW3.The errors may also come from further missing physics set as constant parameters in the present sea ice module, and optimization of the nonlinear transfer term in the MIZ is required.Further, the wind and ice data used in WW3 may also bring additional uncertainties.In addition,this study also discusses the extent of influence of the wind wave module in the MIZ.Through sensitivity modeling experiments with and without the wind wave module, it is found that the modeled wind waves are mainly generated in the area with low sea ice concentration, and cannot propagate to the area with high sea ice concentration.
Acknowledgements.This study was funded by the National Key R&D Program of China (Grant No.2022YFE0106300), the National Natural Science Foundation of China (Grant Nos.41922044, 42106226 and 42106233), the Fundamental Research Funds for the Central Universities (Grant No.3132023133), the China Postdoctoral Science Foundation (Grant No.2020M683022),the Guangdong Basic and Applied Basic Research Foundation(Grant No.2020B1515020025), and the fundamental research funds for the Norges Forskningsråd.(Grant No.328886).The authors would also like to thank the Research Council of Norway for financial support through the research project “Multi-scale integration and digitalization of Arctic sea ice observations and prediction models (328960)” and basic funding for research institutes.
杂志排行
Advances in Atmospheric Sciences的其它文章
- The Arctic Sea Ice Thickness Change in CMIP6’s Historical Simulations※
- The Influence of Meridional Variation in North Pacific Sea Surface Temperature Anomalies on the Arctic Stratospheric Polar Vortex※
- Influence of Surface Types on the Seasonality and Inter-Model Spread of Arctic Amplification in CMIP6※
- Evaluation of the Arctic Sea-Ice Simulation on SODA3 Datasets※
- Simulations and Projections of Winter Sea Ice in the Barents Sea by CMIP6 Climate Models※
- Arctic Sea Level Variability from Oceanic Reanalysis and Observations※
