Automatic recognition of defects in plasmafacing material using image processingtechnology
2023-12-18JianhuaLYU吕建骅ChunjieNIU牛春杰YunqiuCUI崔运秋ChaoCHEN陈超WeiyuanNI倪维元andHongyuFAN范红玉
Jianhua LYU (吕建骅) ,Chunjie NIU (牛春杰) ,Yunqiu CUI (崔运秋) ,Chao CHEN (陈超) ,Weiyuan NI (倪维元),* and Hongyu FAN (范红玉)
1 School of Electrical Engineering,Dalian University of Technology,Dalian 116024,People’s Republic of China
2 School of Science,Jiangnan University,Wuxi 214122,People’s Republic of China
Abstract Observing and analyzing surface images is critical for studying the interaction between plasma and irradiated plasma-facing materials.This paper presents a method for the automatic recognition of bubbles in transmission electron microscope(TEM)images of W nanofibers using image processing techniques and convolutional neural network(CNN).We employ a three-stage approach consisting of Otsu,local-threshold,and watershed segmentation to extract bubbles from noisy images.To address over-segmentation,we propose a combination of area factor and radial pixel intensity scanning.A CNN is used to recognize bubbles,outperforming traditional neural network models such as AlexNet and GoogleNet with an accuracy of 97.1%and recall of 98.6%.Our method is tested on both clear and blurred TEM images,and demonstrates humanlike performance in recognizing bubbles.This work contributes to the development of quantitative image analysis in the field of plasma-material interactions,offering a scalable solution for analyzing material defects.Overall,this study’s findings establish the potential for automatic defect recognition and its applications in the assessment of plasma-material interactions.This method can be employed in a variety of specialties,including plasma physics and materials science.
Keywords: image processing,automatic defect analysis,object detection,convolutional neural network
1.Introduction
Tungsten (W) is a commonly used plasma-facing materials(PFMs) in fusion reactors,subject to high flux and low energy helium (He) plasmas during operation [1].This exposure can induce the formation of a fragile nanofiberlike crystalline structure known as ‘fuzz’ on the surface of W at temperatures of 1000-1900 K.The formation of this nanostructure contains many helium bubbles,which play a crucial role in inducing the surface modification of PFMs[2-4].Rate theory (RT) and molecular dynamics (MD)simulations are useful for gaining insight into these modifications [5-8].However,modeling nanoscale modifications of PFMs necessitates a significant amount of experimental data.The behavior,size,geometry,and distribution of the bubbles are critical to making accurate assumptions and validating the model.While scanning electron microscopy (SEM),atomic force microscopy(AFM),and transmission electron microscopy (TEM) are common techniques used for nanoscale imaging,they may generate blurry images and adversely impact observations[9-11].Additionally,analyzing these images by human experts can introduce the risk of artificial errors in data interpretation[11,12].Therefore,intelligent algorithms that can stably and reproducibly analyze experimental images are vital for producing simulations that realistically replicate physical processes.
In recent years,machine vision and deep learning algorithms have demonstrated promising results and are increasingly used across various fields of materials science [13-17].In particular,convolutional neural network (CNN) has been used for defect recognition in clear images.Several studies have reported on the use of machine learning algorithms such as Mask R-CNN,Faster R-CNN,and Yolo for the detection of dislocation loops,vacancies,and other defects in materials[14-16].However,these algorithms have not been widely used for PFMs that are exposed to fusion plasma and are subject to significant deformation.Although Roessel et al have used CNN to study time-resolved information of blister evolution in Mo,their proposed CNN model relied on manually-identified results,and bubbles are easily identifiable in their in situ observations of the sample [17].As a result,there is still a need for algorithms that can accurately and automatically detect defects in complex background images of PFMs.
In this paper,we present a hybrid approach combining image processing techniques and a CNN model to extract bubbles from varied TEM images with complex backgrounds.Our proposed method includes a fused three-stage approach that utilizes Otsu,local-threshold,and watershed segmentation to extract bubbles from noisy images.In addition,we propose a combination of area factor and radial pixel intensity scanning to address issues of over-segmentation.Subsequently,we train our proposed CNN model to accurately recognize the extracted bubbles,achieved through meticulous hyperparameter tuning optimization.Our approach significantly improves the accuracy and efficiency of bubble recognition in TEM images of W nanofibers,paving the way for more automated recognition and further analysis of nanoscale images in the future.
2.Data acquisition and the method of image processing
2.1.Data acquisition
In this study,the polycrystalline W materials are exposed to He plasmas in an inductively coupled plasma (ICP) at 1300 K.He ion irradiations are performed at 50 or 200 eV,with a flux of 1.4×10²²m-2s-1.The TEM image of the W nanofibers used is analyzed in our previous work[18],where the W nano-fuzz is wiped off from the surface and observed using H-9000UHR TEM.
2.2.Image processing for bubble extraction in TEM image of W nanofibers

Table 1.Detail of CNN training date.

Figure1.Flow diagram of automatic recognition for bubbles in W nanofibers.
The process of bubble recognition involves noise filtering,binary segmentation,and CNN recognition,as shown in figure 1.To determine the CNN kernels and morphological operations,small snippets of 128×128 pixels are extracted from a larger TEM image and analyzed individually.All snippets are divided into two datasets:‘clean’(D1)and‘blur’(D2) based on quality.A snippet is classified as a ‘fuzzy’ set if two or more nanofibers overlapped,or the grayscale intensity difference between the bubble and the background is not clear.On the other hand,a snippet is classified as a‘clean’set if there is no overlapping and the grayscale intensity difference is clear.Details about the datasets are shown in table 1.All the parameters mentioned in this paper are adjusted for the D1,while the D2 is only used for the final test.
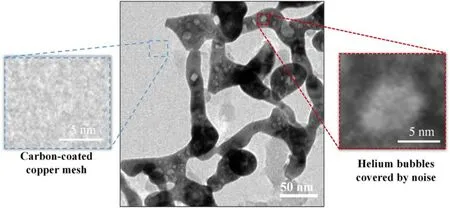
Figure2.Noise analysis of TEM image.Under the observation of TEM,the image of copper mesh and high-frequency noise will be superimposed on the W nanofibers.

Figure3.TEM image(a)before and(b)after using Gaussian filter,the high-frequency noise is eliminated by low-pass filter.Thumbnails are their frequency domain images.
2.2.1.Noise filtering in origin image.In low-magnification TEM images,identifying bubbles in nanofibers can be challenging due to high-frequency noise and the presence of copper mesh.Figure 2 depicts the uneven color and blurred boundary of a bubble influenced by the noise.
To improve bubble detection,a Gaussian low-pass filter[19] is utilized to enhance the edge of bubbles.The purpose of applying the Gaussian filter is to reduce noise and eliminate unnecessary image details,thus ensuring the integrity of the extracted bubbles during the segmentation process.As the Gaussian filter can be applied to images in the frequency domain only,the image is transformed using the Fourier transform.The Gaussian filter with a standard deviation of 20 is employed which filtered out most of the high-frequency noise and the overlapping copper mesh in the image.This is demonstrated in figure 3.The Gaussian low-pass filter is given by the formula:
where u and v represent the horizontal and vertical coordinates of the pixel,respectively.D is the distance between the pixel and the frequency center,and D0is the standard deviation.
2.2.2.Bubble binary segmentation and boundary fitting.Binary segmentation is a standard method to remove the background from an image,leaving only the targets.This method depends on the difference between the grayscale intensity of background and the target.Segmenting bubbles in TEM images is still tricky after using the Gaussian filter because some regions in the bubbles have gray values similar to nanofibers.Therefore,the adaptive histogram equalization[20]are employed before segmentation so that every pixel of the bubble has an analogous grayscale intensity.
A combination of Otsu segmentation [21],local-threshold segmentation [22],and watershed segmentation [23] is implemented to obtain all possible bubble segments.These segments are then superimposed to address the problem of oversegmentation,as shown in figure 4.To perform the segmentation,Otsu segmentation recognized apparent and larger bubbles,whereas local-threshold segmentation segmented bubbles with low contrast.The watershed segmentation technique is used to identify adjacent and tiny bubbles,and morphological reconstruction [24] with different kernel sizes is conducted to obtain the foreground and background of the image.
After the segmentation of irregular boundaries of bubbles,a least square fit is applied to obtain an ellipticlike edge.During superimposition,some bubbles might fuse and be fitted into a single bubble,as shown in figure 5.
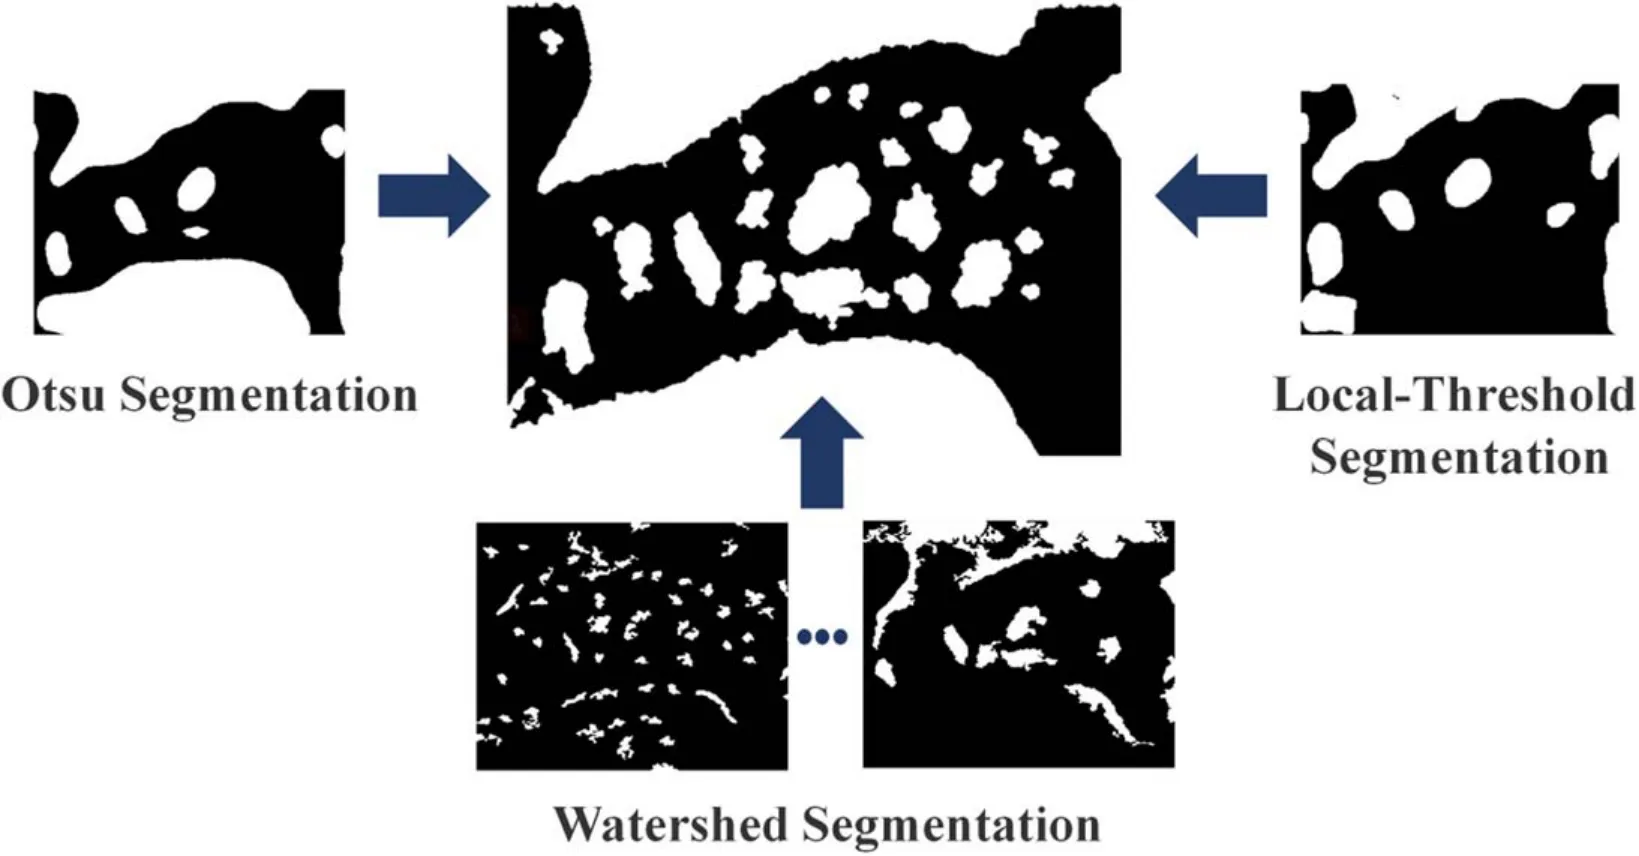
Figure4.Image segmentation and fusion process.Three segmentation methods are used to extract bubble edges of different sizes.All binary images are superimposed to form the middle image.

Figure5.Example of bubble edge extraction and fitting process.(a)Individual bubble is correctly segmented and fitted.(b)Adjacent bubbles are incorrectly segmented and fitted into a single bubble.
Moreover,in 2D images,some bubbles that are independent in 3D space may be superimposed and similarly resulting in bubble fusion.To identify these fusion errors,we introduced the area factor.The area coefficient responds to the relationship between the fitting area and the binary area.A bubble with the correctly segmented boundary resulted in the smallest area factor,whereas a bubble with a wrong boundary segment indicated a larger area factor as per its difference from the binary image.The definition for area factor is:
where S1is the bubble size of the binary image,S2is the bubble size of the fitting image,and S is the total size of the image.
In the next step,radial pixel intensity scanning is implemented to increase the accuracy of identifying fusion errors,as shown in figure 6.The quantity of minimum in pixel intensity distribution in a single bubble is less than three,whereas it is more than three in adjacent bubbles.Upon identification of a bubble as a segmentation fault,the adjacent bubble is removed from the original image,and the segmentation process is repeated.The utilization of the area factor and radial pixel intensity scanning technique ensures the accurate separation of fusion bubbles into two distinct and independent bubbles.However,it is important to note that defining the fusion of extremely small bubbles,with a radius less than 1.5 nm,can pose challenges and may introduce potential errors.

Figure6.Example of bubble radial line scanning process.The yellow circles are the bubble edges.The scanning direction follows the blue or red arrow,and the intensity of each pixel on the scanning line is plotted.The pixel intensity distributions of (a) single bubble and the (b)adjoin bubble,which have different quantity of minimum.

Figure7.CNN architecture with three convolution and max-pool layers,and two dense layers.
2.2.3.Convolutional neural network.Convolution neural network (CNN) is a feedforward neural network widely used in face recognition and object detection [25].In our work,CNN is used as a filter to screen correctly segmented bubbles.This network includes an input layer,a hidden layer,and an output layer.The convolutional network structure is shown in figure 7.
Before entering the network,the input TEM images are normalized and resized using bilinear interpolation to avoid distortion.In the hidden layer,convolution kernels of different sizes can move and convolve in the image to extract features.These image features are sent to the max pooling layer to preserve valuable information and reduce its size[25].After convolution,the images are sent to the dense layer for classification.
In this paper,the CNN model is trained by stochastic gradient descent with momentum (SGDM) on Intel Xeon Platinum 8375C by 100 training epochs,and the learning rate is 0.01.The performance of CNN plays a crucial role in its performance.Different convolution kernel sizes K=[16 32 64] for three convolution layers are combined in our work to achieve the best performance.Specifically,each kernel size is selected from matrix K and results in a total of 27 (33)different CNN architectures.The training data of CNN are listed in table 1.The accuracy comparison of different architecture is shown in figure 8.The formula for accuracy is:
where P is the quantity of positive and N is the total quantity.
The No.12[32 32 16]combination has the best accuracy for bubble recognition.The training process of No.12 as shown in figure 9,the accuracy and loss of this architecture tends to be smooth at half of the training process.This indicates that the network fits well with the training set and maintains an accuracy of over ninety percent on the dataset used in this paper.
Figure 10 presents the hyperparameters calculated by the best (No.12),the baseline (No.2),and the worst (No.10)CNN architectures.The formulas for hyperparameters are:
where TP is the quantity of true positive,P is the quantity of positive,N is the total quantity.
To test the neural network’s applicability,we apply it to the D1 and D2 datasets.As shown in figure 10,the hyperparameters of No.12 and No.2 are higher than 95%for both datasets,while No.3 performs worse in the untrained dataset D2 than in the trained dataset D1.This result shows that our proposed CNN architecture can identify bubble snippets of low-definition,even in an untrained dataset.
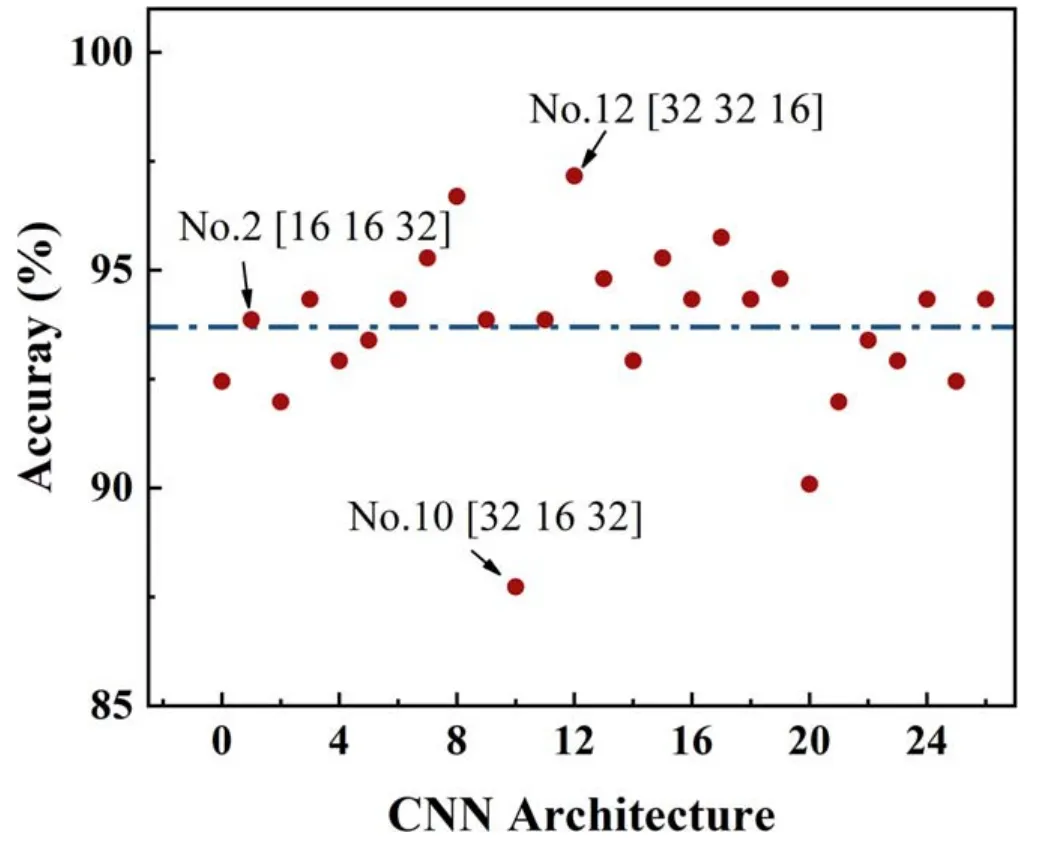
Figure8.The accuracy comparison of different convolution kernel combinations,of which No.12[32 32 16]has the best accuracy and No.10[32 16 32]has the worst accuracy.The accuracy of No.2[16 16 32] is close to the average (blue line).The combination of convolution kernels is shown in the bracket.
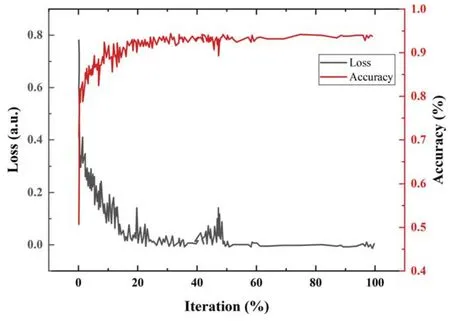
Figure9.The accuracy and loss of CNN model (No.12) during training.
The segmented bubbles in section 2.2 are cut from the original image and are imputed into CNN to filter.Only the image identified as a bubble by CNN can be marked and retained.Figure 11(a)shows the original image.Figures 11(b)and (c) show the binary images before and after recognition,respectively.Figure 11(d) shows the edges of all bubbles displayed in the original image.
3.Result comparison and presentation of image processing
This section presents the results showing the applicability of our methods for different datasets in table 1.The CNN and bubble segmentation are two critical parts of our algorithm.To evaluate their performances,we compare their results with other methods separately.
3.1.CNN comparison of different structures in bubble identification
Since CNN’s success in the classification field,many highperformance classification models have been proposed,such as AlexNet [25],VGG [26],GoogleNet [27],ResNet [28],etc.Here,we choose two classic networks,AlexNet and GoogleNet,for comparison.Transfer learning can reuse then for bubble recognition.
The test and training sets of the two classical networks are consistent with those of our algorithm.The two networks’input and hidden layers are retained,and only the dense layer is modified to binary classification.In table 2,we present the performance comparison of the three networks.GoogleNet has an accuracy of 0.9257,and AlexNet has an accuracy of 0.9350 during the training.
Despite their high training accuracy,the two classic networks performed poorly on the test set.AlexNet’s recognition is more accurate than GoogleNet,but its recall and accuracy could be better,and it is obviously not applicable in the D2.Our CNN architecture outperformed the two classic networks on different datasets,achieving recall and accuracy rates of over 0.98 with nearly zero classification errors.The result shows that our CNN architecture can accurately recognize bubbles in tungsten nanofibers,as shown by the high F1-score in table 2.The size and number of convolution kernel mismatch may cause a difference in network performance.The results of the present study clearly support that fixing the number of convolution kernels to 68 and 128 enables CNN to achieve the best performance [29].
3.2.Bubble shape recognition
To verify the algorithm’s recognition accuracy,we created five phantom images of varying quality for testing purposes.These virtual images consist of bubble layers overlaid with clean tungsten layers.It is important to note that these phantom images are appropriately filtered to ensure the absence of potential bubbles.
Figure 12 presents the phantom images before and after identification using our algorithm.We found that the majority of the phantom bubbles are accurately identified.However,due to blurriness,some bubbles may not precisely match in size.We have provided an accuracy assessment of figure 12 in table 3.While most of the recognized bubbles correspond to phantom bubbles(true positives),there are instances where the recognized area significantly differs from the actual area,and the tungsten substrate is incorrectly identified as a bubble(false positives).
Based on these results,we can conclude that our algorithm achieves a recognition accuracy of over 90% when applied to a clean TEM dataset.These findings validate the robustness of our approach.

Table 2.Hyperparameters comparison of GoogleNet,AlexNet,and our CNN for testing the D1 and D2 dataset.

Figure10.Comparison of precision and recall for the best,baseline,and worst CNN architecture from figure 8.The results are grouped by(a)D1 and (b) D2.

Figure11.(a)Original TEM image,(b)original TEM image after binarization,(c)fitting image recognized by CNN,(d)original TEM image with fitted bubble edge.

Figure12.The recognition results of phantom images.All identified bubbles are represented by colored edges.Table 3 summarizes the accuracy assessment of the five images.
Figure 13 presents the bubble’s shape identification for the different datasets of real images.The bubble recognition algorithm run on a laptop with an Intel core i7-7700HQ CPU@2.8 GHz without GPU acceleration.Each image,similar to figure 2,takes about 40 s to process with this algorithm,which is significantly faster than manual processing time.Figure 13 shows that our algorithm can identify most bubbles in various nanofiber TEM images,including large bubbles with a radius greater than 8 nm,while avoiding over-segmentation.The lower recognition accuracy observed in the real image,in contrast to the phantom image,can be primarily attributed to the increased complexity inherent in real images.

Table 3.Results of the accuracy assessment of the bubble recognition of figure 12.

Figure13.Partial recognition results of D1 and D2 datasets.The original images are shown in(a1)and(b1).The color edges of bubbles and their areas are marked on the (a2) and (b2).
The image quality and the difficulty of defect extraction are different between the D1 and D2 datasets.The D2 dataset in particular has larger overlap areas and closer bubbles,increasing the risk of false positives.Therefore,to demonstrate the effectiveness of our algorithm,we compare our results with the manual results by using the section function in the NanoScope analysis software.
Figure 14 shows the bubble size distributions obtained from the manual result and our result.The manual results considered only bubbles with a radius greater than 1.5 nm.As shown in figure 14(a),the size distribution for the D1 dataset is similar between our algorithm and the manual results,with a slight increase in the fraction of bubbles with radii between 1 and 1.5 nm in our algorithm.However,for the D2 dataset(figure 14(b)),there is a deviation between the two results.We attribute this difference to two main possible reasons.Firstly,our algorithm identified several times more bubbles than the manual result,suggesting that the noise and uneven gray level in the original TEM image may interfere with the recognition of human experts,particularly in D2.This is why our algorithm identified more vague,tiny bubbles between 1 and 1.5 nm that are ignored in manual statistics,reducing the average bubble size.Secondly,the manual results classified adjacent bubbles as a single bubble,increasing the average bubble size.To counteract this,our method in section 2.2 of the paper reduces false positives in the algorithm.Thus,the limitations of manual identification can explain the differences observed in the bubble size distributions between our algorithm and the manual results.In any case,the size distributions obtained by the algorithm closely align with the manual ones,indicating the feasibility of employing efficient algorithms in lieu of laborious manual statistical analysis.
There are three limitations of present work.The first limitation is that a large TEM image needs to be manually segmented into snippets of size 128×128 pixels.Secondly,the proposed algorithm utilizes morphological operations,which require extensive testing to determine optimal kernel sizes when applied to different materials or defects.Hence,these parameters must be reset when the algorithm is applied to a new material or defect.Finally,the means to fix over-segmentation in the paper (area factor and radial pixel intensity scanning) is applied to some close bubbles,and some bubbles in the fusion process are still difficult to distinguish.Therefore,there is a need to optimize the entire process to achieve better results.
4.Summary
In conclusion,this paper introduces a novel method for the automatic recognition of bubbles in TEM images of W nanofibers using hybrid image processing and CNN.Our three-stage approach,coupled with a combination of area factor and radial pixel intensity scanning,effectively addresses the challenge of over-segmentation.Moreover,the proposed CNN outperformed traditional neural network models such as AlexNet and GoogleNet,achieving an accuracy and recall of 97.1% and 98.6%,respectively.
Our approach demonstrated reliable and human-like performance in recognizing bubbles in both clear and blurred images,offering a scalable solution for analyzing material defects.The findings of this study establish the potential of automatic defect recognition and its applications in the assessment of plasma-material interactions,with relevance to industries such as plasma physics and materials science.Our proposed method contributes to the development of quantitative image analysis in the field,paving the way for more advanced techniques and applications in the future.
Acknowledgments
This work is supported by the National Key R&D Program of China (No.2017YFE0300106),Dalian Science and Technology Star Project (No.2020RQ136),the Central Guidance on Local Science and Technology Development Fund of Liaoning Province (No.2022010055-JH6/100),and the Fundamental Research Funds for the Central Universities(No.DUT21RC(3)066).
猜你喜欢
杂志排行

Plasma Science and Technology的其它文章
- Physics design of 14 MeV neutron generator facility at the Institute for Plasma Research
- Numerical simulation of ultrashort-pulse reflectometry (USPR) on EAST
- Matrix effect suppressing in the element analysis of soils by laser-induced breakdown spectroscopy with acoustic correction
- Minimum inhibitory but maximum nonhemolytic concentration of plasma-treated catheters coated with L.tridentata and O.vulgare extracts
- Plasma synthesis of various polymorphs of tungsten trioxide nanoparticles using gliding electric discharge in humid air:characterization and photocatalytic properties
- Effect of different process conditions on the physicochemical and antimicrobial properties of plasma-activated water