Plasma synthesis of various polymorphs of tungsten trioxide nanoparticles using gliding electric discharge in humid air:characterization and photocatalytic properties
2023-12-18RomaricSEUTCHAGeorgesKAMGANGYOUBIElieACAYANKAValeriaVERMILEFranoisDEVREDEricGAIGNEAUXandSamuelLAMINSI
Romaric L SEUTCHA,Georges KAMGANG-YOUBI,*,Elie ACAYANKA,Valeria VERMILE,François DEVRED,Eric M GAIGNEAUX and Samuel LAMINSI
1 Inorganic Chemistry Department,Faculty of Sciences,University of Yaounde I,Ngoa-Ekelle 812,Yaoundé,Cameroon
2 Institute of Condensed Matter and Nanosciences(IMCN),Molecular Chemistry,Materials and Catalysis,Université Catholique de Louvain,Place Louis Pasteur 1,1348 Louvain-la-Neuve,Belgium
Abstract A gliding electric arc (glidarc) discharge generates a low-temperature plasma at atmospheric pressure.When the discharge occurs in humid air as the feed gas,the chemistry of a glidarc plasma consists of in situ formation of HO°and NO°as the primary chemical species.Tungsten trioxide (WO3) nanoparticles were successfully prepared by exposure of a liquid precursor to glidarc plasma.The WO3 samples were calcined at three different temperatures(300°C,500°C and 800°C),resulting in different pure polymorphs:γ-WO3(at 300°C),β-WO3(at 500°C)and α-WO3 (at 800°C) according to x-ray diffraction analysis.The identification of WO3 compounds was also confirmed by attenuated total reflection Fourier transform infrared spectroscopy analysis.Increase in the calcination temperature of WO3 induced a decrease in its specific surface area according to Brunauer-Emmett-Teller nitrogen physisorption analysis.The UV-visible results showed that the absorption bands of plasma-WO3 samples were more intense than those of WO3 samples obtained by a precipitation route,a classical method used for comparison.Consequently,this parameter can improve the photocatalytic properties of WO3 under visible light.The photodegradation (in sunlight conditions) of gentian violet,chosen as a model pollutant,confirmed the photocatalytic properties of plasma-WO3 samples.This novel synthesis method has great potential to improve the efficiency of advanced tungsten trioxidebased functional material preparation,as well as in pollution-reducing and energy-saving tungsten extractive metallurgy.
Keywords: plasma glidarc,tungsten trioxide,plasma-synthesis,nanoparticles,photocatalyst
1.Introduction
The requirements for semiconductors are increasing daily due to their applications in numerous fields.Among the main semiconductors used in industry,tungsten trioxide (WO3)occupies a remarkable place.WO3is an oxide in which the transition metal has the electronic configuration 5d4.This semiconductor has been explored extensively in various fields,including gas sensing [1-4],solar energy conversion,electrochromic displays [5] and catalysis [6-10].With a small band gap of 2.4-2.8 eV,WO3is more effective than titanium dioxide at following the absorption range in the visible light region[11].WO3is resistant to degradation through photo-corrosion,which could lead to the production of metal ions and a diminution of its catalytic activity.Importantly,oxidation processes on the WO3surface are favored by a deep-lying valence band (+3.1 eV) [12,13].The crystalline structure of chemical sensors and catalysts has a significant impact on their sensitivity,selectivity and stability [14].The crystallographic structure of WO3is derived from the face-centered cubic structure of rhenium oxide in which the tungsten atoms are located at the vertices of a cube,while the oxygen atoms are in the middle of the edges of the cube [15].There are several classical techniques for producing WO3,including precipitation,ultrasonic synthesis and thermal oxidation [16-20].
Recently,we have developed a new process for nanocrystalline metal oxide synthesis that involves oxidation or reduction of metal oxide precursors by plasma generated by a gliding arc discharge (glidarc),respectively via HO° and NO° plasma-generated species [21-24].A glidarc plasma is obtained at atmospheric pressure using a simple device and can be classified as a non-thermal (low-temperature) plasma based on the large temperature gap between electrons and heavy species (ions,radicals,…).A non-thermal plasma is a partially ionized gas with an electron temperature much higher than the ion temperature.The high-energy electrons and low-energy heavy species can initiate reactions in the plasma volume without excessive heat,in contrast to thermal plasmas.Initially developed for the treatment of gases,this technology is also very well suited to the treatment of liquids,as detailed in the review paper of Brisset et al[25].When the gas is humid air,the chemistry of the glidarc plasma involves the production of NO° and HO° radicals as the main reactive species [26,27].The NO° radical is known to be involved in acidifying(HNO2and HNO3)and reducing effects,while the HO°radical is involved in oxidation effects due to its high redox potential=2.85 V/NHE.Moreover,these primary species are precursors of other entities such as the reactive oxygen species(ROS)H2O2and°O2H,the reactive nitrogen species(RNS)NO2,HNO2,,,ONOOH and ONOO-,and the ions,O+,and N+[25,28].Using the redox properties of glidarc plasma species,we recently explored this device to produce metal oxides such as TiO2,MnO2and SnO2with interesting physicochemical properties [21-24].In this work,we intend to explore glidarc plasma acidic properties to synthesize WO3nanoparticles.To the best of our knowledge,there are no reports on WO3synthesis by this plasma route.
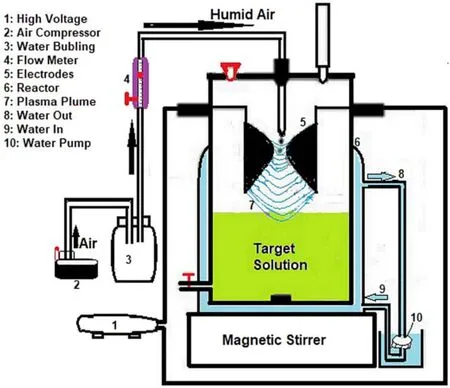
Figure1.Experimental setup of the glidarc plasma reactor.
The aim of this study is to show that we can obtain WO3phases(α-WO3,β-WO3and γ-WO3)with better properties by the glidarc plasma synthesis route.The plasma-obtained material will be compared with samples obtained by the precipitation method in a beaker,which is the most widely used method so far.The most important merit of the glidarc plasma process is that it can be considered as a green route,since the reactive species are produced using water-saturated air,which is non-polluting,available and renewable.Moreover,this novel synthesis technique does not require the addition of any reactants.
2.Material and methods
2.1.Reagents
To carry out the synthesis of the WO3nanoparticles,laboratory-grade sodium tungstate dihydrate (Na2WO4·H2O)(Merck,Darmstadt,Germany) was used as a precursor.Analytical reagent grade sulfuric acid (H2SO432 wt%) was also used in this work for precipitation synthesis route.
2.2.Plasma reactor for synthesis of WO3 nanoparticles
The non-thermal plasma assembly presented in figure 1 is the experimental device.It has been described previously[23-25].Briefly,the equipment consists of a generator (a Neon transformer,9 kV/220 V,100 mA in open conditions) operating at high voltage,which produces an arc between two diverging electrodes.The plasma power consumption in this condition is then about 100 W.The arc is pushed along the diverging electrodes by the humid air flow provided by a compressor and directed along the axis of the two electrodes.The arc glides along the electrodes to their tips,where it bursts into a large plasma plume until it is short-circuited and replaced by a new arc.During this process,the temperature of the arc decreases rapidly to a gas temperature of about 800 K and the plasma conductivity is maintained by a high value of the electron temperature of about 10 000 K,as determined in previous works using the same reactor[26,29].After this fast transition,the gliding arc continues its evolution,but under non-equilibrium conditions,and becomes a quenched plasma close to the ambient temperature and atmospheric pressure.The glidarc plasma density was previously measured through the two main generated species HO°and NO°.In such a plasma reactor,the HO° and NO° density measurements were respectively~1018m-3and~1016m-3,and these values remain constant when moving away from the electrode neck to the target[26].Furthermore,temperature measurements carried out during the treatment in the target solution exposed to glidarc plasma indicated values 8-10 °C higher than room temperature.
2.3.Preparation of WO3 nanoparticles
2.3.1.In the plasma reactor.For the preparation of WO3in the glidarc plasma reactor,10 g of the precursor(Na2WO4·H2O) was dissolved in 500 ml of distilled water under magnetic stirring.Subsequently,430 ml of this solution was introduced into the plasma reactor.After connecting the magnetic stirrer,the glidarc plasma experimental setup was turned on to initiate the synthesis.The flow rate of the plasma gas (humid air) was adjusted to 800 l h-1,the treatment was carried out for 30 min and the exposure solution was recovered after stopping the electric discharge.Filtration allowed the recovery of the paste product formed after leaving the solution to rest for 3 h.Once the paste was recovered,it was oven dried at 100°C for 8 h.At this stage,the material is hygroscopic and binds the humidity in the surrounding air;for this reason it will be calcined in accordance with the usual methods of synthesis of this oxide [6,17-19].Calcination was performed in a muffle furnace (PYRECTRONPYROLABO,France) by heating the as-synthesized material in an air stream at a heating rate of 10°C min-1,followed by a 3 h isotherm at the desired temperature.Three different calcination temperatures(300°C,500°C and 800°C for 3 h) were tested.
The samples obtained were named tungsten trioxide‘glidarc’ (TTG).Arabic numbers were added to this code to distinguish samples calcinated at different temperatures (thus TTG1,TTG2 and TTG3 for samples calcinated at 300°C,500°C and 800°C,respectively).
2.3.2.The precipitation method.Precipitation synthesis is also carried out in this work for comparison with glidarc plasma synthesis.The classical procedure has been described elsewhere [17].Briefly,10 g of the same precursor,namely sodium tungstate dihydrate (Na2WO4·2H2O),was dissolved in 500 ml of distilled water under magnetic stirring.Afterwards,30 ml of sulfuric acid (32 wt%) was added while maintaining stirring.After being left to stand for 3 h,a pale yellow precipitate of tungsten trioxide hydrate(WO3·nH2O) was formed and dried in an oven at 100°C for 8 h.At this stage,the resulting material was hygroscopic,then it was submitted to thermal treatment (300°C,500°C and 800°C during 3 h) to remove structural or chemisorbed water.These calcinations yielded a dry powder of anhydrous composition WO3.This method produces nanometric particles aggregated together [6,14,30,31].The following equation (1) can be presented to support the synthesis:
WO3(P)relates to WO3obtained by chemical precipitation.
The samples obtained were named tungsten trioxide‘precipitation’ (TTP) for samples obtained by the precipitation method.Arabic numbers were added to these codes to distinguish samples calcinated at different temperatures.Thus,the codes are TTP1,TTP2 and TTP3 for samples calcinated at 300°C,500°C and 800°C,respectively.
2.4.Characterization methods
The samples of WO3prepared by both methods were characterized through different techniques.X-ray diffraction(XRD) of powders was done using a Bruker D8 x-ray diffractometer operating in the reflection mode with Cu Kα radiation (λ=1.5418 Å,40 kV,30 mA) in the 5°-80° range(2θ) with a step of 0.015° and time per step of 0.15 s.Attenuated total reflection Fourier transform infrared(ATR-FTIR)spectroscopy was performed in ATR mode using a Bruker Equinox 55 spectrometer equipped with a Platinum ATR cell,in which diamond(refractive index=2.41)was used as ATR crystal.The spectra were recorded with 100 scans between 4000 and 500 cm-1with a resolution of 4 cm-1.Textural analyses were carried out through nitrogen physisorption on a Micromeritics Tristar 3000 apparatus at -196°C in the relative pressure range[10-6-0.99].Samples were previously outgassed at 170°C under a vacuum for a minimum of 6 h.The Brunauer-Emmett-Teller (BET) method was used to calculate the specific surface area,SBET,in the relative pressure range of (0.05-0.30)P/P°.The surface morphology of the samples was obtained using a FEI Inspect scanning electron microscope with a high voltage of 25 kV.It operates in two vacuum modes (high and low) with secondary and backscattered electron detectors for both vacuum modes.A small quantity of the sample was deposited on a carbon support and filled into the metallizer containing a small among of argon.Micrographs were recorded in the high vacuum mode of the scanning electron microscope.Ultraviolet-visible spectroscopy(UV-vis)spectra were recorded at wavelengths of 200-800 nm using a Shimadzu UV-3600 Plus spectrophotometer.A Spectralon®Diffuse Reflectance Standard was used to measure the background spectrum.The measured intensity was expressed as the value of the Kubelka-Munk function F(R).
2.5.Photocatalytic applications
Laboratory-grade gentian violet (GV) dye (C25N3H30Cl)(Sigma-Aldrich,Missouri,USA) was chosen as the model pollutant for studying the photocatalytic activity of the synthesized WO3nanoparticles.GV is an industrial dye belonging to the triphenylmethane family and is soluble in water [32];its chemical structure is depicted in figure 2.
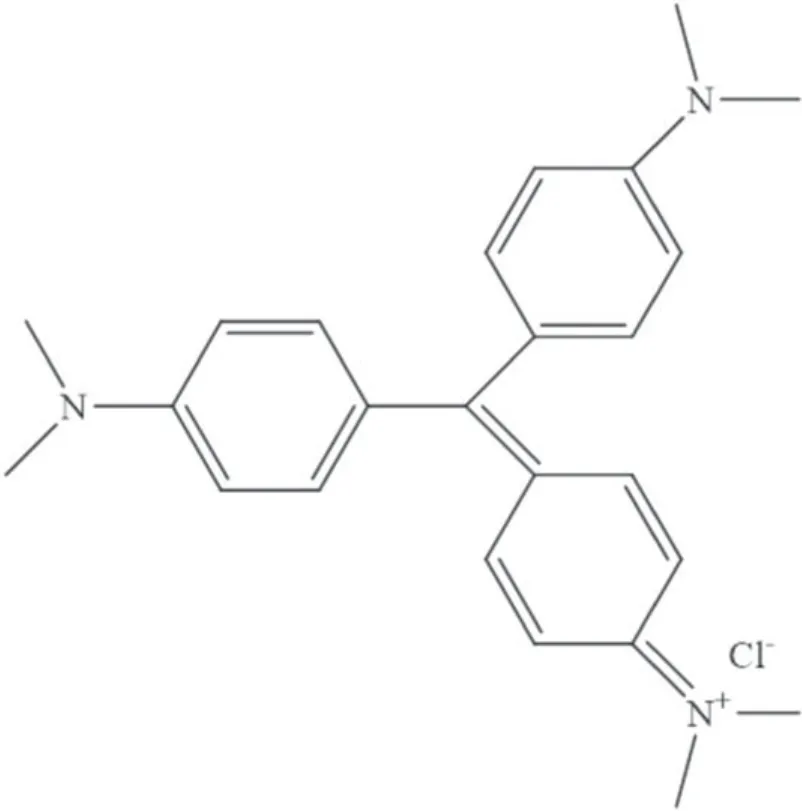
Figure2.Chemical structure of gentian violet (C25N3H30Cl).
For catalytic studies,a typical experiment consists of 100 ml of 15 mg l-1aqueous dye solution with 75 mg of catalyst placed in a quartz beaker under shaking in a dark for 30 min to reach the adsorption-desorption equilibrium.Then,the suspended solution is irradiated with sunlight for different time intervals.The solar irradiation experiments were conducted from 11:00 am to 3:00 pm at room temperature in Yaounde,Cameroon.During this period,the fluctuation in sunlight intensity is minimal.At the same time,control experiments were realized in similar conditions without catalyst.On the days of experimentation,an average light intensity of 5 kWh m-2day-1was registered using a digital lux meter with 5% accuracy.
At given time intervals,a fraction of the exposed solution was taken and centrifuged at 3600 rpm for 5 min The degradation of GV dye was studied by measuring its absorbance at the maximum absorption wavelength (590 nm) with a Lovibond UV-vis spectrophotometer (Spectrodirectanlage 260).The concentration of dye was determined from the calibration curve.The degradation efficiencies (D,%) of the different synthesized WO3nanoparticles were determined using the following formula:
where C0and Ctare the initial concentration of GV and the concentration at a given irradiation time,respectively.
3.Results and discussion
3.1.Synthesis of WO3 materials
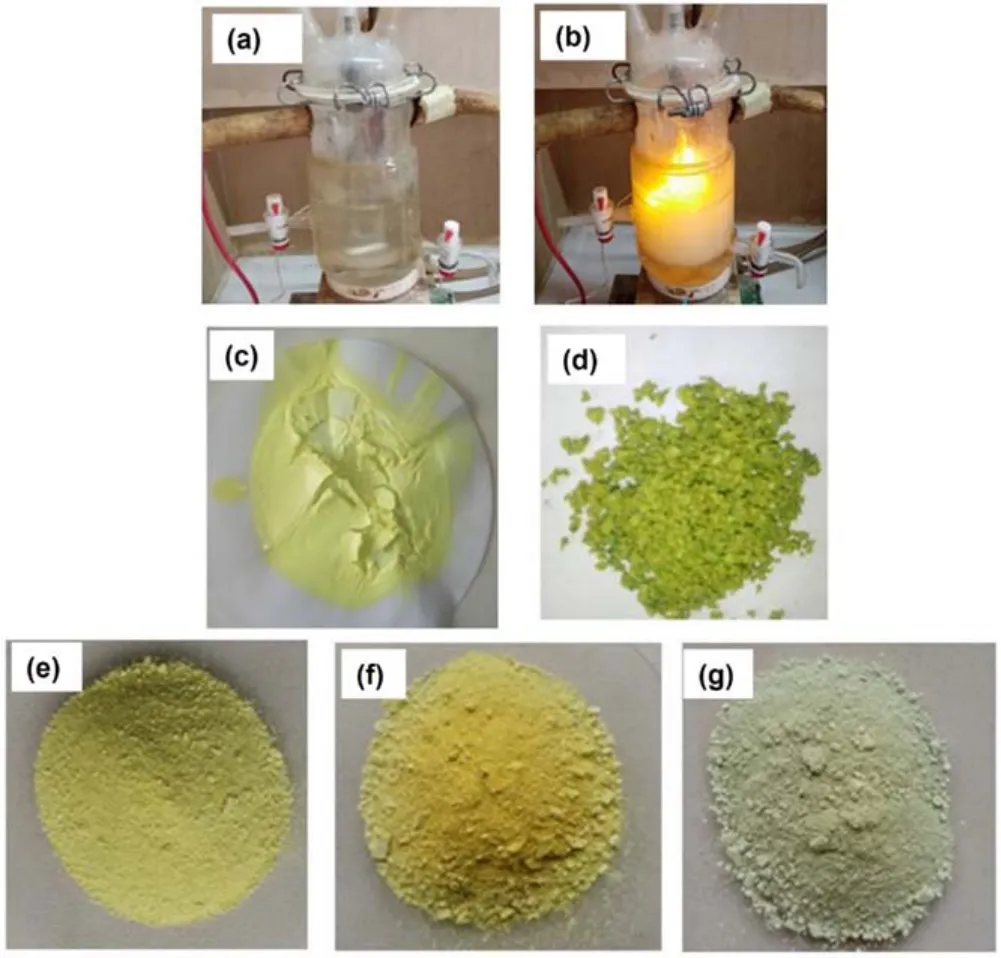
Figure3.Progressive images of WO3 synthesis by glidarc plasma:(a) aqueous solution of precursor in a plasma reactor,(b) aqueous solution during plasma treatment,(c) paste material after plasma synthesis,(d) material after oven drying,(e) material calcinated at 300°C,(f) material calcinated at 500°C and (g) material calcinated at 800°C.
When an aqueous transparent solution of Na2WO4·2H2O(white solid)was introduced into the glidarc plasma reactor its color progressively changed during the 30 min of exposure to glidarc plasma(figures 3(a)and(b)).At the end of the stage in the plasma reactor,a yellowish paste material was collected(figure 3(c)),then oven dried at 100°C for 8 h,resulting in a less pasty material (figure 3(d)).As previously mentioned(section 2.3.1),the obtained material was then calcinated at three different temperatures.The images of the materials after the calcination process are presented in figures 3(e)-(g) for 300°C,500°C and 800°C,respectively.Results indicated that the initial Na2WO4·2H2O is converted into solid which will prove to be WO3(section 3.2).We can observe an agglomeration of particles to larger ones,which could significantly affect the textural properties of the reference material(WO3)after removal of structural or chemisorbed water.
The chemistry of the reactive species in humid air plasma describes NO° and HO° radicals as the main entities produced.The HO°radical is the predominant species in cases of oxidation.Suspensions exposed to a glidarc of humid air(parent species N2,O2and H2O) have always seen their pH decrease by several units [22,28,33].This acidifying effect is attributed to the NO°radicals generated in the plasma plume that induce formation of HNO2and HNO3(the main species responsible of plasma-acidification).It comes from the following reactions (equations (3)-(8)):

Table 1.Average crystallite sizes (D) of α-WO3,β-WO3 and γ-WO3.
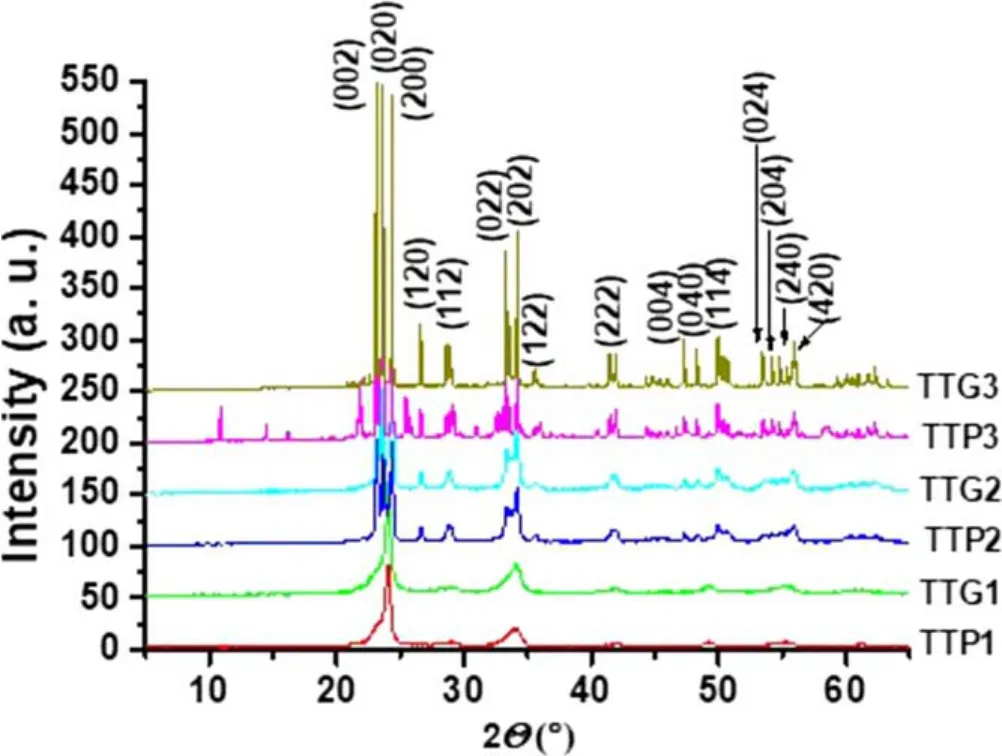
Figure4.XRD patterns of glidarc plasma-synthesized WO3 (TTG)and precipitated WO3 (TTP) after calcination at 800°C (TTG3 and TTP3),500°C (TTG2 and TTP2) and 300°C (TTG1 and TTP1).
In this study,tungsten is the same oxidation state in the precursor Na2WO4·2H2O and the synthesized WO3,thus we should agree that it is the acidifying effect that predominates in this synthesis.In addition,the test for the presence of nitrate ionsin the supernatant after filtration proved positive.The following equation (9) can then be proposed to explain the plasma synthesis:
WO3(G)relates to WO3obtained in a glidarc plasma.
At the end of the calcination step,the different obtained masses were 4.37 g,4.35 g and 4.34 g for 300°C,500°C and 800°C,respectively.The temperature of calcination has practically no influence on the mass of material obtained.According to equation(9),the yields of the synthesis reaction are greater than 60%.
3.2.Characterization of synthesized samples
3.2.1.XRD analysis.Typical XRD patterns of the synthesized WO3powder are depicted in figure 4.
The XRD profiles of WO3samples showed three distinct families of polymorphs:TTP1 with TTG1,TTP2 with TTG2,and TTP3 with TTG3,which correspond respectively to the powders obtained at 300°C,500°C and 800°C.XRD patterns for TTP1 and TTG1 showed two distinct peaks with 2θ at around 23.4° and 34.0°,which are characteristic of the cubic WO3phase (JCPDS 41-0905) [34].XRD patterns for TTP3 and TTG3 showed three main peaks in the range of 23° <2θ <25°,which indicate,together with those at 2θ 33.2°-34.2° and 50°-56°,that the samples are composed of monoclinic WO3(JCPDS 43-1035).TTP3 and TTG3 have very defined peaks,which proves that WO3is very crystalline after calcination at 800°C.But in TTP3 we have extra peaks due to the presence of Na.This means that TTP3 is less ordered or at least less pure than TTG3.The monoclinic WO3phase characteristically exhibits three large peaks at 2θ values of 23.3°,23.8°and 24.6°,and is the most stable phase at room temperature [35].Concerning the last polymorph family(TTG2 and TTP2),each sample is a mixture of cubic and monoclinic WO3(TTP1+TTP3 for TTP2,and TTG1 +TTG3 for TTG2).Indeed,compared with TTG1 (or TTP1),the appearance of new peaks (25° < 2θ < 30° and 40° <2θ <56°) is observed in the XRD pattern of TTG2(or TTP2),and these new peaks are well defined in the XRD pattern of TTG3 (or TTP3) (JCPDS 83-0950).Overall,diffraction peaks of metallic tungsten were not detected.All the samples are almost pure.Considering the temperature parameter,XRD results showed that the obtained WO3powders (300°C,500°C,800°C) correspond respectively to γ-WO3,β-WO3and α-WO3phases [36-40].Regarding the non-calcined sample,in addition to its hygroscopic character mentioned previously it is well known that its structure is amorphous and only begins to crystallize from approximately 200°C [41].
The average crystallite sizes (D) of the WO3samples(table 1) were evaluated by using Scherrer’s equation (10)[20,42]
where K (Scherrer constant=0.9) is a dimensionless shape factor,λ (0.15418 nm,Cu Kα) is the x-ray wavelength,β is the line broadening at half the maximum intensity (FWHM,full width at half maximum) in radians and θ is the Bragg diffraction angle in radians.
These results show that the average sizes of WO3nanoparticles range between 30 nm and 36 nm for the glidarc plasma-WO3(TTG) samples and between 36 and 51 nm for precipitated WO3samples (TTP).Therefore,the synthesis of WO3by glidarc plasma gives smaller nanoparticles than the precipitation method.We could observe an increase particle size with increase in the calcination temperature,which could be ascribed to the removal of structural (chemisorbed) water,inducing the agglomeration of small particles to larger ones and maybe shrinkage of pores at the surface of the material.
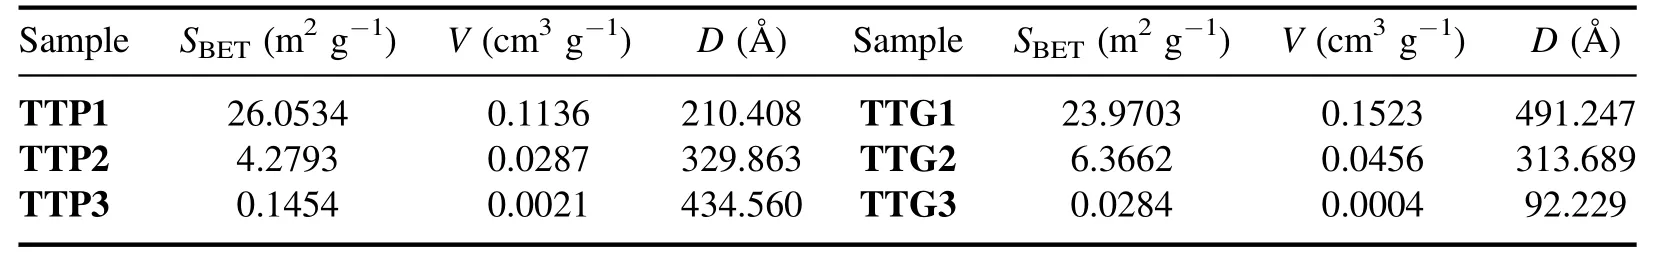
Table 2.BET surfaces (SBET),pores volumes (V) and pores diameters (D) of different samples.

Figure5.FTIR ATR spectra of glidarc plasma-synthesized WO3(TTG) and precipitated WO3 (TTP) after calcination at 800°C ((a)TTG3 and(a′)TTP3),500°C((b)TTG2 and(b′)TTP2)and 300°C((c) TTG1 and (c′) TTP1).
3.2.2.ATR Fourier transform infrared characterization.The ATR-FTIR spectra of different samples are shown in figure 5.
All the samples show a strong absorption band at 500-1000 cm-1associated with the O-W-O stretching mode.Samples calcined at different temperatures exhibit different profiles in the absorption region between 500 cm-1and 1000 cm-1.This can be explained by the different crystalline structures (polymorphs) of powders,as previously revealed by XRD analysis.To better interpret these results and gain a deep understanding,the association of the spectra as a function of WO3structure and synthesis method is shown in figures 6(for TTP1,TTG1,TTP2 and TTG2)and 7(for TTP3 and TTG3).These figures highlight the details of the different ATR-FTIR spectra.
The spectra of TTP1 and TTG1 (figure 6(a)) show a broad band at 652 cm-1and a shoulder at 901 cm-1,which can be ascribed respectively to O-W-O and W=O bond vibrations.A strong broad band located at 3450 cm-1is assigned to the O-H stretching vibrations of physisorbed water and the band at 1626 cm-1is assigned to the bending H-O-H vibrations of physisorbed water.
Analysis of the TTP2 and TTG2 spectra(figures 6(b)and(c)) shows that the samples are practically free of water,which could be attributed to calcination at 500°C releasing physisorbed and chemisorbed water.Bands between 629 cm-1and 868 cm-1are assigned to O-W-O bond stretching.All the samples show a weak band at 1038-1130 cm-1which can be attributed to the stretching of W=O bonds at the surface.These results confirm the presence of WO3in these samples.
The TTP3 and TTG3 spectra are presented in figure 7.We can see that the stretching and bending vibrations of physisorbed water which were observed around 3400 cm-1and 1600 cm-1for samples calcined at 300°C are absent for TTP3 and TTG3 samples (figure 7(a)).The previous explanation is also acceptable here.In figure 7(b),bands between 615 cm-1and 866 cm-1are always due to O-W-O vibrations.The peak at 1038 cm-1is assigned to the stretching of W=O bonds.The same bands are observed in slightly different positions in figure 7(c).Overall,these bands are in different positions in the various samples due to the different calcination temperatures,which induce different crystalline structure (polymorphs).
3.2.3.Textural properties of precipitated and glidarc plasmasynthesized WO3.The N2adsorption-desorption isotherms of precipitated and glidarc plasma-WO3samples are shown in figure 8.
All the samples exhibit hysteresis loops in the relative pressure range of 0.8-1.0 typical of type IV isotherms,indicating that the presence of macropores probably correspond to voids between non-porous particles [43,44].The presence of these macropores is confirmed by the pore size distribution(see insert in the isotherm curves of figure 8).The heterogeneity in the pore size distribution is correlated with the variable particle size.The surface area of WO3nanoparticles is important for their use as photocatalyst because the sorption phase is one of the controlling factors of the catalytic oxidation reaction.WO3nanoparticles with a slightly high specific surface area could be obtained at temperatures below 500°C (e.g.TTP1 and TTG1).For both TTP and TTG samples,the area of the obtained powders decreased with increasing annealing temperature (table 2).
3.2.4.Microscopy results.Figure 9 shows SEM images of both plasma-synthesized and precipitated samples of WO3.
The synthesized samples reveal the formation of particles with non-uniform shapes and sizes,although the shapes of samples calcinated at 800°C(TTG3 and TTP3)are sand-like(dusty morphology) whereas the others (TTG1,TTG2,TTP1 and TTP2) are gravel-like (discontinuous spherical morphology).The irregularity in shape and size is well pronounced for the samples calcinated at 300°C (figures 9(a) and (d)),indicating the presence of a mixture of amorphous and crystalline solids.This observation is consistent with the aforementioned XRD results.Figure 9 also shows that the obtained powders comprise porous agglomerates,which can be explained by the permanent agitation of the target solution during their synthesis.Moreover,the agglomeration is more pronounced for the samples calcined at 300°C (figures 9(a)and(d))and 500°C(figures 9(b)and(e))than those calcined at 800°C (figures 9(c) and (f)) because the temperature rise favors the separation of particles.The surface of WO3calcined at 300°C has a more porous morphology than those calcined at 500°C and 800°C.It is known that a porous structure could allow the diffusion of pollutants and subsequently promote efficient photoactivity.
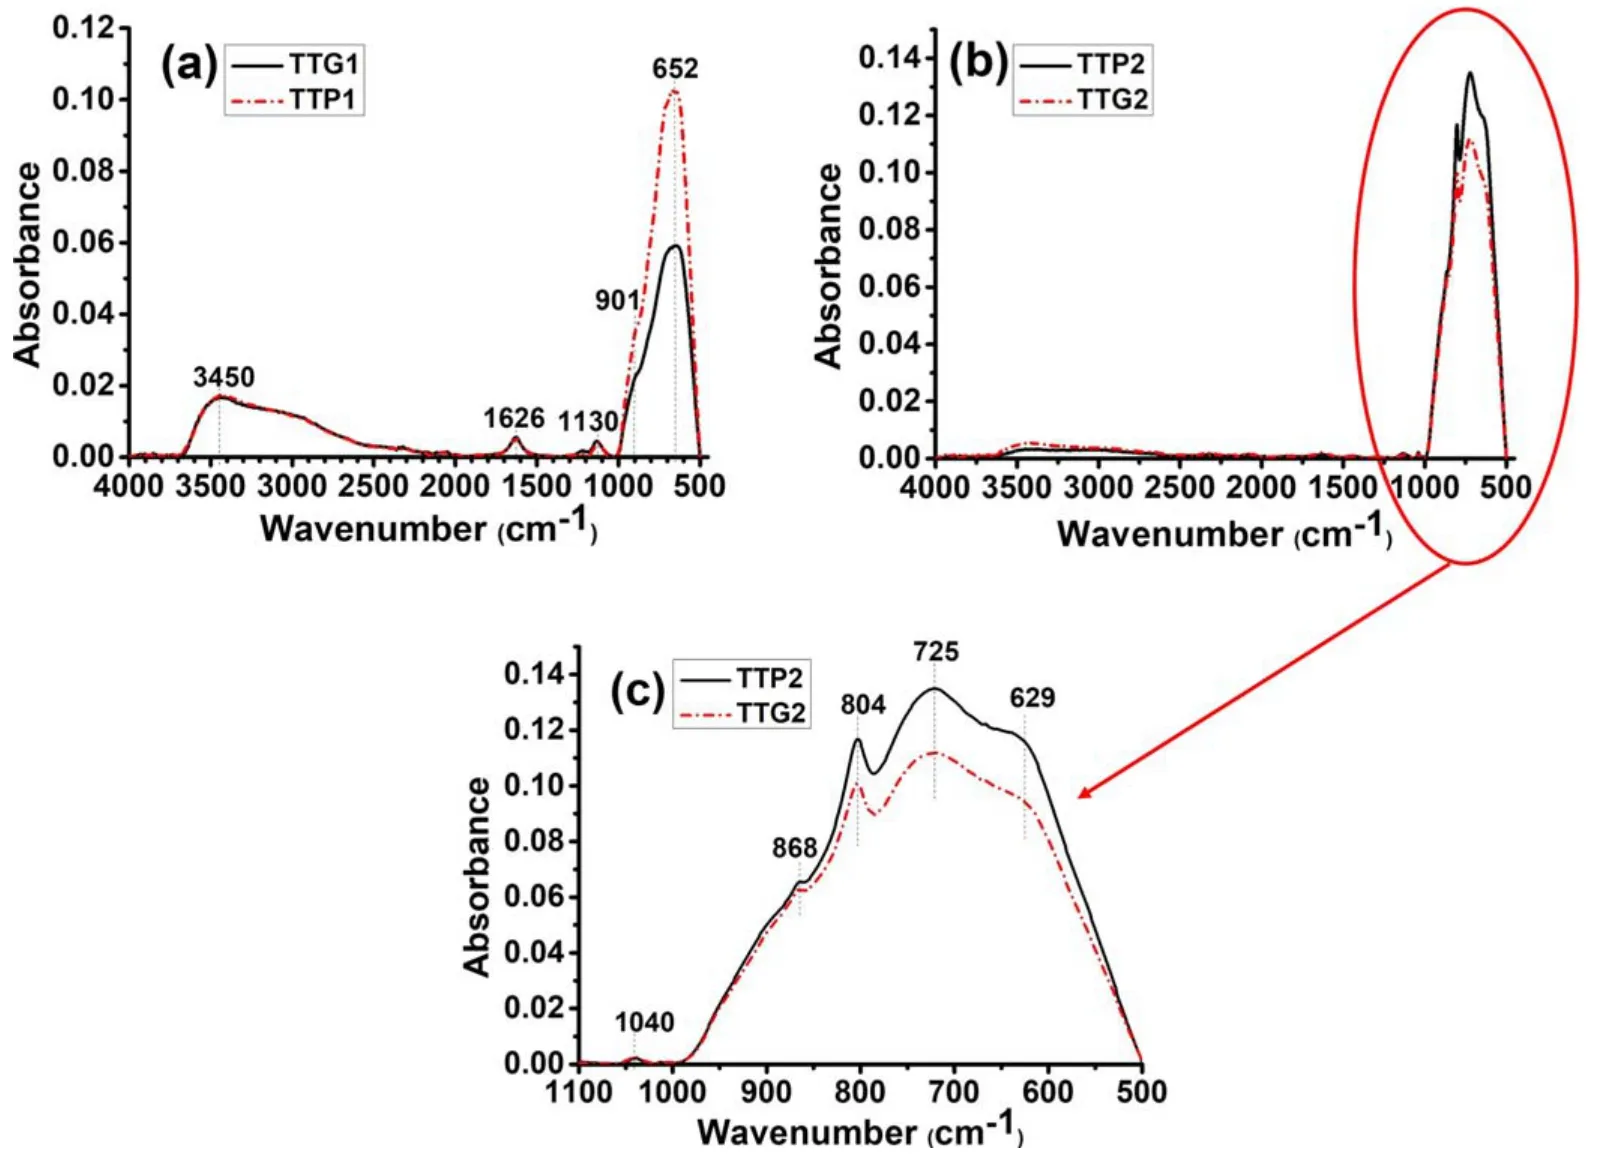
Figure6.ATR-FTIR spectra of glidarc plasma-synthesized WO3(TTG)and precipitated WO3 (TTP)after calcination at (a)300°C and(b)500°C.(c) A magnification of the area in the range of 500-1000 cm-1.
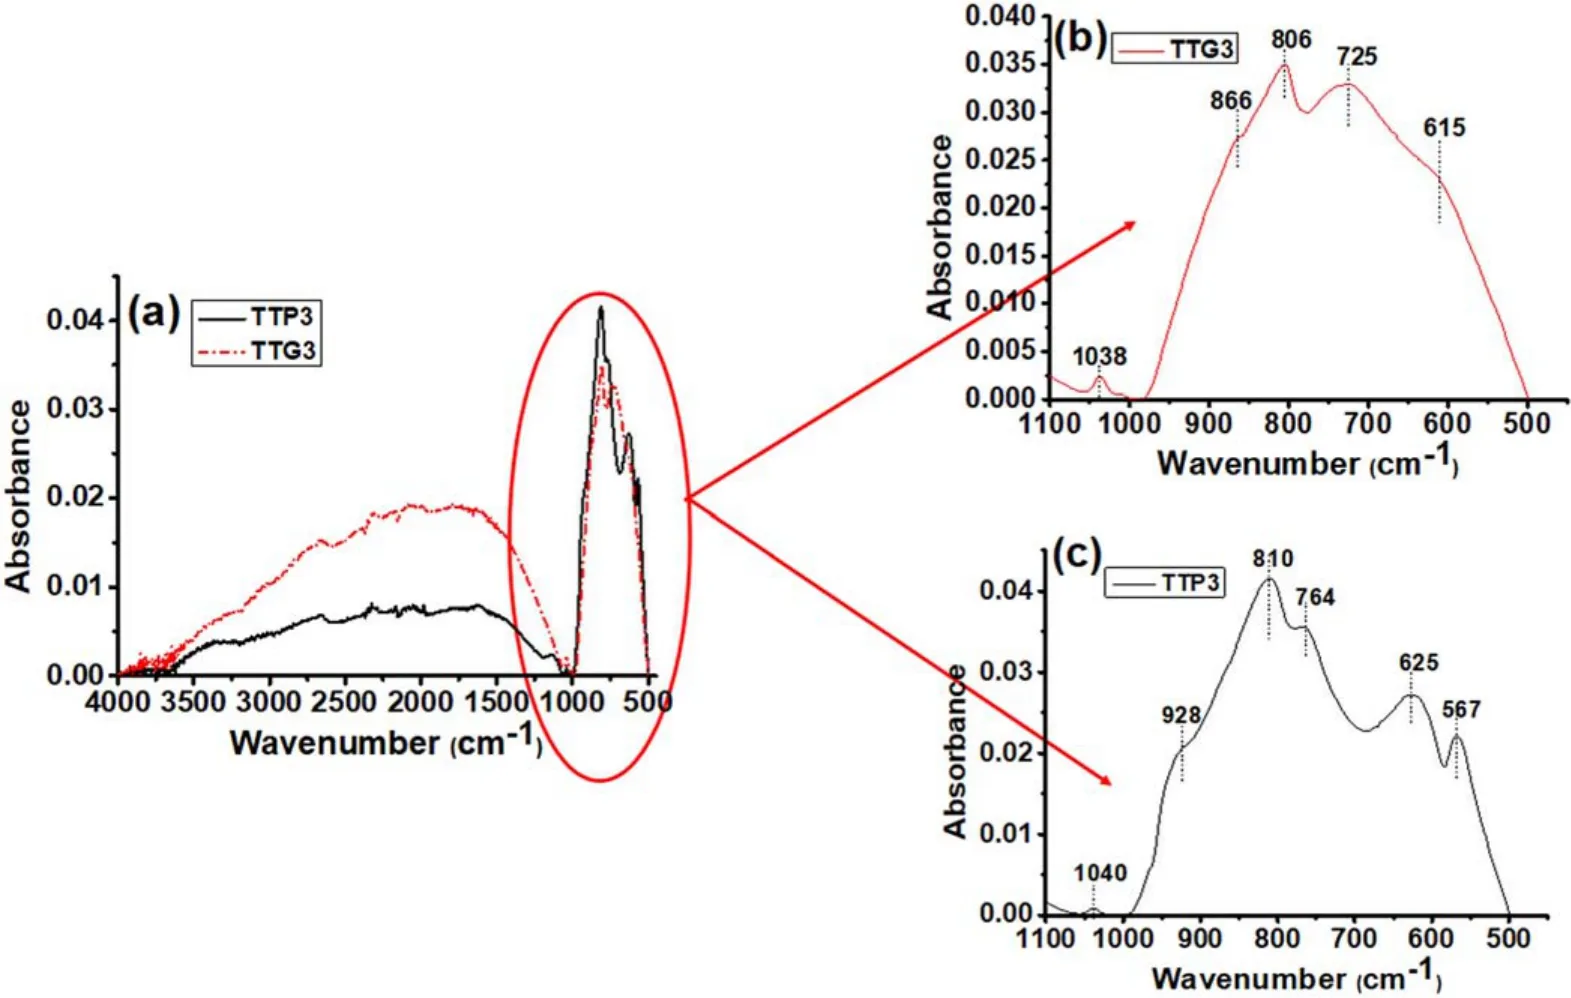
Figure7.(a) ATR-FTIR spectra of glidarc plasma-synthesized WO3 (TTG3) and precipitated WO3 (TTP3) calcined at 800°C.The magnification of the area between 500 and 1000 cm-1 is also presented for (b) TTG3 and for (c) TTP3.
3.2.5.UV-vis diffuse spectroscopy.Previously,we assessed the impact of calcination temperature on textural properties,which revealed the significant diminution of the specific surface areas of both prepared materials.Therefore,it is relevant to carry out UV-vis spectroscopy analysis.Diffuse reflectance UV-vis spectra of plasma-synthesized WO3nanoparticles are depicted in figure 10 and compared with those of precipitated WO3.
As shown in figure 10,the band-gap energies can be estimated from the intercept of the tangents to the plot’s edges.The estimated values for the samples are respectively 2.70 eV,2.60 eV and 2.57 eV for γ-WO3(TTG1),β-WO3(TTG2) and α-WO3(TTG3) [45].A significant increase at absorption wavelengths shorter than 500 nm can be assigned to the intrinsic band-gap absorption of WO3due to the electron transitions from the valence band to conduction band O 2p →W 5d.The increase of UV absorption edges of plasma-synthesized WO3powders to high wavelengths(towards the visible region) is useful for improving the photo-absorption and photocatalytic performance of WO3under visible light.
3.3.Photocatalytic applications of synthesized samples
The photocatalytic applications of various glidarc-WO3polymorph nanoparticles were studied by evaluating the photodegradation of GV under daylight irradiation.The results are presented in figure 11.
Photodestruction of GV alone(without catalyst)does not occur.Under dark conditions,the removal of GV increases gradually and reaches an equilibrium after 20 min of contact regardless of the polymorph used as the catalyst.In this condition,adsorption of the pollutant occurs,and the degradation rates after 30 min are 25%,6% and 0% for TTG1,TTG2 and TTG3,respectively.The difference in efficiency can be attributed to the difference in specific surface area detailed in section 3.2.3.Indeed,the larger the BET surface area,the higher the dye degradation rate is.
In the presence of sunlight,a sudden change in the rate of pollutant degradation is obtained regardless of the polymorph used (figure 11): all the materials synthesized by glidarc plasma are therefore photoactive with respect to the pollutant to be treated.After 90 min of exposure,the degradation rates are 34.05%,45.54% and 78.86% for TTG3,TTG2 and TTG1,respectively.From these results,the catalytic effect of the materials is clearly highlighted and TTG1 appears to be more efficient than the other samples.A similar trend was previously obtained with another metal(+VI) oxide,MoO3,synthesized by plasma glow discharge[46] and with TiO2synthesized by glidarc plasma [47].Overall,the photocatalytic activity of the powders obtained decreases with increase in the annealing temperature.These results confirm the photocatalytic capacity of WO3as demonstrated in previous studies [6,7,10].Furthermore,to confirm the better efficiency of the samples obtained by glidarc plasma synthesis compared with those prepared by precipitation as revealed by the UV-vis properties(figure 10),a comparative study was carried for GV under the same conditions using TTP1 and TTG1.The degradation curves are presented in figure 12.

Figure10.UV-vis diffuse reflectance spectra of glidarc plasma-synthesized WO3(TTG)and precipitated WO3(TTP)after calcination at(a)300°C,(b) 500°C and (c) 800°C.

Figure11.Photodegradation of GV without catalyst and over TTG1,TTG2 and TTG3.
Although the levels of degradation in the dark are practically similar (which remains consistent with their specific surfaces),the photoactivity of the TTP1 sample (55%) was found to be much lower than that obtained with its counterpart TTG1(79%).Thus,the increase in UV absorption edges of plasma-synthesized WO3powders leads to improved photocatalytic performance under sunlight.
4.Conclusion
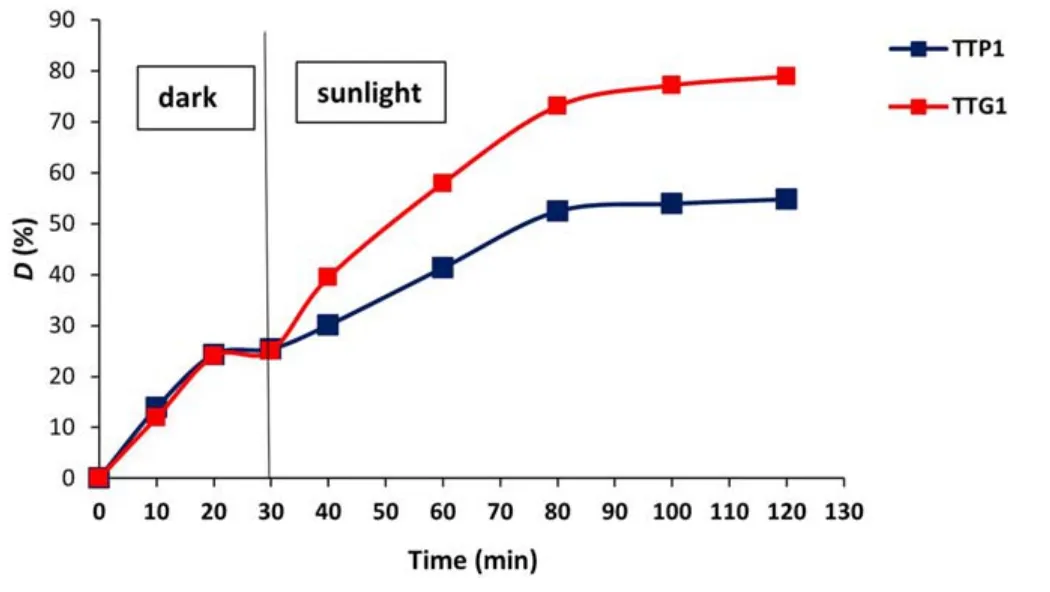
Figure12.Photodegradation of GV over TTP1 and TTG1.
Different nanoparticles of WO3have been successively prepared by a plasma chemical method using a gliding arc plasma device.The use of non-thermal quenched plasma at atmospheric pressure favors the formation of active species and free radicals,which confer particular chemical properties to that process.The plume of quenched plasma licks a target solution,and its species react with the Na2WO4·2H2O precursor to produce WO3nanoparticles through plasma-acidification.Comparison with the samples obtained through precipitation showed that the obtained products exhibit the same main crystallographic properties after calcination at different temperatures (300°C,500°C and 800°C).XRD revealed that the three obtained phases are crystallized(α-WO3,β-WO3and γ-WO3).Infrared spectroscopy,through bond identification,confirms that WO3can be synthesized by a gliding arc plasma.However,nitrogen physisorption analysis reveals a significant decrease in the specific surface area as the calcination temperature of WO3samples increases.The main difference between the groups of samples is observed in the UV-vis spectra,where the absorption bands of glidarc-WO3increase significantly.Indeed,the absorption wavelength of plasma-assisted synthesized WO3increases(diminution of the band-gap energy) with the annealing temperature,compared with precipitated WO3,where we recorded the inverse.Catalytic performance was successfully demonstrated for the degradation of gentian violet dye.According to this work,gliding arc plasma can be considered as an easy‘green’way to produce WO3nanoparticles that can be used for photocatalytic applications under visible light.
Acknowledgments
The authors owe many thanks to A.Mbouopda-Poupi (UAE University,United Arab Emirates) for performing SEM characterizations.
ORCID iDs
杂志排行

Plasma Science and Technology的其它文章
- Presheath formation and area design limit satellite-based Langmuir probes
- Study of a collisionless magnetized plasma sheath with nonextensively distributed species
- Effect of spin on the instability of THz plasma waves in field-effect transistors under non-ideal boundary conditions
- Hybrid simulation of q=1 high-order harmonics driven by passing energetic particles in tokamak plasmas
- The advance of magnetic diagnostics system in support of EAST long-pulsed operation
- Numerical study of the self-pulsing of DC discharge: from corona to parallel-plate configurations