A Review of Process Optimization for Additive Manufacturing Based on Machine Learning
2023-12-10XiaoyaZhaiandFalaiChen
Xiaoya Zhai and Falai Chen
School of Mathematical Sciences, University of Science and Technology of China, Hefei, Anhui 230026, China
Abstract.Additive manufacturing (AM),also known as 3D printing,has emerged as a groundbreaking technology that has transformed the manufacturing industry.Its ability to produce intricate and customized parts with remarkable speed and reduced material waste has revolutionized traditional manufacturing approaches.However,the AM process itself is a complex and multifaceted undertaking,with various parameters that can significantly influence the quality and efficiency of the printed parts.To address this challenge,researchers have explored the integration of machine learning (ML) techniques to optimize the AM process.This paper presents a comprehensive review of process optimization for additive manufacturing based on machine learning,highlighting the recent advancements,methodologies,and challenges in this field.
Key words: Additive manufacturing,3D printing,machine learning,process optimization.
1 Introduction
Additive manufacturing(AM),has emerged as a transformative technology that has revolutionized the field of manufacturing.Unlike traditional subtractive manufacturing methods that involve removing material from a solid block to create a desired shape,additive manufacturing builds objects layer by layer,adding material to form the final product.This innovative approach enables the production of complex and customized parts with unprecedented design freedom.
The process of additive manufacturing typically begins with the creation of a digital model using computer-aided design(CAD)software.The model is then sliced into thin layers,and the AM system precisely deposits or solidifies the material layer by layer,following the instructions provided by the digital model.The materials used in additive manufacturing vary widely,ranging from polymers and metals to ceramics and composites,allowing for a broad range of applications across industries.
There are several types of 3D printing technologies,each with its own unique approach and characteristics.Here are some of the commonly used types of 3D printing:
(1) Fused Deposition Modeling (FDM)/Fused Filament Fabrication (FFF):FDM/FFF is one of the most widely adopted technologies.It involves the extrusion of thermoplastic filaments through a heated nozzle.The material is deposited layer by layer,and as it cools down,it solidifies,forming the desired object.FDM/FFF is known for its simplicity,affordability,and versatility,making it suitable for both personal and professional use.
(2) Stereolithography (SLA): SLA utilizes a liquid photopolymer resin that hardens when exposed to specific wavelengths of light.The resin is contained in a reservoir,and a movable platform gradually lifts the object out of the resin bath as each layer is cured by a UV light source.SLA is known for its ability to produce high-resolution,detailed parts with smooth surface finishes,making it popular in industries such as jewelry and prototyping.
(3) Selective Laser Sintering (SLS): SLS involves using a laser to selectively fuse powdered materials,typically polymers or metals,to create the desired object.The powdered material is spread in a thin layer,and the laser sinters the particles together based on the 3D model’s cross-section.SLS allows for the production of complex geometries and functional parts,making it suitable for prototyping,manufacturing end-use parts,and low-volume production.
(4) Digital Light Processing (DLP): DLP technology is similar to SLA,but instead of a laser,it uses a digital light projector to cure each layer of liquid photopolymer resin.The projector shines UV light onto the entire layer simultaneously,enabling faster printing speeds compared to SLA.DLP is known for its high-resolution prints and is commonly used in dental applications,jewelry making,and rapid prototyping.
(5) Selective Laser Melting (SLM)/Direct Metal Laser Sintering (DMLS):SLM/DMLS is a 3D printing technique used for metal parts.It involves using a high-powered laser to selectively melt and fuse metal powders layer by layer.The process takes place in a controlled environment with an inert gas to prevent oxidation.SLM/DMLS allows for the production of highly complex,fully dense metal parts with excellent mechanical properties,making it suitable for aerospace,automotive,and medical applications.
However,the AM process itself is a complex and multifaceted undertaking,with various parameters that can significantly influence the quality and efficiency of the printed parts.In response to these challenges,researchers have turned their attention to machine learning (ML) techniques as a means to optimize the AM process.Machine learning,a subset of artificial intelligence,empowers systems to learn from data and make intelligent decisions or predictions.By harnessing the power of ML,researchers aim to enhance the overall performance of additive manufacturing,ensuring the production of high-quality parts while maximizing efficiency.
This paper serves as a comprehensive review of the advancements,methodologies,and challenges in the field of process optimization for additive manufacturing based on machine learning.The outline of this paper is shown in Fig.1.It delves into recent research efforts that have explored the integration of ML techniques into the AM process,emphasizing the various approaches employed,such as supervised,unsupervised,and reinforcement learning.The acquisition,preprocessing,and selection of relevant features from the data are also examined,as they play crucial roles in achieving successful optimization.Furthermore,this review discusses case studies and research findings that exemplify the successful utilization of machine learning for process optimization in additive manufacturing.These studies focus on optimizing process parameters to improve part quality,as well as enhancing productivity and reducing production costs through the intelligent use of ML techniques.
While acknowledging the promising advancements,the paper also addresses the challenges and limitations associated with implementing machine learning in the AM process.These challenges include the collection and validation of data for reliable optimization and the need for explainable AI to enhance transparency and trust in the optimization outcomes.This comprehensive review highlights the significant impact of machine learning on the optimization of additive manufacturing processes.By providing an overview of recent advancements,methodologies,and challenges,it lays the groundwork for future research and development in this rapidly evolving field.
2 Data collection
Data collection is a critical aspect of scientific and industrial research and can be accomplished through two primary techniques: the design of experiments (DoE)method and simulation.Both of these approaches to data collection are widely utilized in the field and will be thoroughly explicated in the subsequent section of this manuscript.The DoE method involves systematic manipulation and measurement of variables in a controlled setting,while simulation is a computational model-based approach to predicting the behavior of a system or process.In this section,we will provide an overview of both techniques and demonstrate their implementation in the process optimization of AM.Additionally,the advantages and limitations of each method will be discussed in detail,providing the reader with a comprehensive understanding of data collection in scientific and industrial contexts.
2.1 Design of Experiments (DoE)
One popular data collection method that is used in AM is DoE.This method involves systematically varying one or more process parameters and analyzing the effect of these changes on the output.This information can then be used to develop models that describe the relationships between the process parameters and the output,which can be used to optimize the process parameters.The identification of the target quality attributes and the associated variables that define the output of an AM process is crucial for the systematic examination of process parameters.This is due to the large number of parameters that can affect the outcome of an AM process.Conducting a simple one-factor-at-a-time study would require an excessively high number of experiments and would entail costly and time-consuming trial and error,particularly for metal AM [18–20].Additionally,this is not appropriate for finding input parameter interactions,which may affect the correlation between each input parameter and the target result.In this situation,it is more effective to use statistical approaches for DoE.Early parametric research of the process parameters in AM was conducted using DoE techniques such as full factorial design(FFD)[21],Taguchi[5],and others.These techniques sampled the process space for the inquiry and then conducted the analytical process using RSM [22] and ANOVA [11].Some of the current research about the DoE are listed in Table 1.Both the material cost of the fuse or the powder and the operational cost of running the AM printer for extended periods of time make experiments and research in AM expensive.Furthermore,it is time-consuming to conduct the experimental characterization.As a result,it’s crucial to carry out the fewest number of experiments while extracting the most information out of the available samples.In order to dramatically minimize the number of experiments while retaining the scope of the study,some statistical approaches are applied.Orthogonal,fractional factorial,and Taguchi’s methods,examined with ANOVA and RSM,are typical characterization methods in AM techniques.The studies about these methods are also listed in Table 1.
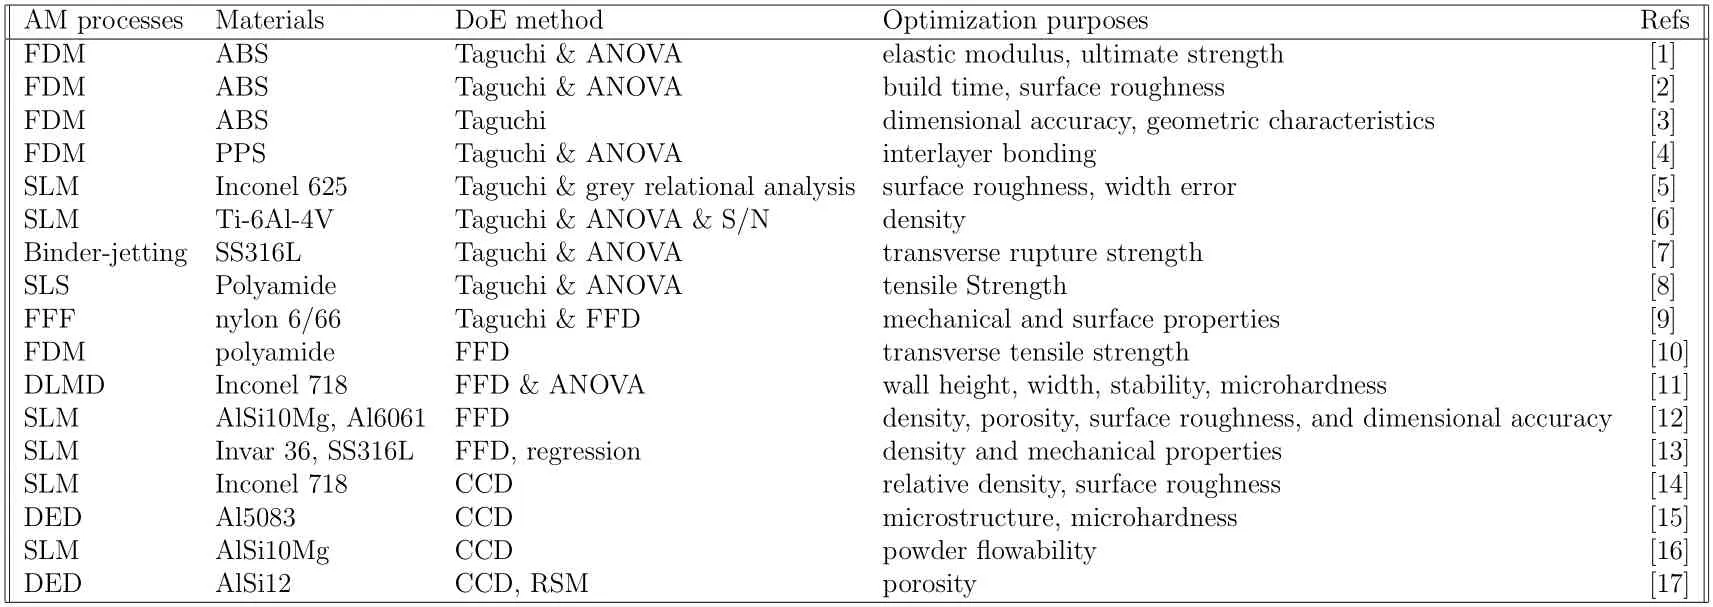
Table 1: DoE methods for AM process optimization techniques.
2.1.1 Full Factorial Design (FFD)
FFD is a DoE approach that is commonly used in Process Parameter Optimization(PPO) for AM.The FFD involves examining all possible combinations of input parameters and their levels in order to determine their effects on the output variable.FFD in PPO for AM is discussed in terms of benefits,limitations,and some practical applications.
FFD involves creating a matrix of all possible combinations of input variables and their levels.For example,suppose there are two input parameters,temperature and pressure,and each parameter has two levels,low and high.In that case,the FFD matrix would have four runs or experiments as shown in Table 2.Each run in the FFD matrix represents a unique combination of input variables and their levels.The output variable is then measured for each run,and the results are analyzed to determine the effect of each input parameter on the output variable.

Table 2: FFD matrix for two input variables with two levels each.
Factorial design is a powerful experimental design that allows researchers to study the effects of multiple variables simultaneously.One of the key advantages of factorial design is its ability to reduce experimental error and control confounding variables,which can provide more reliable and accurate results.By manipulating and measuring more than one variable at a time,factorial design enables researchers to investigate the interactions between variables and identify the unique effects of each variable on the outcome.Factorial design also offers a cost-effective way of testing multiple variables and levels,which can save time and resources compared to testing each variable independently.Furthermore,it allows for a deeper analysis of the data,enabling researchers to explore not only the main effects of each variable but also the interactions between them.This can lead to a better understanding of the complex relationships between variables and can generate new insights into the phenomenon being studied.
However,one of the main challenges of factorial design is the difficulty of experimenting with more than two factors or many levels.Careful planning and execution are required to ensure that the experiment is valid and reliable,and any errors or inconsistencies in the operationalization of the factors can lead to inaccurate results.Another potential disadvantage is that the complexity of the design can make it difficult to interpret the results,particularly when there are many interactions between the variables.
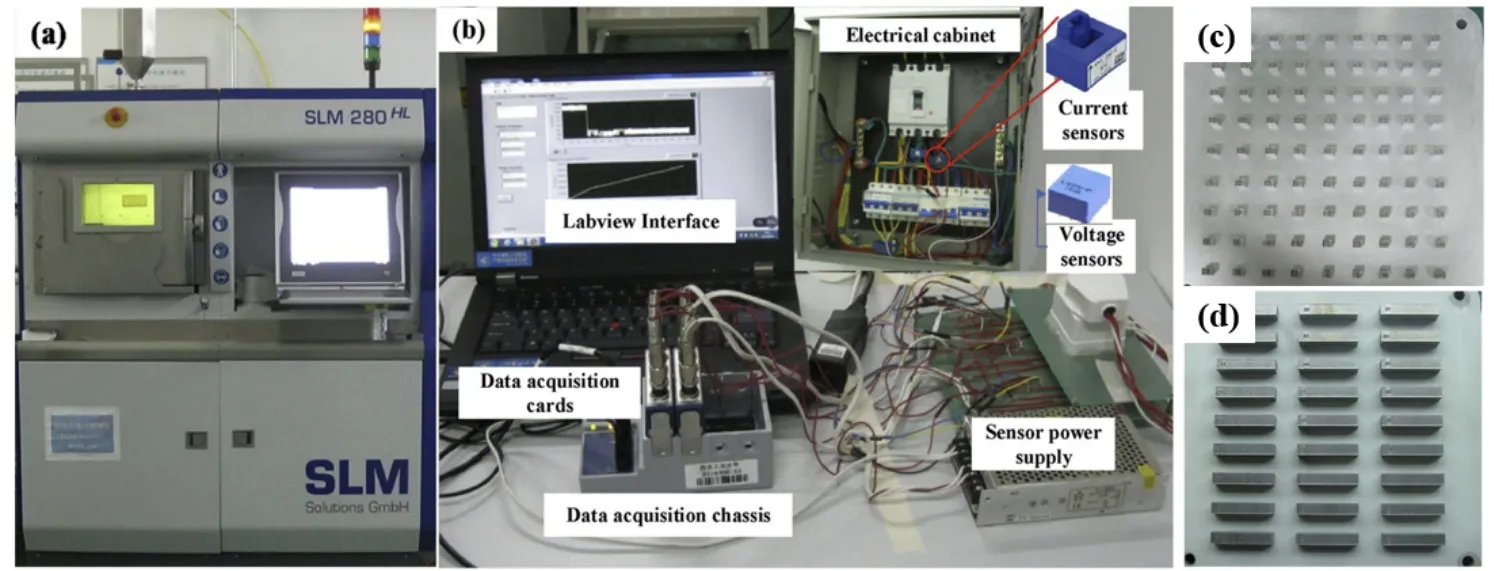
Figure 2: Experiments setup (a),(b) and printing samples (c),(d) in [23].
Despite its limitations,FFD is widely used in PPO for AM.It has been used to optimize process parameters for a wide range of AM processes,including SLS,FDM,and SLA.Peng et al.[23] conducted the FFD in investigating the impacts of process parameters on part quality and electrical energy consumption in SLM of AlSi10Mg specimens.Fig.2 shows the experiments setup and printing samples.The study aims to reduce electrical energy consumption while maintaining quality by optimizing three parameters: laser power,scan speed,and overlap rate.The quality performances,including density,tensile strength,and hardness,were tested on multiple layer specimens,while the energy consumption of the auxiliary system and laser were measured for specific energy consumption (SEC) calculation.The results demonstrate that the density does not increase with increased SEC,while the tensile strength and hardness show increasing trends.Proper selection of process parameters can save up to 27.8%of electrical energy without compromising quality,making the study relevant in promoting the sustainability of AM.Khalid&Peng[24]applied FFD in investigating the sustainability of the FDM process parameters in AM.The study aims to reduce process energy and material consumption in order to improve the sustainability of the FDM process.Various parameters,such as printing layer height,number of shells,material infilling percentage,infilling type,and building orientation,are investigated to find the optimal parameter settings.Both studies demonstrate the effectiveness of FFD in obtaining data for optimizing process parameters for AM,leading to improved sustainability and quality of the final products.By systematically varying and testing the process parameters,FFD enables the identification of the optimal settings that can lead to energy and material savings,and thus reduce the environmental impact of AM.Therefore,the studies provide important insights into the potential of process parameter optimization for sustainable AM,which can help to promote the adoption of this technology in various applications.
2.1.2 Taguchi method
Taguchi method is a robust DoE approach that is widely used in PPO for AM.Developed by Dr.Genichi Taguchi in the 1950s,the Taguchi method aims to minimize the effects of uncontrollable factors on the performance of a product or process by optimizing the controllable factors or input variables [25].
Taguchi method involves selecting a set of controllable factors or input variables and their levels,designing an orthogonal array,conducting experiments based on the array,and analyzing the results using statistical methods.The goal of Taguchi method is to identify the optimal combination of input variables that will result in the least amount of variation in the output variable or process performance.
The Taguchi method offers several advantages that make it a powerful tool for improving product quality and manufacturing processes.One of its strengths is that it focuses on achieving a mean performance characteristic value close to the target value,rather than a value within certain specification limits.This emphasis on mean performance leads to higher product quality and greater customer satisfaction.Additionally,the Taguchi method is straightforward and easy to apply in many engineering situations,which allows for quick identification of problems or narrowing down the scope of a research project.Furthermore,it enables analysis of many parameters with a minimal amount of experimentation,thus saving time and resources.By identifying key parameters with the most effect on performance,further experimentation can focus on those parameters,while ignoring those with little effect.
However,the Taguchi method also has some disadvantages that should be considered.One major limitation is that the results obtained are only relative and do not exactly indicate which parameter has the highest effect on the performance characteristic value.Thus,further testing or experimentation may be necessary to determine the optimal values for these parameters.Additionally,since orthogonal arrays do not test all variable combinations,the method may not be suitable when all relationships between all variables are needed.The Taguchi method has also been criticized for its difficulty in accounting for interactions between parameters,which can affect the accuracy of the results obtained.Moreover,since Taguchi methods are oラine,they may not be suitable for dynamically changing processes such as simulation studies.Finally,the method is most effective in the early stages of process development,as it deals with designing quality in,rather than correcting for poor quality.Once design variables are specified,the use of experimental design may be less cost-effective.
Despite these limitations,the Taguchi method has been widely used in PPO for AM and has shown promising results in optimizing the process parameters to improve the performance of the output variable.Yang et al.[5] investigated the effect of process parameters on the forming quality of Inconel 625 cladding layer in laser AM.The study used the Taguchi method and grey relational analysis to optimize laser power,scanning speed,powder feed rate,and overlapping rate for surface roughness and width error.The overlapping rate was found to have the most significant effect on both parameters.The optimal levels for the selected parameters were determined.The microstructure and composition analysis showed a high content of Cr in both Laves phase and matrix,an increase in Nb content in the Laves phase,and more compact Laves in the nonoverlapping zone.Tura et al.[26]studied the impact of process factors on the quality of FDM printed components,particularly in terms of flexural strength.The Taguchi method was used to adjust process factors such as layer height,raster width,raster angle,and orientation angle.The study utilized ABS specimens,and the flexural strength was evaluated using the UNITEK-94100 universal testing equipment.The hybrid genetic algorithm with RSM,response surface approach,and Taguchi method was used to optimize the impacts of parameters on the experimental results.The genetic algorithm method was found to be the most promising among the three optimization techniques.The two studies show that the Taguchi method is a valuable tool in collecting data for optimizing process parameters to improve the quality and performance of AM products.
2.1.3 Central Composite Design (CCD)
CCD is a statistical tool that helps in the optimization of process parameters.It is a widely used DoE technique that is used to model and analyze complex systems.CCD involves a combination of factorial design and RSM.In CCD,the design space is divided into three regions: the factorial region,the axial region,and the center point region.The factorial region consists of all possible combinations of the levels of the factors,while the axial region consists of the levels at which the curvature of the response surface is estimated.The center point region consists of the levels at which the response is measured to estimate the pure error.
CCD is widely used in the PPO of AM because it helps in identifying the critical process parameters and their optimal values.CCD uses a limited number of experiments to estimate the effect of each process parameter on the quality and properties of the final product.The experiments are designed in such a way that they cover the entire design space.The results of the experiments are then used to develop a response surface model that relates the process parameters to the response variable(i.e.,the quality and properties of the final product).
The response surface model developed using CCD is used to find the optimal process parameters that maximize the response variable.The response surface model is used to predict the response variable at any point in the design space.Therefore,the optimal process parameters can be found by maximizing the predicted response variable.This approach reduces the number of experiments required to optimize the process parameters and saves time and resources.
One of the significant advantages of CCD is its ability to accommodate a minimum of two factors,whereas Box-Behnken design can only accommodate a minimum of three numerical factors.Additionally,CCD includes axial or star points,which increases the number of levels to five levels,providing experimental design flexibility.CCD has a clear advantage over Box-Behnken design in that it allows experimental designers to determine the effect of factors on the response,even when the designer goes beyond or below the chosen levels of factors.This makes CCD an effective tool for identifying key factors that affect the response,thereby allowing further experimentation on these parameters.
However,there are some disadvantages of CCD that should be considered.One of the main disadvantages is that CCD requires a rigid pattern of data collection points,which may not always be suitable for human factors engineering studies.The study must have five levels of each factor,which must be spaced symmetrically about the center at particular locations on a scale.This can be time-consuming and difficult to achieve,especially when dealing with a large number of factors.Another potential disadvantage of CCD is that,under similar conditions,the number of tests required may be greater than Box-Behnken design.This can increase the cost and time needed to complete the experimental design.Despite these limitations,CCD remains a popular RSM due to its ability to accommodate a range of factors and provide flexibility in experimental design.
CCD has been used in various AM processes such as FDM,SLS,and SLA.Lu&Shi [14] developed CCD to investigate the impact of four key process parameters on the quality indicators of SLM-produced Inconel 718 components.The study generated prediction models for relative density and surface roughness,and ANOVA analysis was conducted.The study found that the CCD method was effective in identifying the optimal process parameters to achieve desired quality indicators.Three multi-objective optimization approaches were also developed to balance the competing objectives of maximizing relative density and minimizing surface roughness.Svetlizky et al.[15] investigated the influence of processing parameters on the geometrical characteristics of Al5083 double tracks fabricated using Laser Engineered Net Shaping (LENS R○) and emphasizes the use of CCD RSM to develop an empirical statistical prediction model.The study found that powder mass flow rate has a strong influence on the deposited track’s height and dilution,and the interaction between laser power and hatch spacing has significant effects on both responses.The study highlights the importance of CCD in understanding the influence of processing parameters on the characteristics of the deposited material.
2.2 Simulation
Instead of experimental data,there is another approach to obtain the data sets for ML–physically-based simulation.By doing so,some data sets that are difficult to be generated through experiments or too expensive can be achieved using the simulations.Physics-based models can illuminate the underlying processes that give rise to particular processing features including melt pool shape,keyholes,and microstructure.

Figure 3: ML-physically-based simulation.(a) Flowchat of [27].(b) Temperature evolving for singletrack simulation in [28].
Kiran et al.[29]performed a comprehensive study that involved conducting both single-track and multi-track thermal simulations in order to develop a suitable weld model for the DED simulation.The simulation results were then experimentally verified through the DED experiment.A comparison of the temperature trends obtained from the numerical simulation and the experimental results indicated a high degree of agreement between the two.However,the finite element process simulation posed significant challenges in terms of computing time and data management,particularly due to the large number of weld tracks in 3D solid AM components.To mitigate this issue,they applied a thermal cycle heat input method,which involves layer-by-layer activation of components and cyclic heat input.This approach significantly reduced the computing time required for the simulation.In addition,they conducted a thorough assessment of the thermal and residual stress using numerical findings and experimental data.The study investigated the optimization,thermal behavior,and residual stress prediction for a range of scenarios and claimed a reduction in calculation time.
Wu et al.[27] employed the CFD technique to examine the behavior of the powder bed during the laser melting process.The outline is shown in Fig.3(a).In order to accurately predict and evaluate the properties of the molten track and the quality of the powder bed,a backpropagation neural network (BPNN) model was devised using the results of the CFD simulations.This BPNN model integrated the information obtained from the CFD analysis to provide a comprehensive assessment of the powder bed behavior during the laser melting process.
Yang et al.[28],in their study,performed predictions regarding the melt-pool width for various combinations of processing parameters by utilizing the results obtained from a single-track,heat-transfer simulation of the LPBF process.The singletrack simulation is shown in Fig.3(b).To enhance the efficiency of their processing parameters,they integrated GPR,Kriging method,Dynamic Variance-Covariance Matrix,and GA into their prediction system.The results of their methodology were impressive,with an average relative error magnitude(AREM)of less than 0.005 percent being recorded in the AM case study,and a maximum relative error magnitude(MREM) of no greater than 0.03 percent.This demonstrates the effectiveness of their integrated approach in producing accurate predictions regarding the melt-pool width,and the potential for their methodology to contribute to the advancement of the LPBF process.
In order to overcome the difficulties associated with experimentally analyzing the spreading process,Zhang et al.[30] utilized a computational modeling framework that employed the discrete element method (DEM).This method was chosen as a means of simulating the spreading of Ti-6Al-4V powder on a smooth surface.However,due to the computationally intensive nature of DEM simulations,the results generated were highly non-linear.To overcome this challenge,They utilized ML techniques to interpolate between the outputs produced by a limited number of DEM simulations.Through this effort,they were able to develop a spreading process map that identified the optimal spreader settings required to achieve the desired surface roughness and spread speed.
It has been widely acknowledged that there is a potential for discrepancies between simulation results and experimental observations [19].This is due in part to the tendency of contemporary simulation methods to focus on a limited number of tracks or layers [31,32].Such a narrow scope of analysis can hinder the accuracy of the data collected during the simulation and therefore the ability to optimize the results through the use of simulation.Consequently,the limitations and inherent biases present in the simulation must be carefully considered and accounted for when interpreting simulation results and utilizing them to inform decision-making.
3 Modeling
The primary goal of modeling is to establish the relationship between the results expected to optimize and the input process parameters,which involves the use of physical and mathematical models to describe the complex interactions between process parameters,materials,and the final properties of AM products.There are some mature methods to build these relationships up,including regression,RSM,Kriging,GPR,SVR,RF,and ANN.Regression and RSM are simple data-driven surrogate models compared to other methods.They oversimplify the model so that only approximate relationships between inputs and outputs can be obtained.The inaccuracy of these models can lead to a substantial loss of the significance of the subsequent optimization process [33,34].Therefore,some more advanced models,including Kriging,GPR,SVR,RF,and ANN,need to be applied to accurately establish the relationship between printing parameters and expected results.Table 3provides a comprehensive overview of the current research that has been conducted using ML to establish the relationship between process parameters and output results.In this section,three different types of modeling for the PPO in AM will be discussed,including mechanistic modeling,classical methods of modeling,and surrogate modeling.
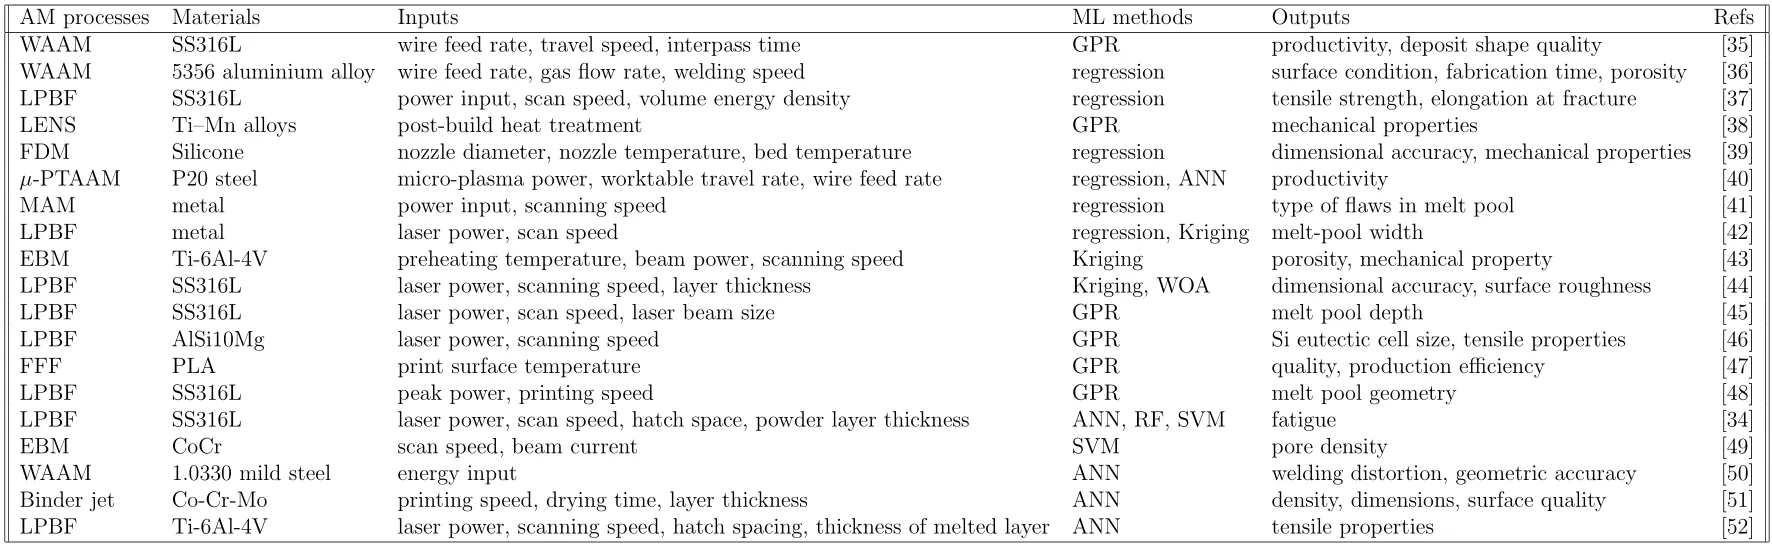
Table 3: AM process optimization techniques.
3.1 Mechanistic modeling
Mechanistic modeling is an indispensable aspect of the PPO in AM,given the complex interplay between multiple scales and physical phenomena inherent in the AM process.Deriving a priori information from first principles in AM remains challenging,owing to the multi-scale and multi-physics interactions that occur.Furthermore,experimental characterization of the AM process is hindered by the highly transient nature of the process,and the extremely short time scales involved.Consequently,mechanistic modeling through analytical or numerical simulations offers researchers the means to probe the physical interactions underlying the AM process,enabling insights into the process that would otherwise be difficult to obtain.
Over the years,experiments and simulations have been conducted to shed light on the physical mechanisms involved in the AM process at various scales,ranging from the nanoscale [53] to the mesoscale [54].Despite this progress,the PSP relationship in AM remains a challenging task due to the multi-scale multi-physics interaction involved [55].The extremely short time scales that arise from the rapid solidification rates in AM also pose a significant challenge in experimental characterization of the process.Therefore,mechanistic modeling through analytical or numerical simulations can facilitate researchers’ exploration of the physical interactions during the AM process by enabling investigations of underlying phenomena at shorter time scales.

Figure 4: The outline of modeling classification.
The mesoscale,particularly the melt pool,has been the focus of most modeling efforts in AM.At this scale,analytical models are an attractive option due to their computational efficiency.These models are derived from laser welding research and are variations of Rosenthal’s solution,including Rylakin’s model,Eagar-Tsai’s model,and others[56].However,such models are only applicable in the conduction regime since they assume pure conduction.Therefore,when melt pool convection becomes significant,the prediction will deviate from the actual case[57].Moreover,these analytical models are unable to account for the volatile nature of the keyhole,rendering them insufficient for some applications in AM.
In contrast,Validated numerical models have gained increasing attention in PPO for AM due to their greater accuracy compared to analytical models.Finite element models(FEMs)are considered the most practical models for part-scale modeling and simulation.While non-FEMs,such as physically-based PSP models,have been developed for PPO of specific materials,their focus is usually on predicting mechanical properties such as yield strength,flow stress,and strain hardening [58].However,part-scale models fall short in providing accurate temperature fields at the melt pool level as they ignore fluid dynamic effects.
To overcome this limitation,high-fidelity models have been developed to incorporate fluid dynamic effects,typically through the use of CFD models [59].These models have the ability to capture the complex effects of Marangoni convections widening or deepening the melt pool,evaporation,advection of materials,and the effects of vapor plume.However,the use of such models can be computationally costly and have limited simulation scale.
While analytical models are computationally inexpensive and can be used to simulate the melt pool in the conduction regime,their accuracy decreases when melt pool convection becomes significant.Moreover,they cannot predict the volatile nature of the keyhole.Thus,validated numerical models are necessary for accurate prediction of the melt pool dynamics,especially for the optimization of process parameters in AM.
The use of high-fidelity mechanistic models in AM has proven to be an effective method for accurately predicting the PSP relationships.However,these models are often associated with exorbitant computational requirements,making them computationally prohibitive for practical applications.Despite their ability to produce accurate results,high-fidelity models are unsuitable for multi-objective optimizations since it is infeasible to directly sample the process space,and performing so would be computationally intractable [60].Thus,researchers have focused on the development of analytical mechanistic models that can sample the process space for identification of processing regions and optimization purposes.These models are computationally less expensive,making them suitable for use in the optimization of AM processes.
3.2 Classical methods of modeling
Classical methods of modeling involve using statistical techniques such as RSM or regression via variance estimation decomposition to model the input-output relationship.These methods rely on experimental data to construct a mathematical model that describes the process parameters’ effect on the output variables.Although these models provide approximations of the input-output relationship,they oversimplify the process parameters,leading to limited accuracy in predicting the output variables.As a result,deeper understanding and modeling of the PSP relationship are necessary to provide a more adequate description of the AM part quality from its process parameters.
3.2.1 Classical regression
Classical regression is a statistical method used to model the relationship between a dependent variable and one or more independent variables.It involves fitting a mathematical function to a set of observed data points such that the function can be used to predict the value of the dependent variable given the values of the independent variables.
There are several types of regression functions that can be used in AM PPO,including linear regression,multiple regression,and polynomial regression.Linear regression is the simplest type of regression and involves fitting a straight line to the observed data points.Multiple regression involves fitting a linear equation to the observed data points with more than one independent variable.Polynomial regression involves fitting a polynomial equation to the observed data points.The regression function is typically expressed as an equation of the form:
whereyis the dependent variable,a0is the intercept,anda1toanandb0toare the regression coefficients of the independent variablesx1toxn.The choice of regression function depends on the nature of the relationship between the process parameters and the quality characteristics of the printed parts.If the relationship is linear,then linear regression is the most appropriate method.If the relationship is non-linear,then polynomial regression is more appropriate.
Classical regression has several advantages in AM PPO.Firstly,it is a powerful tool for identifying the optimal values of process parameters that will result in the production of parts with the desired quality characteristics.Secondly,it is a cost-effective method for PPO since it does not require a large number of experiments.Thirdly,it is a versatile method that can be applied to different types of AM processes.However,one of the main challenges of using classical regression in AM is that the relationship between the process parameters and the output response may not be linear.In AM,the process parameters can interact with each other in complex ways,leading to nonlinear relationships between the process parameters and the output response [61].Classical regression analysis assumes that the relationship between the dependent variable and the independent variables is linear.If the relationship is nonlinear,the classical regression model may not accurately predict the output response.Besides,overfitting is a common problem in classical regression analysis,where the model fits the training data too closely,resulting in poor performance on new data[62].In AM,overfitting can occur if the model is too complex or if there is not enough data to support the model.Overfitting can lead to inaccurate predictions and unreliable PPO.
There are many research applying regression to find the relationship between process parameters and output qualities.Wu et al.[63] proposed a double-wire SS316L stainless steel arc AM with a two-direction auxiliary gas process to improve efficiency in AM.The focus is on three parameters: auxiliary gas nozzle angle,auxiliary gas flow rate,and nozzle-to-substrate distance.Using the Box-Behnken Design response surface,a regression equation is established to optimize the parameters.The results obtain the optimal auxiliary gas process parameters,which improved both the morphology and properties.The study highlights the importance of regression in optimizing AM processes.Spoerk et al.[64] improved the mechanical properties of parts produced by extrusion-based AM by maximizing the intra-and inter-layer cohesion between adjacent strands.A detailed parametric statistical evaluation was conducted to identify key parameters,including printing temperatures,layer thicknesses,and layer designs.The inter-layer cohesion was evaluated using the double cantilever beam test,and an optimal layer-design was found to be crucial in optimizing strength for different loading directions.Regression analysis was used to establish the relationship between the various parameters and the mechanical performance of the printed parts,leading to a tremendous improvement in strength and resulting in strengths of roughly 90% of those of compression-molded parts.
3.2.2 Response surface modeling
RSM is a powerful statistical technique used in the optimization of AM process parameters.The ability to optimize the process parameters for AM is critical for producing high-quality parts with the desired physical and mechanical properties.RSM is a data-driven approach that allows for the creation of a mathematical model to describe the relationship between the input parameters and the response variable of interest.
RSM is a statistical approach that involves the fitting of a mathematical model to experimental data.The goal is to determine the relationship between the input variables and the response variable of interest.The response variable is typically a measure of part quality,such as porosity,density,strength,or surface roughness.The input variables are the process parameters,such as laser power,scan speed,layer thickness,and hatch spacing.RSM assumes that the response variable can be expressed as a polynomial function of the input variables,up to a certain degree.The degree of the polynomial is determined by the number of input variables and the desired level of accuracy.
The RSM approach involves a series of experiments to collect data on the response variable at different levels of the input variables.The data is then analyzed using statistical software to fit a mathematical model to the data.The model is then used to predict the response variable at different combinations of the input variables.The model can also be used to identify the optimal combination of input variables that maximizes or minimizes the response variable.The optimization can be done using various optimization algorithms,such as gradient descent,GA,or SA.
RSM has been successfully applied in the optimization of AM process parameters.Peng et al.[65] improved the accuracy and efficiency of FDM through PPO.RSM is used to derive the relationship between the input variables (control factors)and output responses (dimensional error,warp deformation,and built time).The study uses a uniform experiment design and a fuzzy inference system to convert the three output responses into a single comprehensive response.Second-order RSM is applied to derive the relation between the comprehensive response and the input variables.The fitness function is created using the penalty function and is solved with the genetic algorithm toolbox in Matlab software.The study concludes that the proposed approach can effectively improve the accuracy and efficiency in the FDM process.Dada et al.[66] optimized the laser processing parameters of additively manufactured high entropy alloys for aerospace applications.A FFD was used to determine the impact of laser power and scan speed on the micro-hardness properties of the alloys.RSM was used to optimize the process parameters,and ANOVA was employed to verify the model’s significance.The output response was the micro-hardness properties of the HEAs.The strong correlation between the predicted microhardness response and the actual experimental data validated the model’s effectiveness.RSM proved to be a cost-effective tool for optimizing laser process parameters to improve component quality and mechanical properties in AM.Garg et al.[67] improved the dimensional accuracy of FFF Thermoplastic Polyurethane (TPU) parts by optimizing three key process parameters: layer thickness,infill density,and printing speed.The RSM was used to relate the process parameters to dimensional accuracy.Main effect plots Analysis of Means were drawn to evaluate the optimal process parameters using RSM optimization Analysis.The findings revealed that layer thickness was the most important parameter for achieving higher dimensional accuracy,followed by printing speed and infill density.Mohamed et al.[68]applied RSM to optimize the process parameters of FDM in order to reduce build time and feedstock material consumption while maintaining high mechanical performance.The study examines the effects of various FDM parameters,including layer thickness,air gap,raster angle,build orientation,road width,and number of contours,on process quality characteristics such as build time,feedstock material consumption,and dynamic flexural modulus.Mathematical models are developed using Q-optimal design,and the adequacy and significance of these models are examined using ANOVA.The optimal process parameter settings are determined,and a confirmation test is conducted to verify the developed models and the optimal settings.The results suggest that Q-optimal design is a promising method for optimizing FDM process parameters,and confirm the adequacy of the developed models.Shi et al.[69] established a quadratic regression model using RSM to predict the martensite transformation temperatures (MTTs) of SLM-NiTi alloys during the SLM process.The regression analysis showed that the interaction of laser power and scanning speed has a significant impact on both MTTs and the tensile properties of SLM-fabricated NiTi samples.The results revealed that the group of 150W samples had high elongation,while the high tensile recovery strain was presented in the 100 W series.This study highlights the potential of regression analysis to modulate phase transformations and mechanical properties in SLM-fabricated NiTi,which can be utilized for various applications.
One of the primary advantages of RSM is its efficiency in generating a large amount of information from a relatively small number of experiments.Compared to classical experimental methods where only one variable is investigated at a time,RSM can evaluate multiple variables simultaneously.This reduces the time and cost involved in conducting experiments.Another advantage of RSM is that it allows the observation of interaction effects between independent input parameters.The model equation generated from the data can explain the effect of combinations of independent input variables on the outcome of a process or product.This is particularly useful in optimizing the system,as it helps identify the most significant factors that affect the outcome.
However,there are some disadvantages for RSM.For example,fitting data to a second-order polynomial for systems that contain some curvature is often not well accommodated by the second-order polynomials produced.This can lead to inaccurate models and predictions.If the system cannot be explained by a first or second-order polynomial,it may be necessary to reduce the range of independent input variables under consideration.Another disadvantage of RSM is that it is unable to explain why an interaction has occurred,even though it has the potential to evaluate the interaction effects of the independent input parameters.This can make it difficult to optimize the system or make predictions about the behavior of the system under different conditions.Finally,RSM is poor at predicting the potential outcomes for a system operated outside the range of study under consideration.This limitation can be significant if the system is expected to operate outside the range of the independent input variables considered during the study.
3.3 Surrogate modeling
Surrogate modeling involves using ML algorithms such as Kriging,SVM,GPR,NN,and so on,to model the input-output relationship.These models use historical data to learn the input-output relationship and can then be used to predict the output variables for new input values.Data-driven approaches have gained tremendous interest for the precipitation and resurgence of the field of ML in AM.These models are often faster and more accurate than classical methods due to their ability to capture complex nonlinear relationships between the input and output variables.
Kriging,SVM,and GP models have been used to model the PSP relationship in AM.Kriging models provide a probabilistic representation of the input-output relationship and can capture nonlinear relationships between the input and output variables.SVM models are based on the principle of structural risk minimization and can handle high-dimensional input spaces.GP models provide a Bayesian framework for modeling the input-output relationship and can provide uncertainty estimates of the predicted output variables.NN models are inspired by the structure and function of the human brain and can capture complex nonlinear relationships between the input and output variables.In this section,the common methods of surrogate modeling for PPO of AM will be introduced,including Kriging,GPR,SVR,RF,and ANN.
3.3.1 Gaussian process regression
GPR is a type of Bayesian regression method that models the relationship between input and output variables.The primary objective of GPR is to predict the output variable given the input variable by constructing a Gaussian distribution over the output variable.The Gaussian distribution is defined by its mean and covariance function,which specifies the correlation between the input and output variables.GPR uses the training data to learn the mean and covariance function and generates a probability distribution over the output variable for any new input variable.GPR is a non-parametric regression method,which means that it does not assume any specific functional form of the underlying relationship between input and output variables.
The use of GPR in AM PPO involves constructing a surrogate model based on experimental data that relates the process parameters to the performance characteristics of the AM part.The surrogate model is used to predict the performance of the AM part for any combination of process parameters.The GPR model can be trained on a set of experimental data to learn the correlation between the process parameters and the performance characteristics of the AM part.The trained model can then be used to optimize the process parameters to achieve a desired performance characteristic.
One of the main advantages of GPR is its ability to handle high-dimensional data and complex relationships between the input and output variables.GPR can handle non-linear relationships and provides a probabilistic estimate of the output variable,which allows for uncertainty quantification in the prediction.Additionally,GPR can be used with a small amount of data,which makes it suitable for optimization studies that require a limited number of experiments.GPR is also a flexible method that can be easily extended to incorporate new data and update the model accordingly.
However,GPR has some limitations that must be considered when applying it to AM PPO.One of the main limitations of GPR is its computational complexity.The calculation of the covariance function involves the inversion of a matrix,which can be computationally expensive for large datasets.Additionally,GPR requires a proper selection of hyperparameters,which can affect the accuracy of the prediction.The selection of hyperparameters can be time-consuming and requires expert knowledge.
Another limitation of GPR is that it assumes that the underlying relationship between input and output variables is stationary,which means that the relationship does not change over time or space.However,in AM,the relationship between process parameters and part quality may change due to factors such as material properties,machine variation,and environmental conditions.This can lead to inaccuracies in the GPR model,and the model may need to be updated regularly to reflect the changing relationship.
GPR is quite mature in the PPO of AM.Tapia et al.[70] developed a Gaussian process-based predictive model to address the challenge of correlating processing parameters with the properties of metallic parts produced using SLM,an AM process.The model is based on a spatial GPR that predicts the porosity of the part as a function of SLM process parameters.The Bayesian inference framework is used to estimate statistical model parameters,and Kriging is applied to predict porosity.The study validates the proposed framework on 17-4 PH stainless steel parts manufactured on a ProX 100 SLM system.Lee [35] modeled the WAAM process parameters,including uncertainties,using a GPR method.This enabled the development of a WAAM optimization model that improved both productivity and deposit shape quality.The accuracy of the optimized output was confirmed through close agreement with experimental values.The study highlights the usefulness of GPR for depositing nearly ideal material shapes in WAAM.Lee et al.[71] utlized explainable ML (xML) models to predict and understand the geometry and types of defects in MAM-processed Fe-Ni alloys,with a focus on the usefulness of GPR.GPR was utilized to predict the as-printed height and porosity,while a SVM was used to classify defect types based on the predicted porosities.The Shapley additive explanation approach for xML was used to analyze feature importance.The results suggest that the GPR model approach could be useful in predicting MAM product properties and linking processing with results.Tapia et al.[45]developed a Gaussian process-based surrogate model to create a material data sheet standard for LPBF metal-based AM.The model predicts melt pool depth in single-track experiments using laser power,scan speed,and laser beam size combinations.This statistical framework is robust and useful for different materials.The study also shows that high-fidelity simulation models of LPBF can be used for building surrogate models,which are beneficial for studying different materials.
3.3.2 Kriging
Kriging is a statistical approach that has gained a lot of interest in the field of modeling for optimization in PPO of AM.This approach is also known as GPR and is a type of surrogate modeling.Kriging is a method for interpolating or smoothing data and is based on the assumption of spatial correlation.It is commonly used for geostatistical applications,but it has found its way into other fields such as engineering,finance,and medical research.In the context of AM,Kriging is used to create a surrogate model that can predict the quality of a part based on the input parameters of the printing process.
The fundamental idea behind Kriging is to use a set of observations to create a function that can predict values at new locations.This function is defined as a Gaussian process and is characterized by a mean function and a covariance function.The mean function represents the expected value of the process,and the covariance function describes the spatial correlation of the process.In practice,the covariance function is parameterized by a set of hyperparameters that must be estimated from the data.
One advantage of Kriging over other surrogate modeling approaches is that it provides a probabilistic estimate of the predicted values.This means that the uncertainty in the predictions can be quantified,and the predictions can be adjusted based on the level of uncertainty.Kriging is also a non-parametric approach,which means that it does not assume a specific functional form for the relationship between the input parameters and the quality of the printed part.This is particularly useful in AM,where the relationship between process parameters and part quality can be complex and non-linear.
However,there are some limitations to the use of Kriging in PPO.One limitation is that the accuracy of the predictions depends on the quality and representativeness of the experimental data.If the experimental data is sparse or unrepresentative of the input parameter space,then the Kriging model may not be able to accurately predict the quality of the printed parts.Another limitation is that Kriging assumes that the input parameters are continuous,which may not be the case in some AM processes.
There has been growing interest in the application of Kriging in the optimization of process parameters for AM.Moges et al.[42] proposed a novel hybrid modeling framework for LPBF process to improve the accuracy of melt-pool width prediction.To achieve this,both physics-based simulations and experimental data are combined to create a dataset of melt-pool widths.The hybrid model is then developed using data-driven modeling techniques,including polynomial regression and Kriging methods.The performance of the hybrid model is compared with the results of simulations and surrogate models constructed from the original CFD model and experimental measurements.The study shows that the Kriging-based hybrid model provides better prediction accuracy and computational time.The research demonstrates the potential of Kriging in AM PPO.Cao et al.[44] proposed a data-driven framework to optimize process parameters of LPBF for obtaining satisfactory surface roughness and dimensional accuracy.The effects of key process parameters on the LPBF part’s surface roughness and dimensional accuracy are analyzed.A ML technique,specifically Kriging,is used to predict the surface roughness and dimensional accuracy in the whole process parameters space.The predicted values are used as an objective value when using the whale optimization algorithm (WOA) to search for the global optimal process parameters.In the verification experiments,LPBF parts with better surface finish and dimensional accuracy were obtained with optimized process parameters,consistent with the experimental results.Dharmanwan et al.[72]proposed an integrated learning-correction framework for Multi-Layer Multi-Bead(MLMB)deposition in Robotic WAAM.The framework is adapted from Model-Based Reinforcement Learning and uses Kriging to learn the direct effect of process parameters on MLMB print and correct for inter-layer geometric digression.The advantage is that this learning architecture can be used in conjunction with actual parts printing,minimizing the required training time and material wastage.The proposed framework is experimentally evaluated on an actual robotic WAAM system.
3.3.3 Support vector regression
SVR is a data-driven approach used in modeling for optimization in PPO of AM.In recent years,SVR has gained significant attention in the field of AM due to its ability to model complex input-output relationships,making it an effective tool in process optimization.
SVR is a type of ML algorithm that is based on the principles of SVM.It is a non-parametric method that is used for both regression and classification tasks.In regression tasks,SVR attempts to fit a hyperplane that captures the maximum possible number of data points while maintaining a certain margin of error.The hyperplane is represented by a linear function that maps input variables to output variables.The objective of SVR is to find the optimal hyperplane that minimizes the error between predicted and actual values.
The key feature of SVR is the use of a kernel function,which allows the algorithm to model nonlinear relationships between input and output variables.The kernel function transforms the input data into a higher dimensional space,where the data can be linearly separated.The transformed data is then used to train the SVR model.There are several kernel functions that can be used in SVR,including linear,polynomial,and radial basis function (RBF) kernels.
SVR has been successfully applied in PPO of AM.In this context,SVR is used to model the relationship between process parameters and the resulting part quality.The model is trained using a set of input-output pairs obtained through experiments or simulations.Once the model is trained,it can be used to predict the output values for new input data.
One of the advantages of SVR is its ability to handle noisy and sparse data.In AM,process data is often noisy and incomplete due to the complex nature of the process.SVR can effectively deal with such data and produce accurate predictions.Another advantage of SVR is its flexibility in choosing the kernel function.The choice of kernel function depends on the complexity of the input-output relationship.For instance,if the relationship is linear,a linear kernel can be used,while a nonlinear relationship can be modeled using a polynomial or RBF kernel.
Despite its advantages,SVR has some limitations in the context of AM.One limitation is its computational complexity,especially when dealing with large datasets.The training process can be time-consuming,and the model may not scale well to large datasets.Another limitation is the need for expert knowledge in choosing the appropriate kernel function and tuning the model hyperparameters.This requires a deep understanding of the process and its underlying mechanisms.
Some research are conducted to optimize process parameters in AM using SVR.Xia et al.[73]developed a laser sensor-based surface roughness measuring method to improve the surface integrity of deposited layers by WAAM,and different ML models were developed to predict the surface roughness,including ANFIS,ELM,and SVR.The ANFIS model was optimized using GA and PSO algorithms.The study found that GA-ANFIS had superiority in predicting surface roughness,with an RMSE of 0.0694,R2of 0.93516,MAE of 0.0574,and MAPE of 14.15%.The SVR model was one of the ML models used for predicting surface roughness.Xiao et al.[74]focused on the sensitivity analysis (SA)-based parameter optimization framework for the 3D printing of continuous carbon fiber/epoxy composites (CCF/EPCs) and their mechanical properties.The research establishes a surrogate model for a process parameter–mechanical property relationship using SVR analysis of experimental data.The SA is performed on the SVR surrogate model to calculate the importance of each individual 3D printing parameter on the mechanical properties of the printed samples.Finally,the optimal 3D printing parameters and the corresponding flexural strength and flexural modulus of the printed samples are predicted and verified by experiments.The proposed framework shows that SVR can be used as a highaccuracy tool to optimize the 3D printing parameters for the AM of CCF/EPCs.
3.3.4 Random forest
RF is a ML technique that has recently gained interest in the modeling and optimization of AM processes.RF is a supervised learning algorithm that can be used for both regression and classification problems.The technique is based on the idea of combining multiple decision trees,where each tree is constructed using a different subset of the training data and a different subset of the features.The output of RF is obtained by averaging the outputs of all the trees.
The application of RF to AM PPO involves the construction of a predictive model that relates the process parameters to the output properties of the manufactured part.The model is constructed using a training dataset,which consists of a set of input-output pairs.The input parameters can be the process parameters such as laser power,scanning speed,layer thickness,etc.,and the output properties can be the quality measures such as porosity,surface roughness,tensile strength,etc.
The RF algorithm constructs an ensemble of decision trees,where each tree is grown using a different subset of the training data and a different subset of the input parameters.The trees are grown recursively by selecting the best split at each node based on the information gain criterion.The information gain criterion measures the reduction in entropy (or impurity) of the target variable (output property) by splitting the data based on a particular input parameter.
For RF,one of the advantages is that it can handle both continuous and categorical input parameters,and it can also handle missing data.In addition,RF can estimate the importance of each input parameter,which can provide insights into the underlying physics of the AM process.The importance of an input parameter is estimated by measuring the decrease in accuracy of the model when that input parameter is permuted randomly.Another advantage of RF is that it provides a measure of feature importance,which can be used to identify the most important process parameters.This feature is particularly useful in AM,where there are many process parameters to consider.Finally,RF is easy to implement and can be trained quickly,which makes it a popular choice for PPO in AM.
However,RF also has several drawbacks.It does not provide a probabilistic estimate of the response,which can be a disadvantage in some applications.It can also be sensitive to the choice of hyperparameters,such as the number of trees in the forest and the maximum depth of the trees.Additionally,RF is prone to bias towards the most frequent classes in imbalanced datasets.
RF has been applied successfully to AM PPO in several studies.Zhan &Li [75] developed a data-driven approach for fatigue life prediction of AM SS316L in aerospace engineering.The approach considers the effects of AM process parameters,and three ML models,namely ANN,RF,and SVM,are used for training the data produced by the continuum damage mechanics technique.Among the three ML models,RF is emphasized for its effectiveness in predicting the fatigue life of AM metal parts.The predicted results are verified with published experimental data,and detailed parametric studies are conducted using the ML models to investigate significant characteristics.Yaseer &Chen [76] emphasized the successful implementation of two ML methods,RF and Multilayer Perceptron,for accurately modeling surface roughness in WAAM using a weaving path.While most researchers only consider weld bead width,height,and penetration in WAAM,layer roughness also affects the machining cost and mechanical properties of fabricated parts.The study demonstrates that if the roughness of a deposited layer can be reduced,material wastage will be reduced,and better bonding between adjacent layers can be achieved.Among the two ML methods,RF is found to give better results in terms of accuracy and computational time.Mycroft et al.[77]introduced a machine-learning framework for printability analysis in metal powder-bed fusion AM,focusing on the impact of geometry.The framework consists of constructing strenuous test artifacts,measuring their printability,and constructing a predictive model using ML.The RF algorithm is used to estimate the printability of a given artifact before it is manufactured.The authors demonstrate that their predictive model provides an accurate estimate of the maximum performance that can be obtained from the AM process.
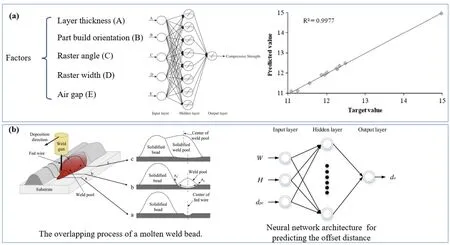
Figure 5: (a) ANN architecture and performance of neural model in [78].(b) The overlapping process and neural network architecture in [79].
3.3.5 Artificial neural networks
ANN is a type of data-driven modeling approach that has gained tremendous interest for the optimization of AM process parameters.ANNs have proven to be effective in capturing complex relationships between input and output variables,making them particularly useful for modeling and optimizing AM processes.
The basic structure of an ANN consists of layers of interconnected nodes,or“neurons” Input data is fed into the network,processed through multiple layers of hidden neurons,and an output is generated.The strength and pattern of the connections between the neurons is determined through a process called “training”where the network is fed a large amount of data with known input-output pairs and adjusts its weights to minimize the difference between the predicted and actual outputs.Once trained,the ANN can be used to predict outputs for new inputs that it has not previously seen.
In AM,ANNs have been used for a variety of applications,including process monitoring,quality control,and parameter optimization.One of the major advantages of ANNs is their ability to capture complex,nonlinear relationships between inputs and outputs,which is particularly important in AM where the relationships can be highly nonlinear and difficult to capture using traditional modeling approaches.For example,ANNs have been used to predict the mechanical properties of AM parts based on their process parameters,such as laser power,scan speed,and layer thickness.By training an ANN on a dataset of AM process parameters and corresponding mechanical properties,the network can learn to predict the properties of new parts based on their processing parameters.
Another advantage of ANNs is their ability to handle high-dimensional data,such as the large number of input variables typically encountered in AM.By using multiple hidden layers,ANNs can capture complex interactions between the input variables,which can be difficult to do with traditional statistical modeling approaches.This makes ANNs well-suited for AM,where the optimization of process parameters often involves a large number of variables.
However,there are also some challenges associated with using ANNs for AM process optimization.One challenge is the need for a large amount of training data to properly train the network.In some cases,this may require extensive experimental testing,which can be time-consuming and expensive.Additionally,ANNs can be prone to overfitting,where the network becomes too complex and begins to fit to the noise in the training data rather than the underlying patterns.To prevent overfitting,it is important to carefully choose the architecture of the network and the number of hidden layers and neurons.
Despite these challenges,ANNs have shown to be a promising modeling approach for the optimization of AM process parameters.By capturing complex,nonlinear relationships between inputs and outputs,ANNs can provide accurate predictions of part properties based on their processing parameters,which can help to reduce the time and cost associated with AM process optimization.As such,ANNs are likely to play an important role in the continued development of AM as a manufacturing technology.
ANN has been widely used in PPO of AM.Sood et al.[78] studied the effect of process parameters on the compressive stress of FDM-built parts.The study develops a statistically validated predictive equation and uses quantum-behaved PSO to find optimal parameter settings.Compressive stress is predicted using ANN and compared with the predictive equation.Li et al.[79]enhanced the beads overlapping model(BOM)for WAAM by taking the spreading of weld beads into consideration.An ANN was used to predict the offset distance between the center of a weld bead and the center of the fed wire,and a reasoning algorithm was implemented to calculate the optimal distance between the centers of adjacent deposition paths.The enhanced BOM was validated by experiments and found to improve the surface flatness of layers and prevent defects.Ravichander et al.[80] developed a prediction model for obtaining the optimal process parameters in SLM of Inconel 718.The process parameters have a significant impact on the properties of the manufactured samples.ANN modeling with various algorithms is employed to estimate the process outputs,such as sample height and surface hardness.The modeling results match perfectly with the experimental output,demonstrating the effectiveness of ANN modeling in predicting the optimal process parameters.
4 Optimization
Optimization algorithms play a critical role in PPO for AM.After the relationships between process parameters and output qualities are determined,the optimization algorithms need to be applied to figure out the optimal solutions to obtain the desired qualities.The quality and efficiency of an AM process can be improved by optimizing the process parameters that control the manufacturing process.
There are several types of optimization algorithms that can be used for PPO in AM,including heuristic,metaheuristic,and evolutionary algorithms.Heuristic algorithms are simple problem-solving strategies that use rules of thumb or common sense to find solutions.Metaheuristic algorithms are optimization techniques that are designed to solve complex problems by using a combination of different search strategies.Evolutionary algorithms are a subset of metaheuristic algorithms that mimic the process of natural selection and survival of the fittest to find the optimal solution.
In the PPO of AM,the ultimate goal is to optimize the process parameters to produce parts that meet specific quality requirements while minimizing production time,material consumption,and costs.As such,the optimization problem in AM is often multi-objective.Multi-objective optimization refers to the process of optimizing multiple conflicting objectives simultaneously,with no single solution being able to optimize all objectives at once.In order to solve this multivariate problem,the key objectives need to be identified.The reduction of construction time[81–84],energy consumption [85–88],porosity [89–91],and the improvement of mechanical properties [92–97],accuracy [44,98,99],and surface conditions [100,101] are frequently mentioned objectives.
The multi-objective optimization problem(MOP)is a class of optimization problems that involve optimizing multiple,often conflicting,objectives simultaneously.In the context of PPO for AM,MOP arises when multiple quality measures need to be optimized simultaneously.For example,in metal AM,the quality measures include porosity,surface roughness,tensile strength,and fatigue strength.Each quality measure is typically optimized individually in a single-objective optimization problem (SOP).However,in practice,these quality measures are often interdependent,and optimizing one measure may lead to a degradation in another measure.Thus,optimizing these measures simultaneously requires MOP.
wherefi(x) is the objective function that needs to be optimized subject to the constraints,andgi(x)≤0 andhi(x)=0 are constraints that are required to be satisfied (these are called hard constraints).
Multi-objective optimization methods can be broadly categorized into three groups: pre-decision methods,post-decision methods,and interactive decision-making methods.
Pre-decision methods are also known as a priori methods or oラine methods.These methods involve solving the multi-objective optimization problem before the decision-maker is faced with making a choice.The solutions obtained from the predecision methods are presented to the decision-maker,who then chooses the best solution based on their preferences.Some examples of pre-decision methods include non-dominated sorting genetic algorithm-II (NSGA-II),strength Pareto evolutionary algorithm (SPEA),and Pareto archive evolution strategy (PAES).
Post-decision methods are also known as a posteriori methods or online methods.These methods involve solving the multi-objective optimization problem in real-time as the decision-maker makes choices.The solutions obtained from the post-decision methods are presented to the decision-maker,who then chooses the best solution based on their preferences.Some examples of post-decision methods include multiobjective linear programming(MOLP),weighted sum method(WSM),and epsilonconstraint method.
Interactive decision-making methods involve the decision-maker actively participating in the optimization process.These methods involve presenting the decisionmaker with a set of solutions and asking them to choose the best solution based on their preferences.The optimization process is then updated based on the decisionmaker’s choices.Some examples of interactive decision-making methods include interactive multi-objective programming (IMOP),interactive decision maps(IDM),and interactive fuzzy programming (IFP).
Each of these categories of multi-objective optimization methods has its advantages and disadvantages.Pre-decision methods can be more computationally efficient as they solve the optimization problem only once.However,they may not provide the decision-maker with enough flexibility to make the best choice.Postdecision methods provide more flexibility to the decision-maker,but they can be more computationally expensive as the optimization problem is solved in real-time.Interactive decision-making methods provide the most flexibility to the decisionmaker but can be time-consuming as the decision-maker must actively participate in the optimization process.
Due to the complexity of the optimization problem,a variety of optimization algorithms have been developed and applied in AM.The selection of the most appropriate optimization algorithm depends on the complexity of the optimization problem,the number of objectives and constraints,and the available computational resources.Some of the most commonly used optimization algorithms for PPO in AM include RSM,GA,PSO,and SA.Some of the research about the optimization algorithms for PPO in AM are listed in Table 4.

Table 4: AM process optimization techniques.
4.1 Non-dominated sorting genetic algorithm
NSGA is a genetic algorithm-based optimization algorithm that was introduced by Kalyanmoy Deb in 2002 [120].It is designed to solve multi-objective optimization problems where multiple objectives need to be optimized simultaneously.The NSGA algorithm follows the principle of evolutionary computation,where it maintains a population of candidate solutions and improves them iteratively using genetic operators such as crossover,mutation,and selection.
The NSGA algorithm begins with the initialization of a population of random solutions.Each solution in the population is represented as a vector of decision variables.The algorithm evaluates the fitness of each solution based on its objective function values.The objective function is a mathematical function that represents the quality of the solution with respect to the objectives to be optimized.In the case of AM process optimization,the objective functions could be the geometric accuracy,surface finish,mechanical strength,or any other quality metrics that are deemed important.
After evaluating the fitness of each solution,the NSGA algorithm sorts them into different levels based on their domination relationships.A solution dominates another solution if it is better than the other solution in at least one objective and not worse in any other objectives.The NSGA algorithm then assigns each solution a rank based on its level,where level 1 solutions are non-dominated and level 2 solutions are dominated by level 1 solutions but non-dominated by level 3 solutions,and so on.
The NSGA algorithm then selects the best solutions from each level using a crowding distance metric.Crowding distance measures the distance between each solution in the population and its nearest neighbors.The solutions that have a larger crowding distance are preferred because they represent a more diverse set of solutions.The selected solutions are then subjected to genetic operators such as crossover and mutation,which generate new solutions.The process of evaluating fitness,sorting,and selecting solutions is repeated iteratively until a stopping criterion is met.
The application of NSGA in process optimization of AM has several benefits.First,it allows the simultaneous optimization of multiple objectives,which is essential in AM as there are often conflicting objectives,such as achieving high-quality parts while minimizing production time and cost.NSGA can find a set of nondominated solutions that represent the trade-offs between different objectives,providing a range of options for decision-makers to choose from.Second,NSGA can handle complex and nonlinear problems with many variables,which is typical in AM processes.The optimization of AM processes involves a wide range of factors,such as the type and properties of the material,the layer thickness,the printing speed,and the printing orientation.NSGA can explore the complex search space efficiently and find the best combination of parameters that satisfy the objectives.Third,NSGA is a flexible algorithm that can be adapted to different AM processes and requirements.The optimization problem can be formulated to suit the specific needs of a particular application,and the algorithm can be adjusted to balance between exploration and exploitation to achieve the desired solution.
The application of NSGA in the process optimization of AM has been demonstrated in several studies.For example,Peng et al.[102] developed a predictive model for specific energy consumption and metallic powder usage rate in laser cladding using three different methods.The comparison revealed that the method that demonstrated the highest fitting performance was the integrated Tabu search and GEP.The predictive models were then used to determine the Pareto front using NSGA-II,which provided the optimal set of processing parameters.Resultsshowed that NSGA-II was effective in maximizing energy and metallic powder efficiency.This study emphasizes the importance and effectiveness of NSGA-II in the process optimization of AM.Asadollahi-Yazdi et al.[103] proposed a method to simultaneously analyze critical attributes and drawbacks of AM and optimize the manufacturing parameters for AM products.The study focuses on FDM and formulates a multi-objective optimization problem with layer thickness and part orientation as decision variables.NSGA-II is utilized to find optimal solutions.The approach is demonstrated through a case study and emphasizes the effectiveness of NSGA-II in AM process optimization.Meng et al.[104] focused on optimizing multilayer bio-inspired sandwich structures of Ti-6Al-4V alloy fabricated by SLM.The results showed that NSGA-II can effectively optimize the bio-inspired sandwich structures with a relative error rate of less than 10%.The study further demonstrated the comprehensive mechanical performances of the bio-inspired sandwich structures and identified the optimal configuration as the two-layered structure under cross-arranged configurations,emphasizing the effectiveness of NSGA-II in optimizing AM structures.
However,there are some limitations to the application of NSGA in process optimization of AM.First,the performance of NSGA depends on the choice of objective functions and the formulation of the optimization problem.The objectives should be well-defined and relevant to the problem,and the problem formulation should be appropriate to the specific AM process.Second,NSGA requires a large number of evaluations of the objective functions,which can be computationally expensive,especially for complex AM processes.The evaluation of the objective functions often involves running simulations or experiments,which can be time-consuming and expensive.
4.2 Multi-objective particle swarm optimization
MOPSO is a variant of the PSO algorithm,which is a nature-inspired optimization method based on the behavior of birds flocking.In MOPSO,a swarm of particles represents a set of candidate solutions,and each particle has a position and a velocity in the search space.The position of each particle represents a potential solution to the optimization problem,and its velocity is adjusted based on the best position found by itself and the swarm.The swarm moves towards better solutions by updating the position and velocity of each particle iteratively.In MOPSO,multiple objective functions are optimized simultaneously,and the best solutions are found by generating a set of non-dominated solutions,called the Pareto front.

Figure 7: Steps of multi-objective particle swarm optimization process.
The main steps of MOPSO in the PPO of AM are shown in Fig.7 and stated as follows: The first step in using MOPSO for PPO is to define the problem and the objective functions to be optimized.In AM,the objective functions could include parameters such as mechanical strength,surface roughness,and dimensional accuracy.These parameters are often interrelated and conflicting,making them difficult to optimize using traditional single-objective optimization methods.Therefore,the MOPSO algorithm is well-suited for this problem as it can handle multiple objective functions simultaneously.The next step is to initialize the population of particles in the swarm.The swarm is composed of a set of particles,each representing a possible solution to the optimization problem.These particles are randomly initialized with positions and velocities in the search space.The number of particles in the swarm is a parameter that can be tuned based on the complexity of the problem and the available computational resources.After the initialization of the population,the objective functions are evaluated for each particle in the swarm.The objective functions are calculated for each particle in the swarm based on the process parameters defined in step 1.This evaluation generates a set of fitness values for each particle,representing how well the particle solves the optimization problem.In this step,each particle updates its personal best position based on its fitness values.The personal best position is the best position the particle has achieved so far in the search space.The personal best position is updated if the fitness value of the current position is better than the previous personal best position.In MOPSO,there is a global best position that represents the best solution found by the entire swarm.The global best position is updated when a particle finds a better solution than the current global best position.The global best position is a crucial aspect of the algorithm,as it provides guidance to the particles in the swarm towards promising regions of the search space.After updating the personal and global best positions,the velocity and position of each particle in the swarm are updated.The new velocity is calculated based on the current velocity,the personal best position,and the global best position.The new position is then calculated based on the new velocity.This update process enables the particles to move towards promising regions of the search space,while also ensuring that they do not converge too quickly to a single solution.The final step is to determine the termination criteria for the algorithm.This criterion could be based on the number of iterations,the number of function evaluations,or a convergence threshold.Once the termination criteria are met,the algorithm terminates,and the best solutions are reported as the Pareto-optimal set.
The advantages of MOPSO in process optimization of AM are numerous.First,MOPSO is a global optimization method that can find the optimal solutions in the entire search space,unlike local optimization methods that may get stuck in a local minimum.Second,MOPSO is a population-based method that can explore multiple solutions simultaneously,providing a diverse set of Pareto-optimal solutions that can satisfy different objectives.Third,MOPSO is easy to implement and requires minimal parameter tuning,making it suitable for solving complex optimization problems.Fourth,MOPSO can handle both continuous and discrete variables,making it flexible for different AM processes.
However,there are also some limitations to the application of MOPSO in process optimization of AM.First,the performance of MOPSO depends on the selection of the optimization parameters,such as the population size,the maximum number of iterations,and the coefficients of the objective functions.Poor parameter settings can result in suboptimal solutions or premature convergence.Second,MOPSO requires a large number of function evaluations,which can be computationally expensive for complex AM processes with high-dimensional search spaces.Third,the convergence of MOPSO can be slow or erratic for some problems,requiring a longer computational time to achieve satisfactory results.Fourth,the quality of the Pareto front generated by MOPSO may be affected by the distribution and diversity of the initial solutions,which can influence the exploration and exploitation of the search space.
The application of MOPSO in process optimization of AM has been widely investigated in recent years.MOPSO has been applied to various AM processes,such as SLM,FDM,and SLA.For instance,Selvam et al.[110]used MOPSO to optimize FFF printing parameters for improving surface quality and reducing printing time of ABS polymer.The study employed RSM and PSO techniques to predict the optimum process parameter values.A CCD was preferred and mathematical models were developed to understand the relationship between input parameters and output responses.The weighted aggregated sum product assessment (WASPAS) ranking method was employed to compare the RSM and PSO,with PSO showing finer optimal values.The predicted parameter values through the PSO method showed high surface quality with a minimum printing time of 24 min.Qin et al.[115]focused on the energy consumption modeling,prediction,and optimization of AM.To address the issue of high energy consumption and sustainability,design-relevant features are examined and exploited for prediction modeling using a design-relevant data analytics approach.A deep learning-driven particle swarm optimization (DLD-PSO)method is proposed to optimize energy utility.The approach is validated through a case study using real-world data,and the results show the benefits of the proposed modeling approach.The use of DLD-PSO allows for faster search speeds and enhances the global best of PSO.The optimization approach can guide part designers and process operators in revising their designs and decisions to reduce energy consumption in the AM system.
4.3 Multi-objective genetic algorithm
MOGA is a widely used optimization technique in PPO for AM.MOGA is an extension of the traditional Genetic Algorithm (GA) that can handle multiple objectives simultaneously.It was first introduced in the 1990s by Tadahiko Murata [121].MOGA has been proven to be effective in solving complex optimization problems with multiple objectives,which are common in AM.
MOGA works by evolving a population of solutions through a process of selection,crossover,and mutation.The fitness of each individual in the population is evaluated based on their performance in the objective functions.In MOGA,multiple objectives are optimized simultaneously,and the goal is to find a set of solutions that are not dominated by any other solution.The set of non-dominated solutions is known as the Pareto front.
The main steps involved in MOGA for PPO of AM are initialization,evaluation,selection,recombination,mutation,and replacement.
The first step in MOGA is the initialization of the population,which involves creating a set of random solutions within the solution space.The size of the population is an important parameter that can affect the performance of the algorithm.A larger population size can lead to better diversity and exploration of the solution space,but it can also increase the computational cost.Therefore,an appropriate population size should be chosen based on the problem complexity and available computational resources.
In the second step,the fitness of each solution in the population is evaluated based on the objective functions.In PPO for AM,the objective functions are typically related to the quality and performance of the fabricated part,such as surface roughness,mechanical properties,and dimensional accuracy.The fitness value of each solution determines its selection probability for the next generation.
The third step in MOGA is the selection of solutions for recombination and mutation.MOGA uses a tournament selection method,where several solutions are randomly selected from the population and compete for selection based on their fitness values.The selected solutions are then combined using recombination operators,such as crossover and mutation,to create new solutions that inherit the desirable traits from their parents.
Crossover is a recombination operator that exchanges genetic information between two solutions to create a new solution.In MOGA,a two-point crossover is commonly used,where two random points are selected in each parent solution and the genetic information between these points is exchanged.This creates two new offspring solutions that inherit different traits from their parents.
Mutation is another recombination operator that introduces random perturbations to the genetic information of a solution.In MOGA,mutation is applied to each offspring solution with a low probability to prevent premature convergence and maintain diversity in the population.The type and magnitude of the mutation operator depend on the problem domain and can be customized to improve the performance of the algorithm.
The final step in MOGA is the replacement of the old population with the new offspring population.The replacement strategy determines which solutions from the old population should be replaced by the new offspring solutions.The most common replacement strategy in MOGA is the elitist strategy,where the best solutions from both populations are selected to form the next generation.This ensures that the best solutions are preserved throughout the optimization process and prevents the algorithm from converging to a suboptimal solution.
One of the main advantages of MOGA is its ability to optimize multiple objectives concurrently.Traditional optimization approaches,such as the single-objective genetic algorithm,can only optimize one objective at a time,leading to suboptimal solutions.MOGA can overcome this limitation by considering multiple objectives simultaneously and finding the optimal set of solutions that satisfy all objectives.For example,in AM process optimization,MOGA can optimize the printing speed,layer thickness,and nozzle temperature to minimize the production time and reduce the surface roughness of the final product.Moreover,MOGA can optimize different objectives such as the mechanical properties of the part,the energy consumption during the printing process,and the material utilization rate.
Another benefit of MOGA is its ability to handle complex,non-linear optimization problems.AM process optimization involves a large number of parameters,which makes the optimization problem highly non-linear and complex.MOGA can effectively handle such problems by searching for optimal solutions in a vast solution space.MOGA uses a population-based approach,which means that it generates a set of candidate solutions and evolves them iteratively to find the optimal solution.The fitness function is used to evaluate the quality of each solution,and the algorithm applies genetic operators such as selection,crossover,and mutation to generate new solutions that are better than the current ones.
Despite its advantages,MOGA also has some limitations.One of the main limitations is the computational cost associated with the optimization process.MOGA requires a large number of simulations to evaluate the quality of each candidate solution,which can be time-consuming and computationally expensive.Moreover,MOGA requires careful selection of the fitness function and genetic operators,which can affect the quality and convergence of the solutions.Therefore,the optimization process requires expertise in the field and extensive computational resources.
Another limitation of MOGA is its sensitivity to the initial population and the selection of the optimal solution.MOGA generates a population of candidate solutions randomly,which can lead to the algorithm converging to local optima.Therefore,the initial population must be carefully selected to avoid premature convergence and ensure that the algorithm explores the entire solution space.Moreover,MOGA can generate multiple optimal solutions that have different trade-offs between the objectives.The selection of the optimal solution depends on the user’s preferences and the specific application requirements.
MOGA has been successfully used in various areas of engineering,including the optimization of AM processes.Yan et al.[108]applied a multi-objective optimization algorithm based on the modeling of the direct metal deposition(DMD)of dissimilar materials to optimize the fabrication process in metal-based AM technologies.The optimization is achieved through a preprocess computing combined with a MOGA that considers minimizing the laser energy consumption and powder waste during the fabrication process.The results show the design and objective spaces of the Pareto optimal solutions,and a feasible design is selected which corresponds to a relatively low material cost.Arisoy et al.[111] investigated the microstructure formation in LPBF AM process of nickel alloy 625,focusing on the effects of process parameters.The study employs optimization techniques,including response surface regression,desirability functions,and multi-objective genetic algorithm optimization,to control the process effects on the resultant microstructure while improving productivity.Kumar &Maji [113] discussed the optimization of WAAM through the use of GA to minimize void and excess material.The focus is on developing a single-bead geometry model using RSM and Box-Behenken DoE for deposition of 304L stainless steel.The study found that the optimal processing conditions and deposition planning determined by MOGA led to the minimum void and maximum material yield.Additionally,it was discovered that optimal bead sizes and degree of overlapping are different for different geometries.The study also highlights the benefits of double wire feed deposition,which can deliver a higher deposition rate and superior mechanical properties of the deposited material compared to single wire feed deposition.
4.4 Accelerated process optimization
APO is a methodology that aims to optimize AM process parameters in a reduced amount of time by leveraging prior knowledge and experience.The MOAPO is a generalized version of the APO,which enables the optimization of AM systems with multiple objectives.
The traditional optimization approach involves testing numerous combinations of process parameters to find the best set that results in the desired output.However,this method is time-consuming and expensive.APO,on the other hand,aims to reduce the number of experimental runs needed to reach the optimal process parameters while ensuring that the final product meets the desired quality standards.
The APO method works by characterizing and leveraging similarities among prior studies.It involves using the results of previous experiments to guide the design of subsequent experiments.For instance,if a particular combination of process parameters has been found to produce a high-quality product,this information is used to narrow down the search space for the next set of experiments.This approach can significantly reduce the time and resources required for process optimization.
The MOAPO extends the APO approach to systems with multiple objectives.In AM,it is not uncommon for the desired product to have multiple properties,such as strength,flexibility,and durability.The MOAPO method takes into account all these properties and optimizes the process parameters to ensure that the final product meets all the desired quality standards.

Figure 8: Steps of accelerated process optimization.
The first step in the MOAPO algorithm is to decompose the master problem into sub-problems.The master problem is the overall optimization problem that needs to be solved,which could include multiple objectives and constraints.The sub-problems are smaller,simplified versions of the master problem that are easier to solve.In the case of AM PPO,the sub-problems could be defined as optimization problems for individual process parameters,such as laser power or scan speed.Once the master problem has been decomposed into sub-problems,the next step is to apply the APO method to each sub-problem.The APO method is a technique that leverages information from previous experiments to reduce the number of experimental runs required to find the optimal solution.In the context of AM PPO,the APO method could involve using data from previous experiments to identify the optimal values for a specific process parameter.In order to determine when a subproblem has been optimized,a Hyper-Volume (HV) metric is defined.The HV is a measure of the multi-dimensional space covered by a set of solutions,and it is used to evaluate the quality of the solutions found by the APO method.The stopping criteria for each sub-problem is based on the HV metric.When the HV reaches a certain threshold,the optimization of that sub-problem is considered complete.The final step in the MOAPO algorithm is to construct the sub-problems by determining appropriate weight coefficients.Weight coefficients are used to assign relative importance to each sub-problem,based on the overall importance of each process parameter to the final product.The weight coefficients can be determined through expert knowledge or through a sensitivity analysis of the process parameters.Once the weight coefficients have been determined,the sub-problems can be constructed and optimized using the APO method.
The MOAPO methodology has several advantages in PPO of AM.Firstly,it is able to efficiently approximate the Pareto front with a well-distributed set of Pareto optimal solutions using a limited number of experiments.This is achieved by identifying and leveraging similarities amongst different sub-problems and smartly selecting only a few sub-problems to solve among an infinite number of them.Secondly,MOAPO is able to significantly reduce the number of experimental runs while achieving a targeted optimum value,compared to conventional scalarization-based optimization approaches which individually solve the single-objective sub-problems.Thirdly,the APO framework embedded in MOAPO accelerates the optimization process by treating the experimental data from previous sub-problems as prior data for optimizing the current sub-problem at each stage,instead of independently and separately designing experiments for optimizing each sub-problem from scratch.These advantages make MOAPO a powerful tool for achieving optimal process parameter settings in AM.
APO has been utilized in several researches on PPO in AM.Aboutaleb et al.[107]applied MOAPO to optimize the quality of LBAM-fabricated parts with respect to multiple non-correlated mechanical properties.The MOAPO method decomposes the master multi-objective optimization problem into a sequence of single-objective sub-problems and smartly maps the experimental data from previous sub-problems to the remaining sub-problems,resulting in the best trade-offbetween conflicting mechanical properties in the optimal window.The MOAPO methodology achieved the optimal process parameter setups while reducing time-and cost-intensive experiments by 51.8%.Aboutaleb et al.[122] proposed a novel process optimization method to optimize process parameters for desired part properties in LBAM.The proposed MOAPO method directly utilizes experimental data from previous studies to guide the sequential optimization experiments,reducing the total number of time-and cost-intensive experiments needed.Simulation studies and a real-world case study demonstrate that the MOAPO significantly reduces the number of optimization experiments required compared with conventional optimization methods.In the case study,a combination of optimal process parameters for maximizing relative density of parts manufactured using an SLM system is achieved within five experiments.
In conclusion,the development and application of ML in PPO for AM has emerged as a promising area of research.Data collection methods such as DoE and simulations provide a wealth of information that can be used to develop models.Mechanistic,classical and surrogate modeling methods are widely used in the field,with surrogate models like Kriging,GPR,SVR,RF and ANN being particularly effective.Optimization techniques such as NSGA,MOPSO,MOGA,and APO are used to optimize the process parameters.The use of these techniques has shown that significant reductions in the number of experiments can be achieved,while still ensuring the production of high-quality parts.However,there is still room for further development and refinement of these techniques,particularly in the area of surrogate modeling,to improve their accuracy and efficiency.Overall,the future of ML in PPO for AM looks very promising,and its continued development and application will play a critical role in advancing the capabilities of this exciting technology.
5 Conclusions
In conclusion,machine learning(ML)has emerged as a powerful tool for optimizing additive manufacturing(AM)processes,revolutionizing the way we design and produce 3D-printed objects.By leveraging ML algorithms and techniques,researchers have made significant strides in enhancing the quality,efficiency,and productivity of AM.Through ML-based process optimization,the intricate and complex nature of AM can be better understood and controlled.ML algorithms analyze vast amounts of data to identify patterns,correlations,and optimal parameter settings,enabling the optimization of AM processes for improved part quality,reduced production costs,and shortened lead times.
ML techniques,such as supervised,unsupervised,and reinforcement learning,have been applied to various aspects of AM,including process parameter optimization,defect detection and classification,material selection,and design optimization.These advancements have led to significant improvements in part accuracy,surface finish,mechanical properties,and overall production efficiency.Moreover,ML has played a crucial role in enabling the design and manufacturing of complex geometries that were previously challenging or impossible to achieve.By simulating and optimizing the AM process using ML algorithms,researchers have pushed the boundaries of design freedom,enabling the creation of lightweight,optimized structures and customized products tailored to specific requirements.
However,challenges remain in the integration and adoption of ML in AM.Data acquisition,preprocessing,and validation are critical for building reliable ML models and ensuring accurate optimization outcomes.The interpretability and explainability of ML algorithms also pose challenges,as the optimization decisions made by ML models may not always be easily understandable or traceable.
As the field of AM continues to advance,further research and development in ML for AM optimization are crucial.Standardization efforts,data-sharing initiatives,and collaboration between academia and industry can contribute to the establishment of best practices and guidelines for ML-based AM optimization.In conclusion,ML has demonstrated immense potential in revolutionizing additive manufacturing.By leveraging ML algorithms,researchers and industry professionals can unlock new possibilities,achieve higher efficiency and quality in AM processes,and pave the way for innovative applications in a wide range of industries.As the field progresses,continued exploration and advancements in ML techniques will undoubtedly shape the future of additive manufacturing,enabling the realization of its full potential.MLbased additive manufacturing (AM) process design was already showing promise in various industries.However,it’s essential to note that the field of AI and AM is rapidly evolving.AI can help optimize material selection by analyzing the properties of available materials and the requirements of the final product.Future trends may include AI systems that can predict how different materials will behave during the AM process,enabling the creation of new,customized materials tailored to specific applications.AI algorithms can continually refine the AM process by adjusting parameters in real time to improve quality and reduce defects.More sophisticated AI systems would be proposed that can adapt to changing conditions and automatically optimize the printing process.AI-driven generative design software can create optimized 3D designs that are more conducive to AM.These designs often feature complex geometries that traditional design methods may overlook.In the future,generative design tools may become more accessible and integrated into the AM workflow.
Acknowledgements
This work is supported by the Provincial Natural Science Foundation of Anhui(No.2208085QA01),the Fundamental Research Funds for the Central Universities (No.WK0010000075),the National Natural Science Foundation of China(Nos.61972368 and 12371383).
杂志排行

Annals of Applied Mathematics的其它文章
- Specht Triangle Approximation of Large Bending Isometries
- Fast High Order and Energy Dissipative Schemes with Variable Time Steps for Time-Fractional Molecular Beam Epitaxial Growth Model
- Connections between Operator-Splitting Methods and Deep Neural Networks with Applications in Image Segmentation
- A Discontinuity and Cusp Capturing PINN for Stokes Interface Problems with Discontinuous Viscosity and Singular Forces
- Preface
- The Acoustic Scattering of a Layered Elastic Shell Medium