High-Accuracy NLOS Identification Based on Random Forest and High-Precision Positioning on 60 GHz Millimeter Wave
2023-12-10QiunaNiuWeiShiYongdaoXuWeijunWen
Qiuna Niu ,Wei Shi,* ,Yongdao Xu ,Weijun Wen
1 Qingdao University of Science and Technology,Qingdao 266000,Shandong Province,China
2 Hisense Visual Technology Co.,Ltd.,Qingdao 266000,Shandong Province,China
Abstract: 60 GHz millimeter wave (mmWave) system provides extremely high time resolution and multipath components (MPC) separation and has great potential to achieve high precision in the indoor positioning.However,the ranging data is often contaminated by non-line-of-sight (NLOS) transmission.First,six features of 60GHz mmWave signal under LOS and NLOS conditions are evaluated.Next,a classifier constructed by random forest (RF) algorithm is used to identify line-of-sight (LOS) or NLOS channel.The identification mechanism has excellent generalization performance and the classification accuracy is over 97%.Finally,based on the identification results,a residual weighted least squares positioning method is proposed.All ranging information including that under NLOS channels is fully utilized,positioning failure caused by insufficient LOS links can be avoided.Compared with the conventional least squares approach,the positioning error of the proposed algorithm is reduced by 49%.
Keywords: 60 GHz millimeter wave;indoor positioning;NLOS identification;random forest
I.INTRODUCTION
Currently,many applications in the consumer market rely on accurate indoor location services,such as in robot navigation,medical assistance,crime tracking,and other emergency services.With advancements in wireless technology,the applications of mmWave have been met with acclaim by many industries.Especially the availability of tremendous unlicensed bandwidth around 60 GHz in many countries,which enables high data rate applications,60 GHz mmWave has caused great interest in indoor wireless transmission.
A positioning scheme mainly involves distance estimations and location calculations.Distance estimation is usually mentioned as ranging,and it is based on different traditional parameters such as the received signal strength(RSS),angle of arrival(AOA),time of arrival(TOA)or time of flight(TOF),and time difference of arrival(TDOA)of signal changes between the target node and the reference nodes.Ranging-based approaches such as TOA and TDOA are most suited for localization and ranging for mmWave wireless networks because of the large bandwidth of the mmWave signals.
60 GHz pulse system uses very short pulses with duration less than 1 picosecond(ps),the temporal resolution and MPC separation of this technique is extremely high.Thus,it can provide far more accuracy than those widely used indoor positioning techniques,such as WiFi,Bluetooth and RFID etc.According to Cramer-Rao Lower Bound [1],sub-centimeter ranging accuracy can be achieved in the pulse system of 60 GHz mmWave band.
However,the ranging data is often detrimentally contaminated by NLOS transmission in indoor mmWave system,and the positioning accuracy and robustness of these approaches will be adversely affected.The location calculations or localization problem using mmWave has been studied in many literature,but the presented algorithms are mainly based on the assumption that the propagation scenario is LOS[2–4]or the channel condition being LOS or non-lineof-sight(NLOS)is already known[5–10].This means the specific transmission situation should be figured out in advance to counter the positioning bias introduced by NLOS.
To deal with this problem,there are some effective solutions,commonly classified as NLOS identifyand-mitigation(IAM)and NLOS identify-and-discard(IAD) [8].In IAM schemes,NLOS situation is distinguished from LOS and usually followed by different weighted localization techniques to minimize the range estimation residual.Such as [11] estimates the NLOS error and uses it to correct the estimated distances.[9]provides a review about NLOS mitigation methods.The first type is maximum likelihood approaches.However,the statistical model of NLOS information is difficult to obtain,because the wireless propagation environment is often complicated.Another type is LS techniques,including weighted least squares (WLS) and residual weighted algorithm,for location estimation,which suppresses the NLOS bias effects through some appropriate weighting.
[12] develops a residual weighting algorithm(RWGH) to mitigate the NLOS errors.The algorithm is simple but computationally intensive,and the complexity of the algorithm increases with the number of reference nodes.A simplified RWGH is proposed in[13]when a large number of reference nodes are available.But if indoor environment with only NLOS connectivity is considered,the algorithm cannot perform well.[14]proposes link residual weighting scheme(LRW)based on link reliabilities.In LRW,the relative weights of the links are double calculated by using weighted averaging,which is also computationally expensive.
In IAD schemes,range estimation bias is minimized by discarding all the NLOS measurements.If there isn’t sufficient number of identified LOS links,the positioning fails.The work in[15]shows that sufficient conditions for position estimation at mmWave frequencies require at least one LOS path or three NLOS paths.Therefore,there is a significant but challenging aspect for mmWave localization will be LOS/NLOS path identification and path separation.
Two mainly used identification approaches are Binary Hypothesis Test and various classifier algorithms in machine learning(ML).Both approaches use statistics on a number of ranging measurements or channel impulse responses(CIR),analyze statistically and obtain relevant feature values.Generally speaking,the classification accuracy in Hypothesis Test is not quite high in addition to requiring a pre-defined distinguish threshold,which is hard to choose an effective value.Classifiers in ML identify NLOS scenarios according to statistical features of the received mmWave signals.
For example,[16] makes use of Hypothesis Test based on some characteristics of logged CIRs,and[17]utilizes several statistical features of received signal strength indicator(RSSI),but the identification accuracy under NLOS are just near 90%.
Some literature including [18–22] distinguish the NLOS condition based on machine learning.[18]uses support vector machine (SVM) with 8 different features to identify Ultra Wide Band (UWB) NLOS channel and obtains NLOS identification correct rate of 93.9%.[19] completes SVM-based NLOS identification algorithm with feature selection strategy through 6 features,the misclassification rate of NLOS is 0.0728,i.e.the accuracy is 92.72%.In[20],SVMbased and RF-based classifiers are compared in UWB indoor environments.By regarding 12 features,SVM reaches the highest identification accuracy with 81%in the best case,and RF reaches 93%.[21] develops a NLOS detection method based on the decision tree,which correctly identifies 90%of LOS and NLOS situations.Such identification accuracy is not enough for high-precision positioning technologies.
Especially [17] and [23] conclude that Gaussian process regression (GPR) outperforms the SVM according to the experimental results.The evaluations in [24] shows random forest (RF) has better performance than SVM in groundwater communication.RF is a flexible and powerful ensemble classification and regression method,and it combines numerous uncorrelated decision trees that perform as an aggregation.
As the motivation,in the paper,we develop an effective identification approach by taking RF’s advantage.To offer excellent time resolution under 60GHz mmWave complex indoor environment,a residual weighted least squares positioning algorithm based on time of arrival (TOA) ranging is proposed.In the algorithm,the combinations with the minimum number of reference nodes to meet the requirement of 3D positioning are selected.It can be used in positioning services with unknown prior knowledge about NLOS error distribution.
The rest of the paper is organized as follows.Section II introduces the positioning system model.Section III presents the features of LOS or NLOS channels in 60 GHz mmWave communication.Section IV deploys RF classifier to identify NLOS scenario based on the mentioned-above features.Section V proposes a residual weighted least squares (RWLS) approach based on the positioning residual.Section VI provides the simulation results and evaluates the performance.Finally,Section VII concludes the paper.
II.SYSTEM MODEL
60 GHz pulse signals have a very short duration(typically 100 picoseconds or less),and can be expressed as:
Each symbol is represented by a sequence of very short pulses,whereTsis symbol time.The time hopping code represented byCis a pseudorandom integer-valued sequence which is unique for each user to limit multiple access interference,andTcis chip time.The pulse position modulation time shift isεso that ifajis 1,signal is shifted in time byε,whileajis 0,there is no shift.Many pulse shapes have been proposed for 60 GHz systems.In the paper a Gaussian pulse is employed which is multiplied by carrier signal:
In indoor environment,the 60 GHz signals can be reflected,scattered,and diffracted due to the multipath transmit effect.The received signals can be given by
where * denotes convolution,n(t) denotes the white noise,andh(t,φ)denotes the channel responses.
IEEE 802.15.3c channel models[25]are considered here.In 802.15.3c standard,the TSV (Triple S-V:Shoji-Sawada-Saleh-Valenzuela) model is employed for the channel models.This model combines a LOS component using a two-path model with the NLOS reflection clusters of the SV (Saleh-Valenzuela) model[26].The channel impulse response is given by
where the first term in Eq.(4)is the LOS component,and the generation of NLOS channel is performed by removing the LOS component presence in the statistical LOS channel model [21].δ(·) is the Dirac delta function,Lis number of clusters,andKlis the number of rays in thelth cluster.The scalarsαk,l,Tk,landωk,ldenote the complex amplitude,TOA,and azimuth of thekth ray in thelth cluster respectively.The average TOA and the average angle of arrival(AOA)of thelth cluster are given byTland Θlrespectively.
An incoherent auto-correlation receiver is employed here.The operation is based on the use of a reference pulse that is the delayed transmitted signals(t-τd),and then the data modulated pulses is correlated with the reference pulse used as the signal template,as follows
whereTpis the pulse duration time.
Then the reference nodes estimate the TOA-based transmission delay,i.e.the time of arrival of the received pulse by
Thereby,the measured range between the target node and the reference node is estimated as
wherecis the speed of light and the estimated result is mixed with noise.
III.FEATURES OF RF CLASSIFIER
In RF Model,each individual tree is a standard classification and regression tree (CART).CART is constructed from a bootstrap sample drawn with replacement from the original data set and it produces a class prediction by using decrease of gini impurity as a splitting criterion.The predictions of all CARTs are finally aggregated as the final classification result through majority voting.For the best split at each node and grow CARTs,RF does a random selection of a subset of features from the total candidate features set,which is denoted asM.To obtain a tradeoff between the power and the correlation between CARTs,the number of features subset is set as int[log2M],as recommended in[27].
The received 60 GHz signal has different statistical features under LOS or NLOS transmission environment.Such as mean excess delay (MED),root mean square delay (RMSD),kurtosis and skewness are all features widely used to classify LOS/NLOS in other wireless communication systems including UWB[16,17,19,28]and WiFi[29,30].
In the section,besides MED,RMSD,kurtosis and skewness are set as candidate features,another two new energy measurements are proposed to classify LOS or NLOS situation,they are time delay of main power denoted asτpand ratio of energy maximum to minimum(EMTM).
In order to sample the received pulses close to the realistic scenario,Monte Carlo simulations are performed 10,000 times through CM1 and CM2 channels separately.The above-mentioned six characteristics of the pulses are analyzed and compared,which are finally selected as the features of RF and provides feasibility for the subsequent high-accuracy classification of channel situations.Possibility distribution of MED (M),RMSD (R),kurtosis (k) and skewness(s)in two scenarios are compared according to the received pulses of the independent 20,000 simulations.The cumulative distribution function(CDF)curves are shown in Figure 1.As these figures illustrated,the cumulative probability of the four measurements all characterize the attribution of LOS or NLOS channels quite obviously.Thus,these parameters are able to qualify the features to distinguish the visibility of 60 GHz mmWave transmission.
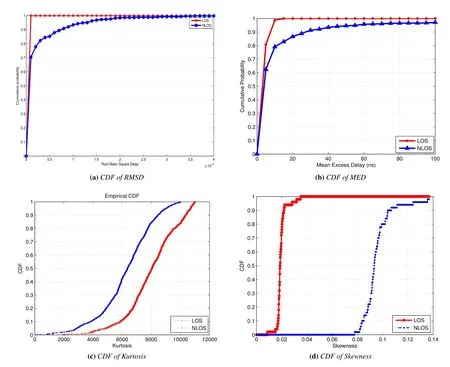
Figure 1.CDF of 4 features of 60 GHz mmWave pulses through LOS/NLOS links.
Next,another two new energy measurements are proposed to classify LOS or NLOS.
3.1 Time Delay of Main Power τp
Based on the previous study on MED and RMSD of the power delay profile (PDP),we observe that the concentration or dispersion of signal energy in the power delay spectrum can distinguish LOS or NLOS well.We hereby use the major power distribution time delayτpas one of the measurements to identify NLOS.τpis defined as the time difference from the starting time of the measurement to the instant of the power delay profile containing a certain percentage of the received total powerPtotalis calculated by
We ever selected the percentage of total power as 75% and 90% separately,then analyzed the received power distribution through LOS or NLOS channels.After comparison,whenpis 75%,the contrast ofτpbetween two situations is more obvious.Therefore,the time delay when the received power is 75%of the total is selected as the value to achieve the identification.A typical comparison of differentτpis shown in Figure 2.The distribution ofτpwhenp=75% under two channel models is shown in Figure 3.
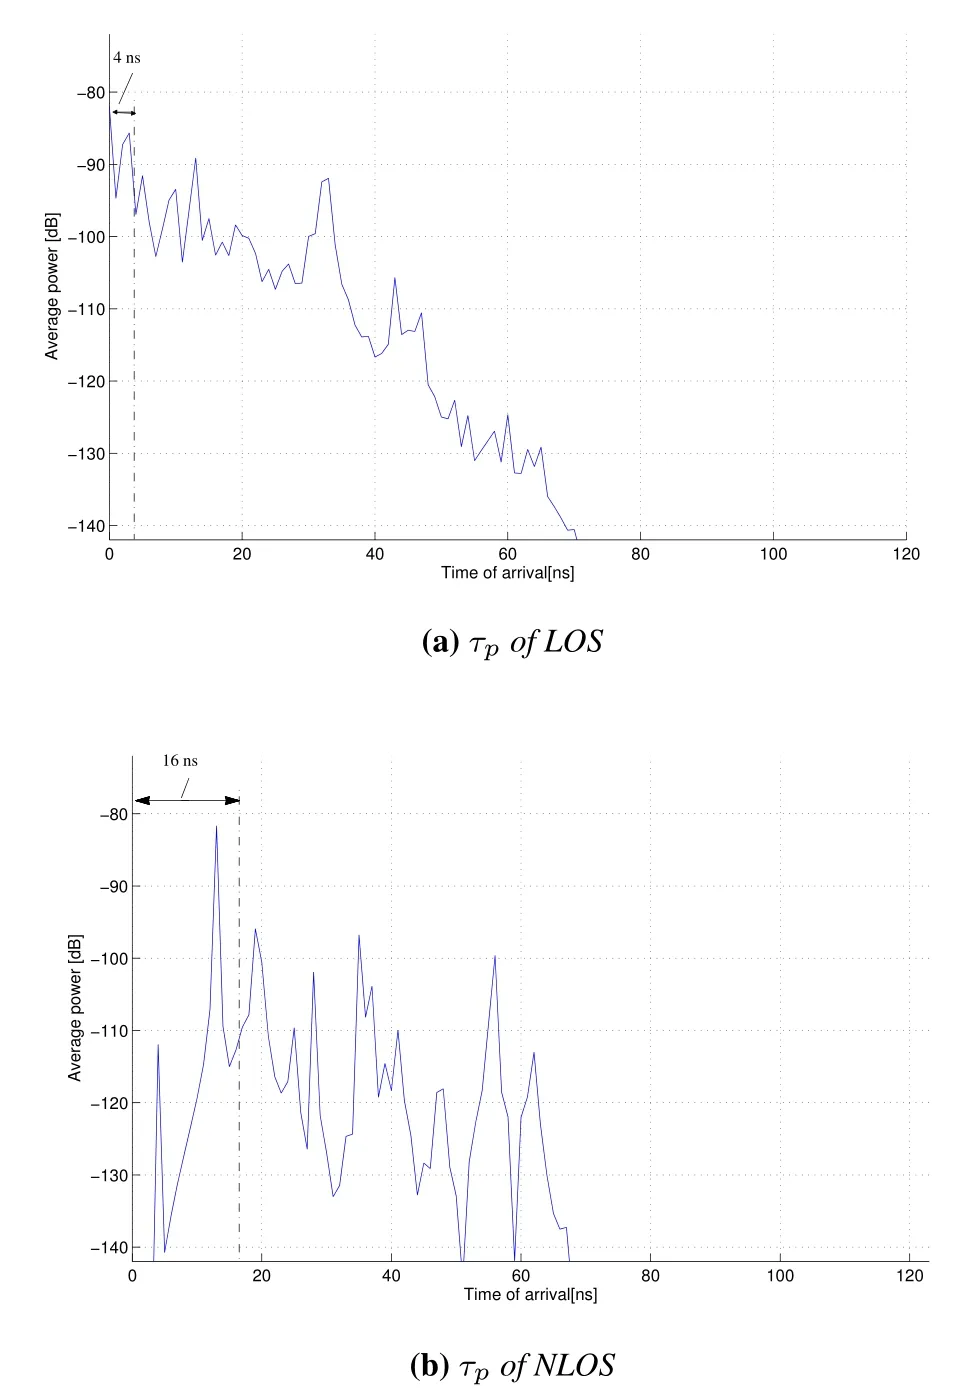
Figure 2.PDP of 60 GHz pulses and when p=75%.
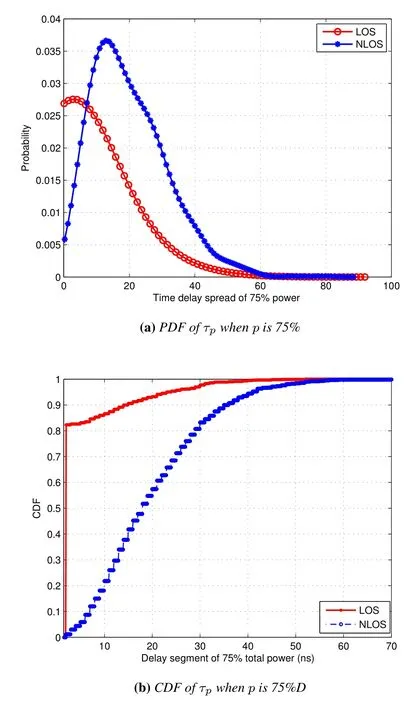
Figure 3.PDF and CDF of τp.
In LOS situation,the pulse reaches the receiver via the direct path almost without any delay.Hence,the first-arrival pulse has the strongest energy.Since the propagation attenuation is small,the energy is highly concentrated on the first-arrival signal.Therefore,the time delay length of 75% of the total power is quite short,only 4 nanosecond (ns).But NLOS transmission causes seriously degraded,the energy of each branch decreases evenly.It takes longer time to reach 75%of the total power,hereτpis 16 ns.
From the simulation results,the averageτpof 75%total power in LOS scenario is 4.911 ns,while the averageτpin NLOS is 20 ns.Figure 3 shows the probability dense function (PDF) and the CDF curves of different situations respectively.When the mmWave pulse is transmitted by LOS link,it reaches the receiver through direct path.The first path is the one with the strongest energy,the propagation attenuation is very weak,and the energy is highly concentrated on the signal through the first direct path.In this case the delay of 75%total power is relatively short.Conversely,NLOS transmission causes serious attenuation and the energy of the signal via any branch generally declined.It takes more time to reach 75% of the total power.We observe that in LOS transmission,τpis mainly distributed between 2~4 ns,while NLOSτpis concentrated near 2 ns.Therefore,τpdescribes the influence of different scenarios on the signal PDP distribution,and it is reasonable to be a candidate feature to identify NLOS.
3.2 Energy Maximum to Minimum(EMTM)
Observe through the PDP analysis,the amplitude and its energy of the NLOS signal is usually significantly lower than LOS signal at the same transmission distance.This is because affected by the multipath environment with additive white Gaussian noise(AWGN),there is part energy coming from the noise in the received contaminated signal,in addition to the transmitted energy.The minimum energy is only caused by noise.Unlike that,the maximum is mixed with both noise and energy sent from transmitter.Therefore,the ratio of the energy maximum to the minimum manifests signal-to-noise information of the received signal.Hereby we define a new characteristic feature,ratio of Energy Maximum to Minimum(EMTM)as
The CDFs of EMTM in LOS and NLOS scenario are compared based on the simulations,as shown in Figure 4.With the same SNR set as 15dB,in NLOS situation,small difference between energy maximum and minimum due to the multipath effect.And the EMTM value is mainly distributed between 150 and 170.Since signal energy by LOS link converges on the directive path pulse,the energy of other branches is obviously smaller,the EMTM is generally larger than that by NLOS link.And the value concentrates between 200 and 300 with high probability.As we discuss,the EMTM is associated with different channel characteristics,and can be used as a candidate feature to identify the visibility of transmission situation.
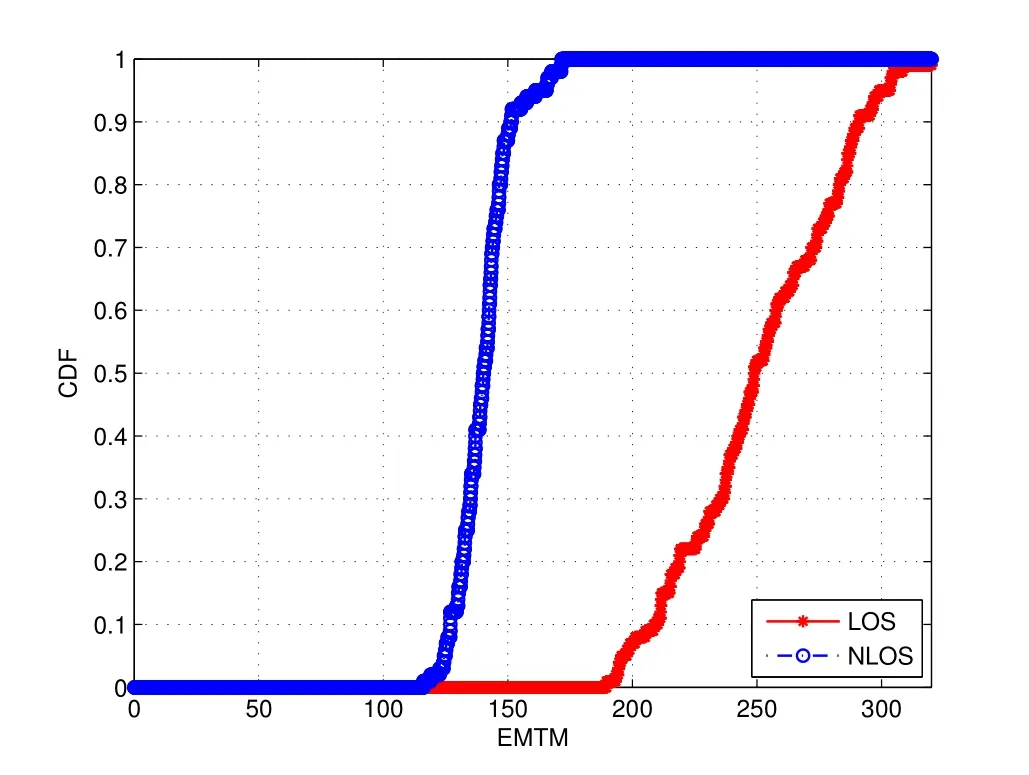
Figure 4.CDFs of EMTM in LOS and NLOS scenario.
IV.SIMULATION RESULTS OF RF CLASSIFIER
4.1 Simulation and Evaluation Features
The selected 6 feature variables mentioned above are listed in Table 1.
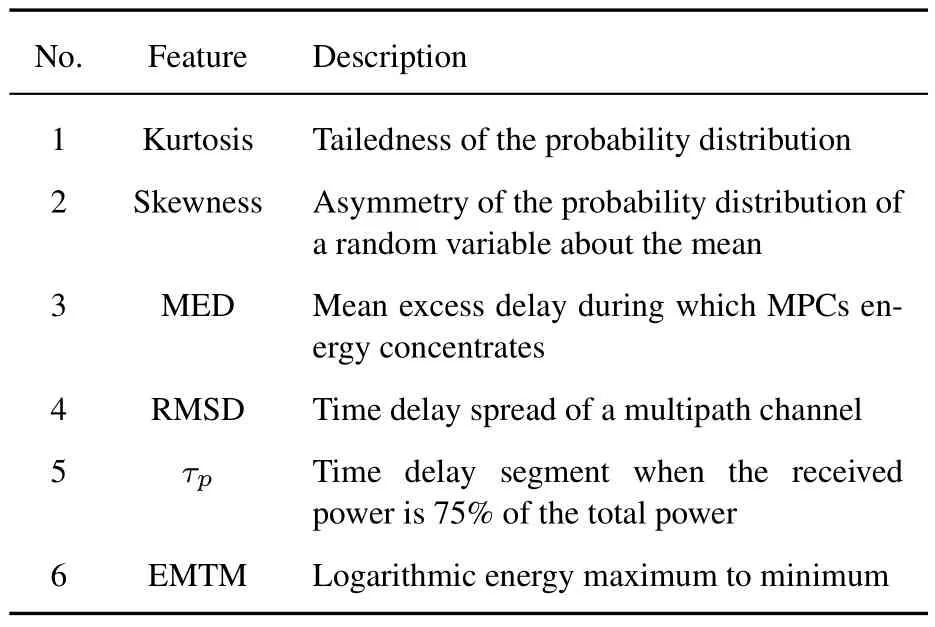
Table 1.Candidate features of 60 GHz NLOS identification for RF.
In order to assess the correlation between these features from CM1 and CM2 of the IEEE 802.15.3c channel models,the correlation coefficients between the pairs of them are calculated and tabulated in Table 2.

Table 2.Correlation coefficients of different features.
Correlation coefficient between two variablesxandyis given by
where cov(x,y)is the covariance ofxandy,are the standard deviations ofxandyrespectively.
From the results summarized in Table 2,all the correlation coefficients are smaller than 0.5 for the two channel models.Most of the coefficients are lower than 0.3,hence there is very weak correlation between most features.Relatively larger values ofρM,Rimply that there is some correlation between the pair of features,but the correlation strength is still moderate.Correspondingly,a detector that considers these features independently and randomly may obtain the required NLOS detection performance.
The proposed algorithm realizes the two-class prediction problem of whether the transmission link is LOS or NLOS.Therefore,the final predicted result of the RF model is 0 for LOS or 1 for NLOS.
The model is evaluated using metrics such as accu-racy(ACC),true positive rates(TPR)and true negative rate (TNR).ACC refers to the proportion of overall correctly classified evaluation data.TPR is defined as the rate of true positive classified instances to the sum of true positive and false negative instances.TNR is the rate of true negative instances to the sum of true negative and false positive instances.Hence TPR is the percentage of NLOS channels correctly classified by the RF model,while TNR is the percentage of correctly discovered LOS channels.
4.2 Construction of Data Set
In 60 GHz mmWave communication,pulses are transmitted through the IEEE 802.15.3c channel models respectively,i.e.CM1 (the residential LOS environments)and CM2(the residential NLOS environments)[25].According to the IEEE 802.15 TG3c standards[25],the TG3c channel models are for indoor residential,indoor office and library environments etc.,they cover a range of 1-10 m.Hereby the distance between the transmitter and the receiver is set as 10m,and the SNR is 20dB.1000 simulations under two scenarios are performed respectively,there are 1000×2 samples in the data set.The data corresponding to the selected 6 features are analyzed and stored,there are overall 1000 × 6 × 2 feature values.The data set is represented as 2000 rows and 7 columns.Each row is a whole record consisting of values of the 6 features for each link;the first 6 columns record the feature values of 6 different features for each link,the last column is represented as 0 for LOS links or 1 for NLOS links.After disarranging the row order of all the records,1600 rows of them are randomly selected as the training data set of the RF model and the other 400 rows are the testing set.
4.3 Evaluation of Different Number of Features and CARTs
The out of bag (OOB) error is the average error for each training observation calculated using predictions from the decision trees that are not contained in their respective bootstrap samples.Lower OOB error allows RF Classifier to be fit and validated while being trained [27].Using the OOB error estimate removes the need for another set aside the test set [31].OOB error differs with the number of the total features and the built trees in RF.
Firstly,to find the best split number at each tree node,the OOB errors between different number of features are compared.The number of trees is all 400.Their corresponding OOB errors are depicted in Figure 5.
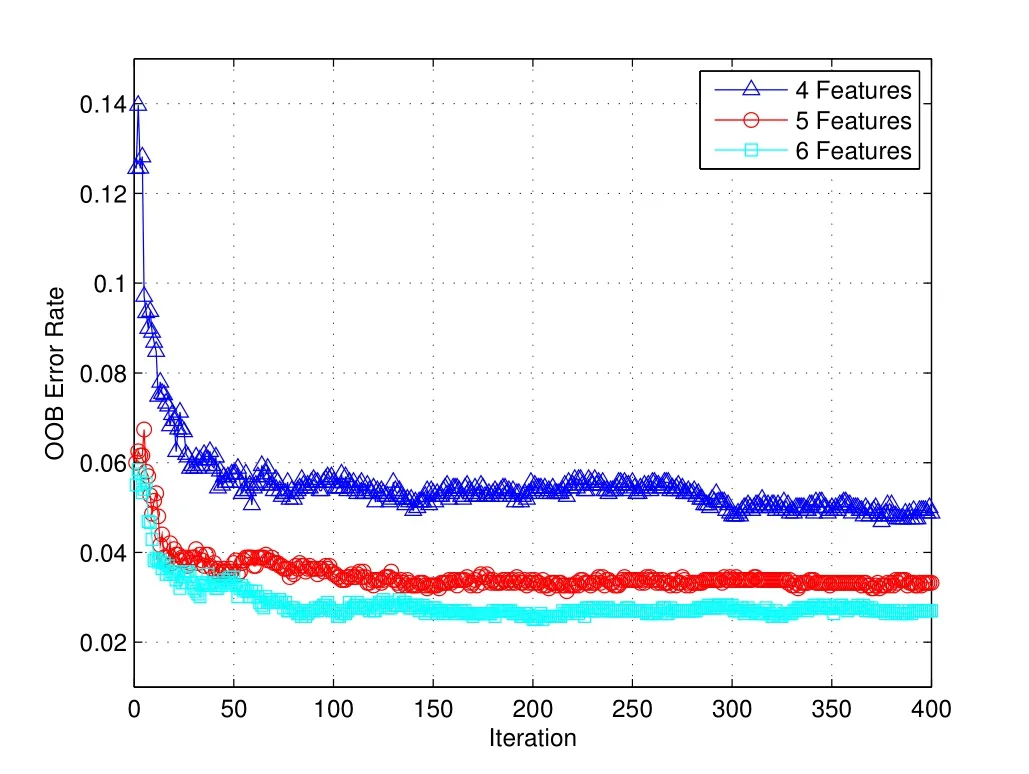
Figure 5.OOB error of 4,5 and 6 features.
As illustrated in Figure 5,when RF does random selection from 4 or 5 features,the OOB errors are close to 0.05 and 0.035 respectively.Obviously,the OOB error for the case of 6 total features is close to 0.025,which is lower than the other two cases.Based on this,in the next evaluations and simulations,the presented 6 features are input to the RF classifier,3 features are randomly selected from those to grow trees.
Next,we evaluate the OOB error rates under different number of CARTs.Too large number of trees will lengthen the learning time and increase the complexity of RF model,further lower the classification efficiency.Conversely,too small number will reduce the scalability,and even lead to underfitting,and more features cannot be fully applied in node splitting,which will eventually decrease the prediction accuracy and classification performance of RF.
From the comparison of the number of CARTs as 200,300,400,500 and 600 in Figure 6,when the quantity increases above 400,OOB error rates are 0.025,0.024,0.024 respectively for the number of trees are 400,500 and 600.In other words,the RF classifier using the same dataset gets similar OOB error rate.This means we can set a relatively smaller number of detection trees to attain the similar performance.Thus,the number of CARTs is set as 400 in the next evaluation.The OOB rate of the RF classifier displayed in the Figure 6 illustrates the given RF model is gradually tend to 0.024.
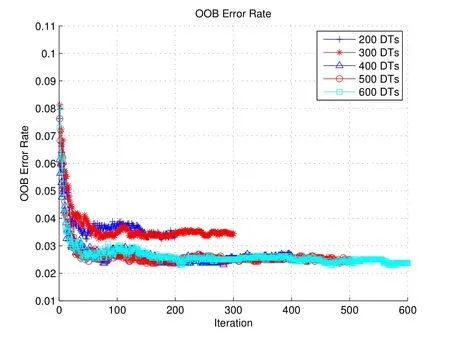
Figure 6.Comparison of OOB error of different trees number.
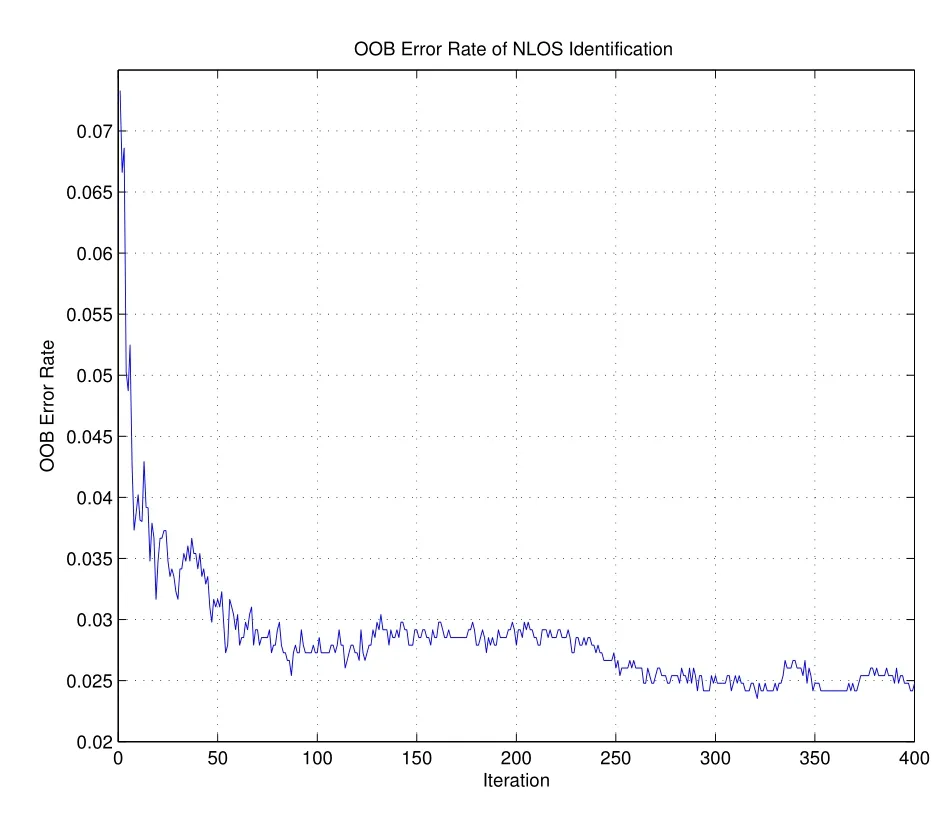
Figure 7.OOB error of trees number being 400.
4.4 Evaluation of Classification Performance
SVM,GPR and decision tree (DT) are three techniques most commonly used in machine learning based identification approaches.To compare the identification performance,RF,SVM,DT and GPR are evaluated by being applied to the same data set.Figure 8 demonstrates the PDF curves of ACC,TPR and TNR of the four schemes.Table 3 summarizes the means of the three evaluated features.
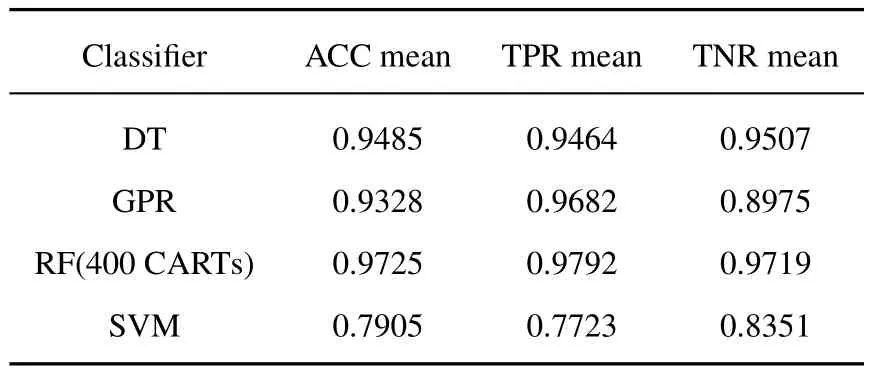
Table 3.Means of three evaluated features.

Figure 8.PDF of three evaluated features of RF,SVM,DT and GPR.
As shown in Figure 8,the PDF peaks of ACC,TPR and TNR measured over RF are all around 0.97.Especially from the Table 3,the probability of ACC,i.e.the overall prediction accuracy for both LOS and NLOS is 0.9725,while the ACC of DT is 0.9485,that of GPR is 0.9328,and the ACC of SVM is 0.7905.Since RF combines a number of single CART classifiers to achieve the prediction and produce the final classification,the metrics values of the evaluated features of RF are generally higher than that of DT and GPR,and RF also outperforms SVM.As far as the four techniques are concerned,RF has the best and the most stable performance.To further present the performance of RF,the CDFs of ACC,TPR and TNR of the RF model using the 60 GHz mmWave data set are displayed in Figure 9.It can be observed that the cumulative probability distribution curve of RF identification converges to 1 after 0.98 to 0.99.In short,the RF classification model enables the high prediction accuracy of transmission statue be extremely possible.It can well meet the identification requirements in the complex indoor environments mixing with LOS and NLOS links.
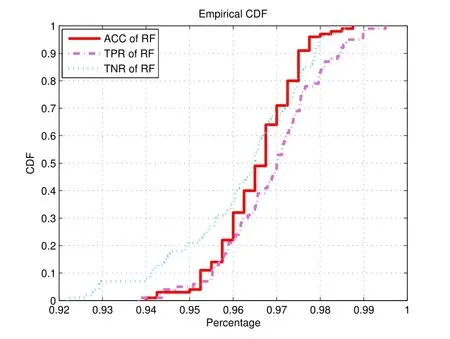
Figure 9.CDF of ACC,TPR and TNR of RF.
V.NLOS-IDENTIFICATION-BASED RWLS POSITIONING
Since the position of the target node cannot be expressed as a linear function of the estimated distance,the non-linear parameter calculation becomes one of the major challenges in positioning applications.For ranging-based positioning,multilateration,an extension of the triangulation method,are most commonly used to derive a position based on TOA.Using a standard least squares (LS) approach can solve the multilateration problem.In the presence of NLOS,least median of squares (LMedS) [32,33] is another solution.It makes subsets of the available data,and selects the one that minimizes the global median of the residuals.The main benefit of LMedS is that it reduces the outliers when calculating the coordinates of the target node,but when the participation of outliers will make the estimation result worse[34],since LMedS discards all other estimations with non-minimum residuals.
The MPCs of the received 60 GHz pulses carries important information to localization.Even the signal transmitted through NLOS link is useful.Compared with the IAD technique,the IAM method utilizes all the estimations instead of discarding the NLOS measurements.
The previous section builds a RF classifier regarding 60 GHz LOS/NLOS features to identify LOS and NLOS cases.In this section,we exploit the identification results to develop a residual weighted least squares (RWLS) localization method.The location estimates with smaller residuals have larger chances of corresponding to the correct target node’s location.Hence,the proposed method weights different location estimates with the inverses of their residual errors.
To solve the three-dimensional location problem,the RWLS estimation ofcan be represented as:
where weightsδkcan be utilized to feature the residual between each measured range and the real distance between the target node and thek-threference node.If no reliability information is available,δk=1 for allk,that is non-linear model of LS to estimate the target’s location.In the latter part,the proposed approach weights all distance estimations with the inverses of the residual errors.
In[35],the minimizing of Eq.(11)can be achieved by choosing the following linear model which is written in a matrix form as:
Therefore,the least squares solutions of the target node’s location can be estimated as[32]:
To obtain the weights matrix△,a residual weighted least squares location algorithm based on Random Forest identification is presented here:
Step 1:SelectM(M≥4)reference nodes,whose locations are known.In positioning of one target node,four reference nodes are the minimum number to meet the requirements of the three-dimensional Least Squares positioning algorithm;
Step 2:Conduct 1000 communications by LOS and NLOS channel separately in 60GHz mmWave system,collect the received signal to generate training set of RF;
Step 3:Randomly select 3 attributes from MED,RMSD,τP,Kurtosis,Skewness and EMTM.Set number of CART is 400 and construct RF model;
Step 4:Generate testing sets according to the received pulses transmitted from the target node to theMreference nodes;
Step 5:Classify the channel situation by the built RF model.Denote the set of reference nodes who communicate with the target node by LOS channel asSLand the total number of nodes inSLisl;otherwise the reference nodes belong to the setSN,and the number of nodes inSNisn.Obviously,l+n=M;
Step 6:IfM=4,there is no other choice but to estimate the location by LS method directly;
Step 7:Ifl≥4,the quantity of LOS links meets the needs of the LS algorithm,letδk=1,k=1,2,...l,estimate the target node’s location by assigning all the weights to 1 and going to Step(12);
Step 8:Ifl<4,need more ranging data from NLOS transmission.With the increasement of the number of reference nodes,it makes a positive contribution to the improvement of positioning accuracy to some extent.In order to find the reference nodes with the smallest positioning residual under NLOS channel conditions,4 reference nodes are selected from SN each time to compose a ranging subset.The selection is carried out according to the statistical combination,s selections are made,wheres=
Step 9:For every 4 reference nodes in the s ranging subsets,the LS algorithm is used to obtain the coordinate estimation of the target node;
Step 10:Calculate the average range residual of each subsetRk,k=1,2...sby calculated
The minimum value is denoted as,correspondingly the subset of the 4 reference nodes is denoted asSNmin;
Step 11:Calculate the weightsδkby
Step 12:ConstructGcandHcaccording to all the ranging data;
Step 13:Estimate the coordinates of the target node by Eq.(12) and Eq.(13).The block diagram of the proposed algorithm is shown in Figure 10.
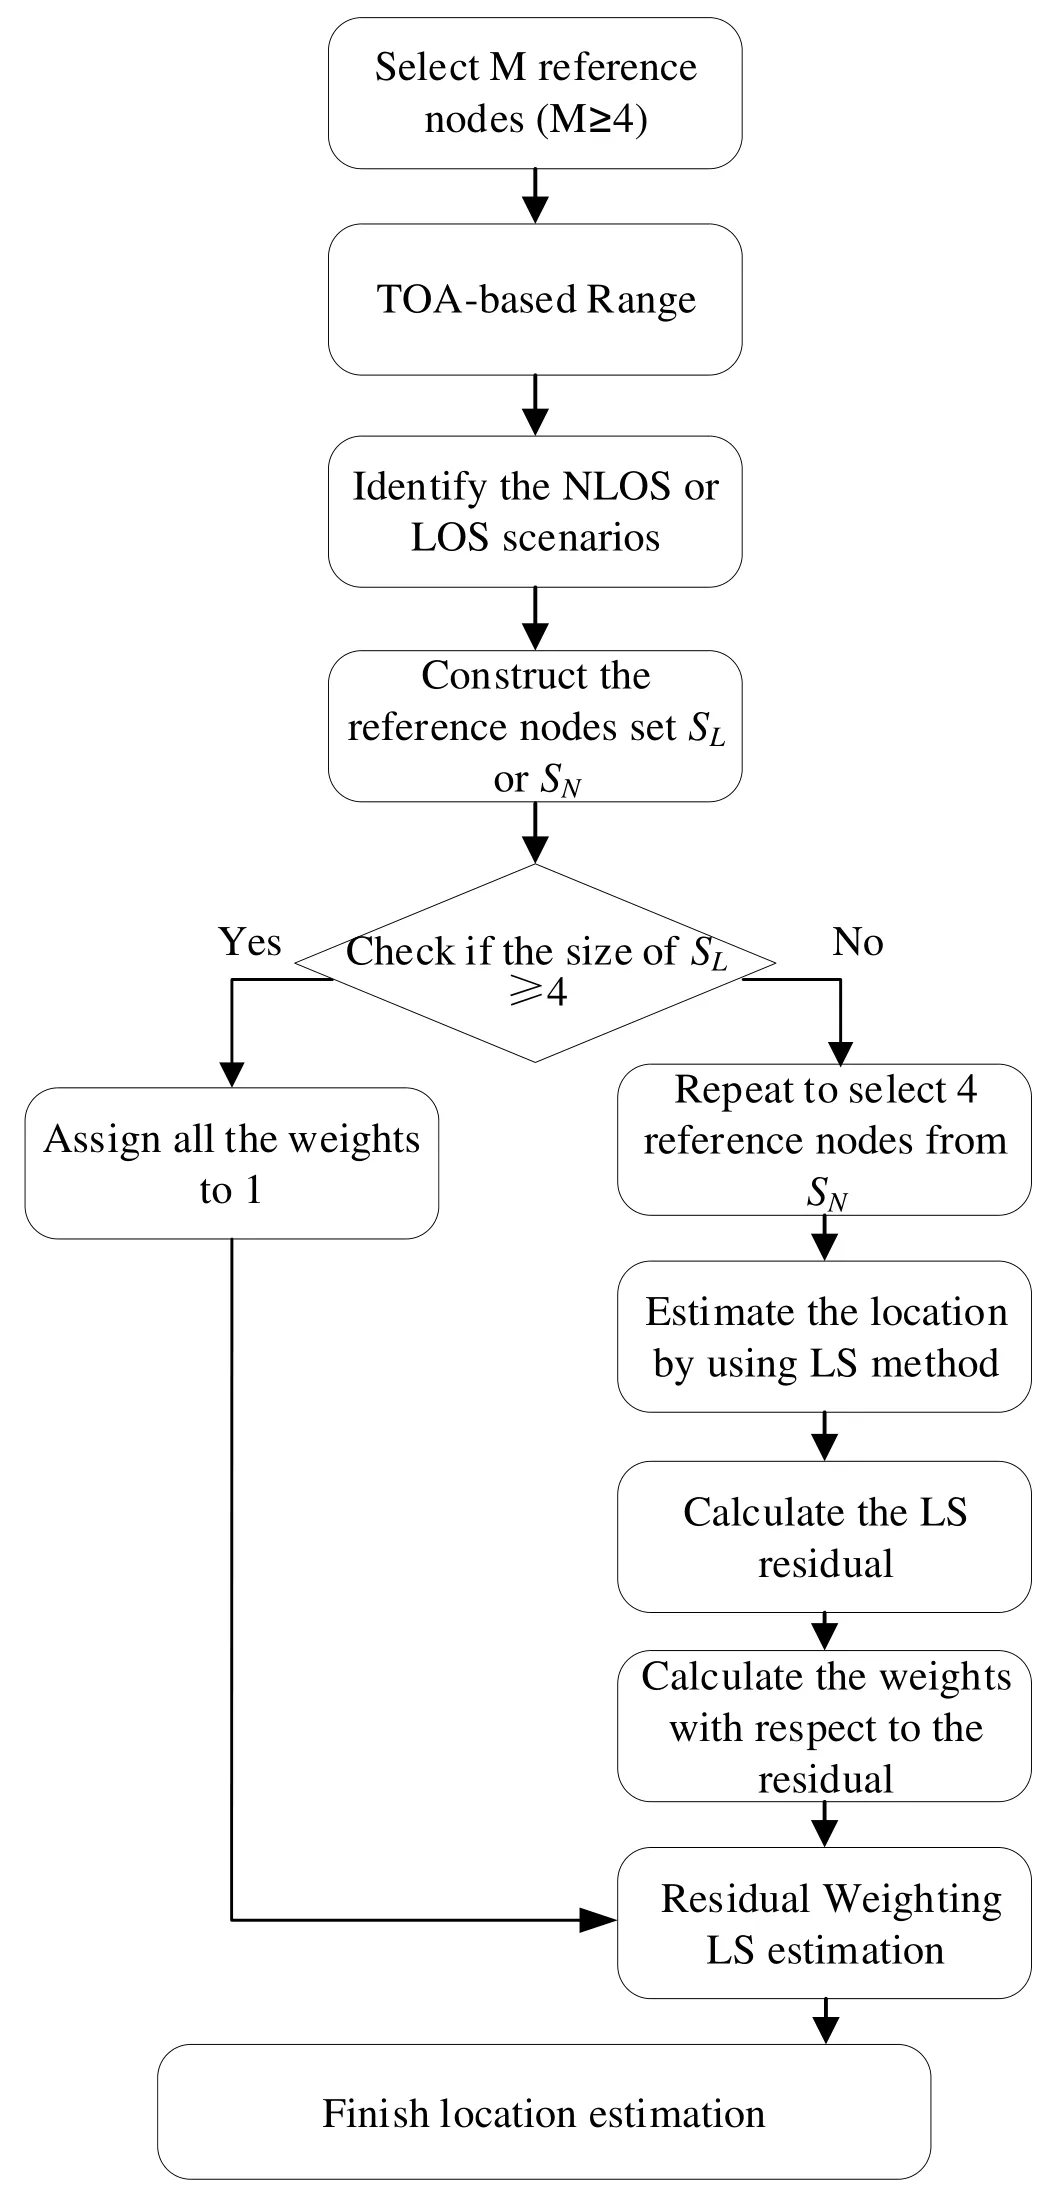
Figure 10.Block diagram of the proposed RWLS positioning.
VI.SIMULATION RESULTS
The paper adopts the IEEE 802.15.3c CM1 and CM2 channel models,the signal-to-noise ratio(SNR)range is from 5dB to 35dB.The transmitting antenna mode is 360° omnidirectional,and the positioning area is 10m×10m×10mthree-dimensional space.The 60 GHz pulse parameters are as follows,transmit power is 20dBm,Ts=0.3ns,Tc=0.1ns,aj∈{0,1},ε=0.5ns.
In the simulation,there are 10 reference nodes and another one is target node to be positioned,as illustrated in Figure 11.All nodes are randomly located.We categorize the scenarios into three different types.

Figure 11.The positioning cube model.
(I)The best transmission scenarios: all the links are LOS.
(II) More severe scenarios: The condition is LOS mixed with NLOS.That means there are still some LOS measurements can be used to complete the position estimation,but no matter how the four reference nodes are selected to complete the 3D Least Squares positioning,there will be no complete LOS scenario.
(III) The worst situation: All the links are NLOS.In this section we compare the two algorithms under Type (II) and Type (III) to find which one performs better to mitigate the NLOS effects.
To obtain fine synchronization between all the target node and the reference nodes,a predefined pilot sequence and a coherent receiver is used in the simulation[36].
First,to verify the performance of the proposed RWLS algorithm under the mixed LOS and NLOS environments,2 or 3 out of 10 reference nodes are randomly selected and assumed to communicate with the target node by LOS channels,and the rest are NLOS channels.SNR gradually increases every 3dB,and 100 Monte Carlo simulations are performed for two scenarios.The Root Mean Squared Error (RMSE)curves are shown in Figure 12.
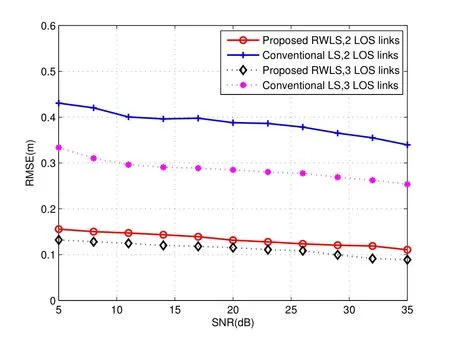
Figure 12.Positioning RMSE of the proposed RWLS and the conventional LS.
We observe that with the increasement of the SNR,the positioning RMSE of the both TOA-based methods decline slowly.That means when the transmission condition deteriorates,even if the SNR increases,it cannot balance the multipath effect,as a result,the positioning performance still cannot be improved a lot.In addition,the conventional LS uses all ranging estimation indiscriminately,when the number of NLOS links grows from 7 to 8,the estimation error increases.Because 2 or 3 distance measurements do not meet the minimum needs for 3D LS positioning,in this scenario,the proposed RWLS algorithm first classifies as LOS or NLOS,and then set the weights of LS positioning estimation according to the positioning residual errors,higher positioning precision is effectively achieved.In addition,the RWLS provides stronger robustness,and better stability for the 60GHz multipath environment.
When all the links between the target node and the reference nodes are NLOS,the total number of whom changes from 4 to 10,the positioning accuracy is presented in Figure 13.Although the increase in the number of LOS links is conducive to improving the positioning accuracy,but the change of the NLOS links number has little effect on the accuracy improvement,which means that the communication conditions are deteriorating.As the positioning RMSE of the conventional LS shown in the figure,the positioning error does not decrease greatly although the number of transmission paths increases.Nevertheless,the received pulses propagated through NLOS links carry important information.Instead of discarding the NLOS measurements,the proposed technique exploits all the estimation data,assign weights of all measurements according to the residual errors.Except for the situation in which there are exactly 4 reference nodes and only one ranging subset to be constructed,it can be observed that the positioning accuracy is obviously higher than the existing LS algorithm.The mean RMSE of the proposed scheme is 0.2547 m,but that of LS is 0.4996m,the estimation error rate is reduced to 51%.
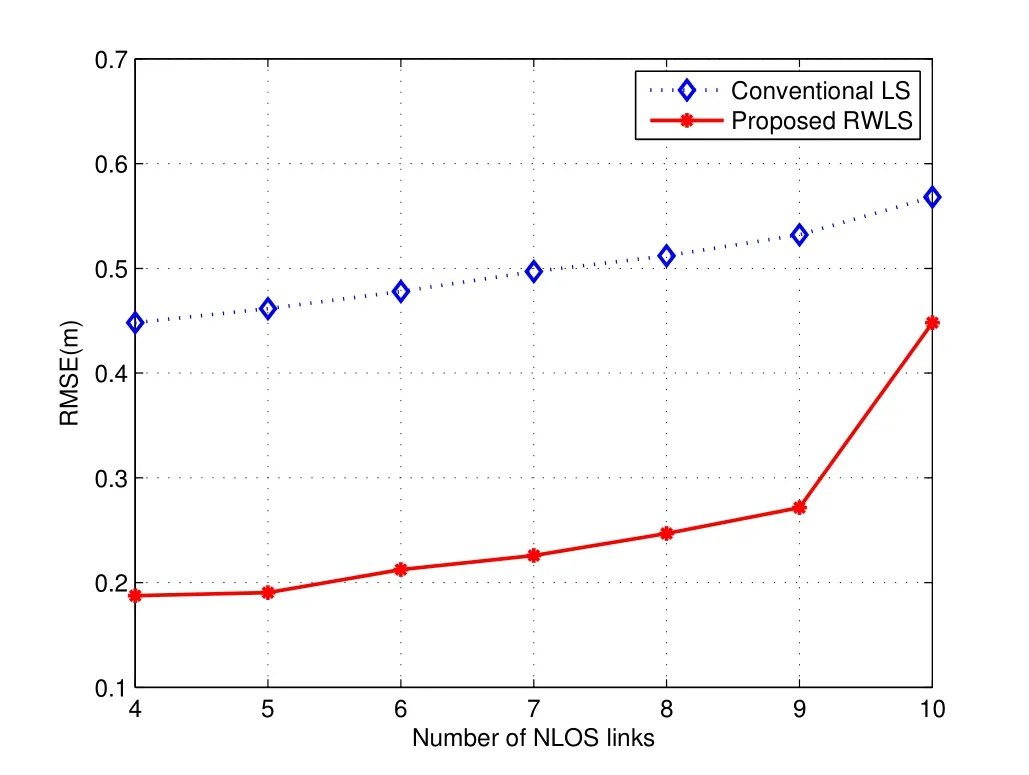
Figure 13.Positioning RMSE as the number of NLOS links increasing.
VII.CONCLUSION
The NLOS identification method based on RF of ML and the error mitigation technique are studied.Six features that describe LOS or NLOS cases are evaluated and compared regarding the statistical characteristics of the 60GHz mmWave signal.On this basis,RF classifier is utilized to develop an effective NLOS identification approach.The RF model correctly identifies above 97%of 60 GHz situations.The simulation results show that the classification accuracy of RF is obviously better than that of DT and GPR.Finally,a RWLS algorithm based on the NLOS identification results is proposed to estimate the target node’s position.All ranging information under LOS or NLOS channels is fully utilized to avoid positioning failure caused by insufficient LOS links.The positioning accuracy even in the complete NLOS environment obtains the subdecimeter level,which effectively mitigates the affection of NLOS on the positioning accuracy.Compared with the conventional least squares approach,the positioning error of the proposed algorithm is reduced by 49%.The proposed algorithm does not require the prior probability of NLOS error in advance,and can be applied to complex indoor positioning environments even without LOS channels.
ACKNOWLEDGEMENT
This work was supported by National Natural Science Foundation of China (No.62101298),and Collaborative Education Project between Industry and Academia,China(22050609312501).
杂志排行
China Communications的其它文章
- Spatial Modeling and Reliability Analyzing of Reconfigurable Intelligent Surfaces-Assisted Fog-RAN with Repulsion
- An Efficient Federated Learning Framework Deployed in Resource-Constrained IoV:User Selection and Learning Time Optimization Schemes
- ELM-Based Impact Analysis of Meteorological Parameters on the Radio Transmission of X-Band over the Qiongzhou Strait of China
- IoV and Blockchain-Enabled Driving Guidance Strategy in Complex Traffic Environment
- Multi-Source Underwater DOA Estimation Using PSO-BP Neural Network Based on High-Order Cumulant Optimization
- Secure Short-Packet Transmission in Uplink Massive MU-MIMO Assisted URLLC Under Imperfect CSI
