Temperature-dependent photoluminescence of lead-free cesium tin halide perovskite microplates
2023-12-02JiayuTan谭佳雨YixuanZhou周译玄DeLu卢德XukunFeng冯旭坤YuqiLiu刘玉琪MengenZhang张蒙恩FangzhengyiLu卢方正一YuanyuanHuang黄媛媛andXinlongXu徐新龙
Jiayu Tan(谭佳雨), Yixuan Zhou(周译玄), De Lu(卢德), Xukun Feng(冯旭坤), Yuqi Liu(刘玉琪),Mengen Zhang(张蒙恩), Fangzhengyi Lu(卢方正一), Yuanyuan Huang(黄媛媛), and Xinlong Xu(徐新龙)
Shaanxi Joint Laboratory of Graphene,State Key Laboratory of Photon-Technology in Western China Energy,International Collaborative Center on Photoelectric Technology and Nano Functional Materials,Institute of Photonics&Photon-Technology,School of Physics,Northwest University,Xi’an 710069,China
Keywords: cesium tin halide perovskite,temperature-dependent photoluminescence,chemical vapor deposition,microplate
1.Introduction
Since perovskite-type solar cells were selected as one of the ten major breakthroughs in Science in 2013,the halide perovskite materials with various components and structures have been developed significantly in the past decade in not only the photovoltaic field,[1–9]but also in optoelectronic applications,such as bright light-emitting diodes(LEDs),[10–12]lowthreshold lasers,[13,14]wireless light communication,[12,15]and high-sensitivity photodetectors.[11,16,17]Being represented by lead halide perovskites, their remarkable application performances are supported by excellent optoelectronic properties,including high optical absorption coefficient,[18]long carrier lifetimes,[19]tunable narrow-band emission,[20]high fluorescence quantum efficiency,[21]and so on.[22,23]Although the performances of lead halide perovskites are outstanding,many efforts have been devoted to exploring environmentally friendly analogues with minimized performance losses.
The development of tin halide perovskites has been proved to be one of the most promising approaches because the replacement of Pb2+by Sn2+with a very close ionic radius can form stable perovskite structures and maintain similar electronic and band structures.[17,23–25]For example,all-inorganic cesium tin halide perovskites CsSnX3(X=Cl,Br, and I) have been reported to have excellent optoelectronic properties, such as high PL quantum efficiency,[26]tunable narrow-band PL emission,[24,27,28]high absorption coefficient,[25,29]low exciton binding energy,[24,30,31]high carrier mobility,[31]amplified spontaneous emission characteristic,[32,33]and narrower bandgaps compared with the lead analogues.[34,35]Therefore, most of the optoelectronic applications achieved by lead halide perovskites have also been demonstrated by CsSnX3, including solar cells,[23,34,36]LEDs,[30]lasers,[32]and photodetectors.[28,37]However, narrowing the performance gap between tin perovskites and their lead analogues is still challenging.In order to further improve the optoelectronic performances of CsSnX3, the most important foundation is the deep understanding of fundamental photophysical properties,which is still largely insufficient.
Temperature-dependent photoluminescence (PL) spectroscopy provides an effective method to investigate the photophysical properties of materials, such as exciton behaviors,thermal expansion,carrier-phonon interactions,and structural phase transition.[38–41]Many essential physical parameters can be derived by fitting the temperature dependence of the PL peak position, linewidth, and integrated intensity.[30,42–48]The temperature-dependent PL properties of various halide perovskites have been studied in recent years,and some interesting findings have been reported.[24,42,43,49–51]For instance,Wrightet al.have proved that the scattering from longitudinal optical phonons governs the electron–phonon coupling in several hybrid lead halide perovskites.[42]The phase transitions of MAPbBr3single crystal are elucidated by Chenet al.[43]The splitting of the PL peaks of CsPbBr3quantum dots is investigated by Leeet al.[48]For CsSnX3nanocrystals,Maheshet al.have reported the temperature-dependent PL features and the LED application.[30]It is worth emphasizing that the preparation method for CsSnX3is also developed in recent years.Chemical vapor deposition (CVD) has been proven to be a good way to synthesize CsSnX3micro-nano structures with excellent crystalline quality.[24,32]Particularly,the thermal PL quenching of CsSnBr3at above room temperatures has been investigated by using a micro-square and a micro-pyramid prepared by CVD.[32]Considering the important micro-laser application prospect, the temperature-dependent PL study of CsSnX3microcrystals becomes an essential but unclear subject.
In this work, high-quality CsSnBr3and CsSnI3microplates are synthesized by using the CVD method.The morphology, crystal structure, and quality of the as-prepared samples are characterized by absorption spectroscopy, xray diffraction (XRD), and scanning electron microscopy(SEM).The temperature-dependent steady-state PL spectra of CsSnBr3and CsSnI3microplates are measured in the range of 10 K–295 K.Obvious splitting of PL peaks of CsSnBr3is observed at the low-temperature region below 70 K,which could be induced by the structural phase transition to a lower symmetry phase.Otherwise, with multi-peak fittings using Gauss functions and the excitation power-dependent PL measurement, the sub-peaks of PL at low temperatures may also be attributed to free exciton emission and bound exciton emission with different energy.The variation of the PL peaks in peak position, linewidth, and integrated intensity are studied by curve fitting based on several theoretical models.From the linear blueshift of the PL peak position of CsSnI3,the thermal expansion is clarified to take the dominating role.In comparison, the PL peak of CsSnBr3exhibits blueshift only at above 160 K,and the thermal expansion weight is much lower than that of CsSnI3.From the continuous broadening of PL linewidth,as the temperature rises,the scattering of electron–phonon coupling is proved to be governed by longitudinal optical phonons.From the temperature-dependent PL intensity,the exciton binding energies of CsSnBr3and CsSnI3are derived to be 32.0 meV and 46.9 meV,respectively.
2.Experimental details
2.1.Synthesis of CsSnX3 (X=Br,I)microplates
CsSnX3(X=Br,I)microplates are prepared by the CVD method on freshly cleaved mica substrates, as indicated in Fig.1.Firstly, 26.6 mg CsBr powder (Aladdin, 99.9%) and 34.8 mg SnBr2powder(Alfa,99.9%)(or 32.5 mg CsI powder and 46.5 mg SnI2powder) are mixed in an alumina boat as the precursor and placed in the center of a quartz tube furnace.The mica substrate is positioned downstream of the quartz tube in another alumina boat which is approximately 12 cm from the precursor.High-purity Ar with a flow rate of 500 sccm is held for 3 min to eliminate air in the tube.Then, the furnace is heated to the growth temperature(310◦C for CsSnBr3and 320◦C for CsSnI3) for 25 min and maintained in an Ar atmosphere (20 sccm) for 30 min.At the growth temperature,CsXand SnX2can be carried downstream by Ar to synthesize CsSnX3on the mica substrate chemically.Lastly,the furnace is naturally cooled to room temperature with the protection of Ar flow to the sample.The temperature-dependent PL experiments are performed immediately after the samples are prepared.Then, a thin PMMA layer is spin-coated (PMMA solution, 4 wt.% in anisole, the rotational speed is 2000 rpm for 20 s)on the sample surface for further characterizations at room temperature to reduce the influence of oxidative deterioration.

2.2.Characterization method
The morphology and quality of the CsSnX3(X= Br,I) microplates are measured by the following experiments.The bonding configuration is confirmed by XRD(Bruker,D8 Advance).The microstructure is characterized by the SEM(Thermo Fisher,Apreo S).The optical absorption is tested by the UV-Vis absorption spectroscopy(R1,Ideaoptics).
2.3.Low-temperature PL experiments
The PL spectra are investigated by a Horiba iHR550 spectrometer with the SmartRaman confocal-micro-Raman module developed by the Institute of Semiconductors, Chinese Academy of Sciences.In the PL measurement, the CsSnX3microplates are excited by a 532 nm laser with a power of 20 mW,which is focused by a 50×objective lens(NA=0.55)to get a spot size of approximately 1.2 µm.With the help of a closed refrigeration system (Janis CCS-XG), PL measurements are performed in the 10 K–295 K temperature range in increments of 15 K.The CsSnX3microplates are fixed on the sample stage in a closed cycle cryogenic equipment (Janis-CCS-XG-M/204N,Janis Research Company,Inc).
3.Results and discussion
3.1.Sample characterization
The UV-Vis absorption and PL spectra of the CsSnX3microplates are investigated at room temperature,as illustrated in Fig.1(b).According to the absorption edges,the bandgap energies of CsSnBr3and CsSnI3microplates are estimated to be 1.76 eV and 1.31 eV, respectively.Moreover, the PL spectra of these perovskite microplates show emission peaks at 1.81 eV and 1.35 eV for CsSnBr3and CsSnI3microplates,respectively.These results agree well with the previously reported bandgaps and optical bandgaps of CsSnBr3and CsSnI3samples.[24,28,30,32]
Figure 1(c) shows the XRD patterns of the CsSnBr3and CsSnI3microplates, which are compared with those of the mica substrate and type samples.The mica substrate displays a set of diffraction peaks with nearly equal spacing at 2θ= 18.03544◦, 27.06304◦, 36.2852◦, 45.76029◦,55.56962◦, and 65.71109◦.In addition to the peaks of mica,the peaks observed at 15.40581◦,21.79045◦,26.86848◦,30.93479◦,36.07118◦,44.32054◦,and 55.30156◦correspond to the diffraction planes of (100), (110), (111), (200), (210),(220), and (222) for CsSnBr3with a cubic phase (JCPDS file number: 70-1645), respectively.[24,28,30]Meanwhile, the peaks at 17.86033◦, 23.93894◦, 24.25168◦, 25.41325◦, and 40.55845◦correspond to the (111), (211), (121), (022), and(232)planes of orthorhombic CsSnI3(JCPDS file number:43-1162),respectively.[24,28,30]
3.油地工作涉及的国家政策法律法规及政府管理部门多。随着市场经济的进一步深入及各项法律法规的逐步颁布实施,油田在生产建设施工过程中,涉及到的相关法律法规和与之对应的行政管理和执法部门也愈来愈多,为油地工农关系协调工作增加了难度。由于地方政府很多事关油田的政务分散在各个部门,这些部门分工精细、条块分割、多头管理,办理起来比较繁琐。各部门都有自己的规定和标准,有一个环节不顺畅,整个项目就要受阻,导致工作无法继续。
Figure 2 exhibits the SEM images of the as-prepared CsSnX3microplates with different magnifications.Figure 2(a)shows that CsSnBr3microplates with a high spatial density are synthesized uniformly on the flat mica substrate.Figure 2(b)gives an isolated high-quality CsSnBr3microplate with about 3.3 µm×2.7 µm size.Note that this microplate is similar with the one used in the temperature-dependent PL experiment.From Fig.2(c),both microplates and micro-triangles of CsSnI3can be observed on the mica substrate.These microsheets of CsSnI3have a lower density than those of CsSnBr3and a smaller average size.In the temperature-dependent PL experiment,a relatively large microplate,which is similar with the one (∼2.6 µm×1.7 µm, larger than the spot size of the laser) shown in Fig.2(d), is selected and measured.Therefore, the CsSnBr3and CsSnI3microplates used in this work have high quality and similar sizes.

3.2.Temperature-dependent PL
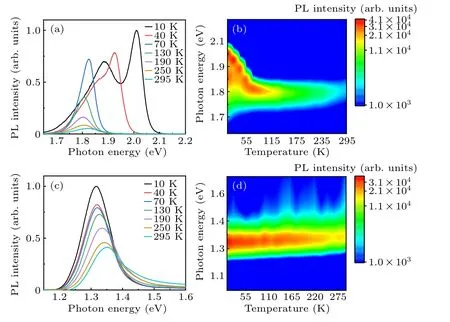
For the purpose of studying the temperature-dependent PL of CsSnX3perovskites,we record the steady-state PL spectra of CsSnBr3and CsSnI3microplates from 10 K to 295 K excited by a 532 nm continuous laser.Figures 3(a)and 3(c)show the PL spectra of CsSnBr3and CsSnI3microplates at different temperatures, respectively.For a more transparent presentation, the temperature and PL photon energy-dependent mapping of PL intensity of CsSnBr3and CsSnI3microplates are given in Figs.3(b)and 3(d),respectively.

When the temperature increases from 10 K to 295 K,the PL spectra of CsSnBr3and CsSnI3microplates exhibit dramatically different properties,which can be analyzed from the following three aspects: PL peak position (optical bandgap),width at half maximum (FWHM), and integrated intensity.Generally, for both CsSnBr3and CsSnI3microplates, the PL intensity shows a decreasing tendency and the FWHM has a broadening tendency.However,compared with the consistent blueshift tendency of the PL peak position of CsSnI3,the optical bandgap of the CsSnBr3microplate exhibits a blueshift at above 160 K while a redshift at below 160 K.In addition,a remarkable splitting of the PL peaks at extremely low temperatures can be observed in Figs.3(a)and 3(b).In the following part,we discuss the PL properties of CsSnBr3and CsSnI3microplates by splitting the PL peaks and fitting them with some theories to clarify the PL mechanism.
3.2.1.Splitting of the PL peaks of CsSnBr3 at low temperatures
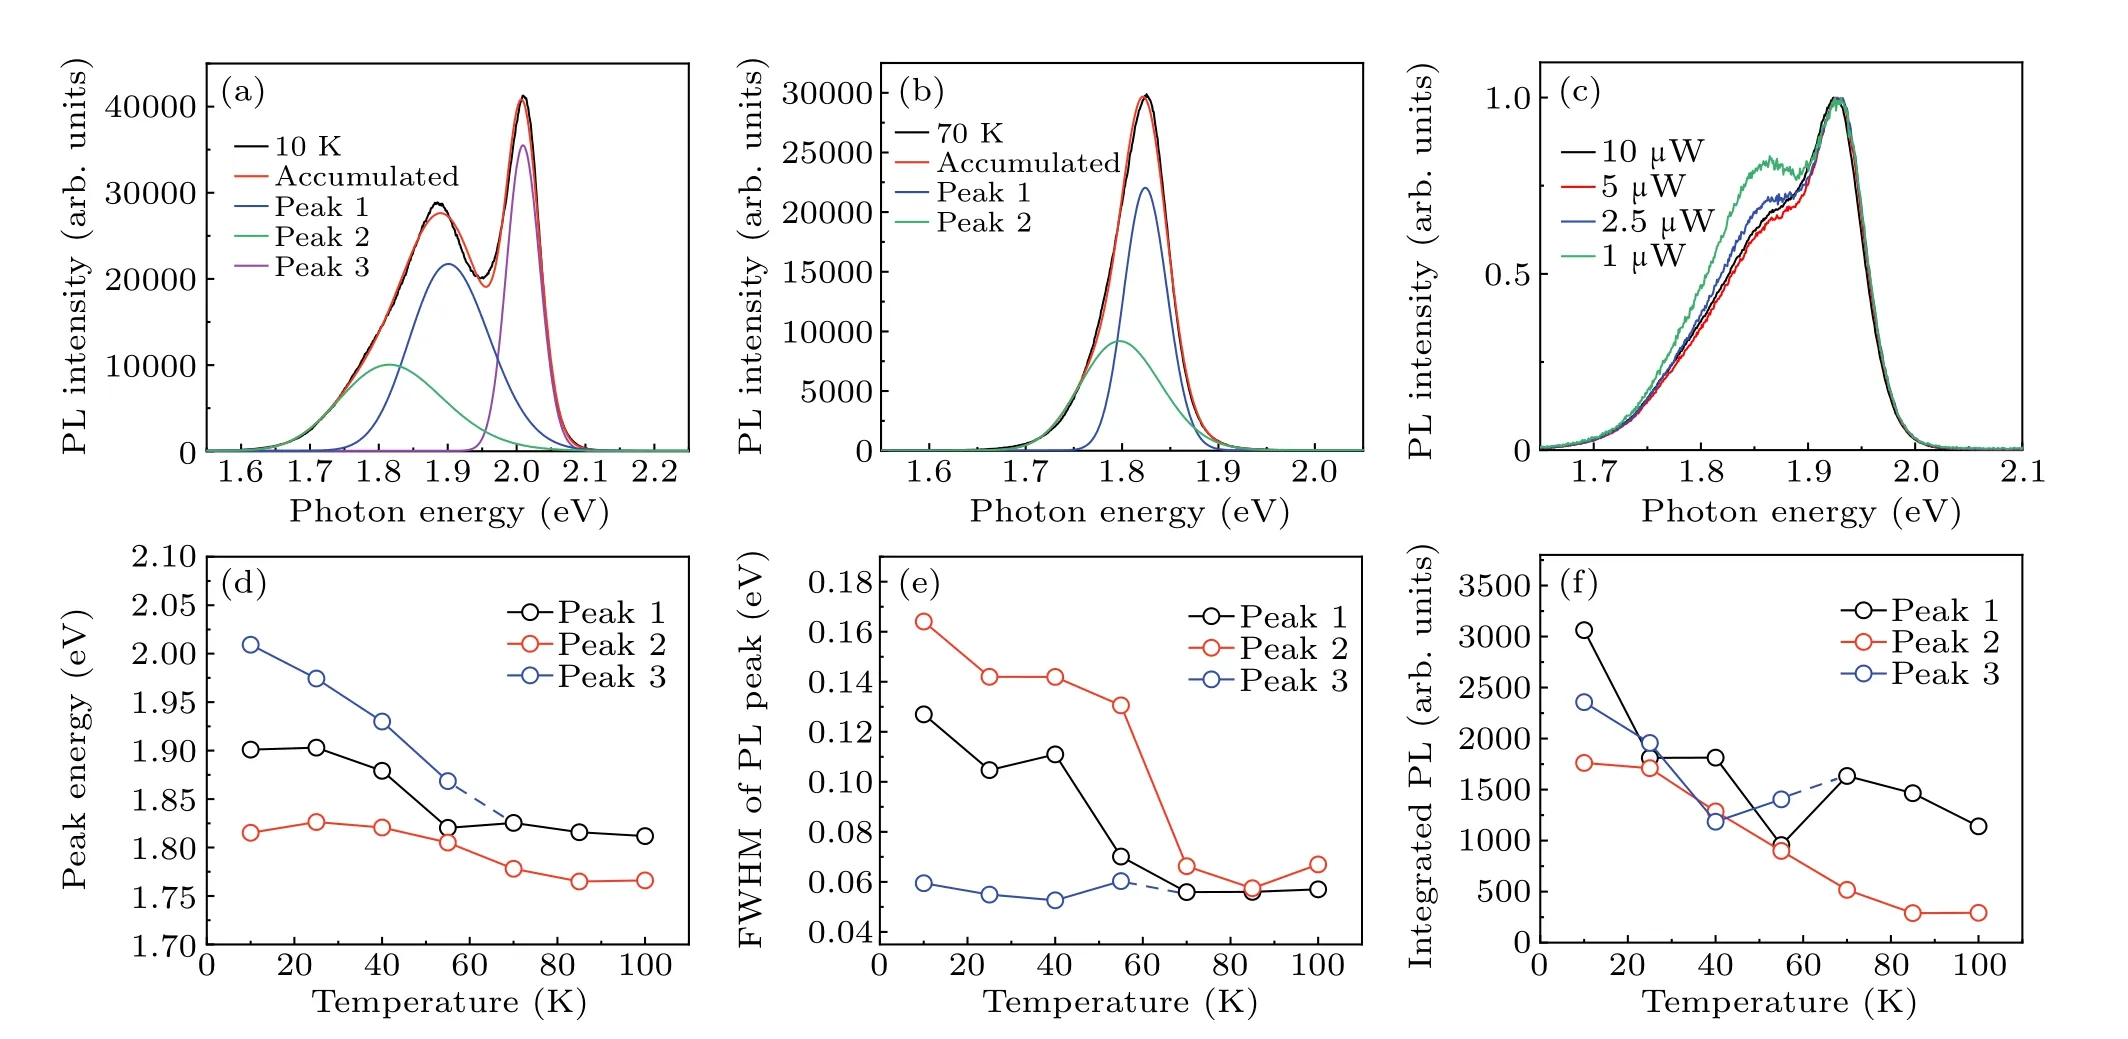
In the low-temperature region below 40 K, remarkable splitting of the PL peaks of the CsSnBr3microplate can be observed.In order to make the analysis easier,multi-peak fittings using Gauss functions are performed for the PL spectra below 100 K.From Fig.4(a),at least three sub-peaks can be used to fit the experiment at 10 K well.A similar three sub-peak fitting has also been used to match the experimental results below 55 K.In the region between 70 K and 100 K,the experimental PL peak can be well-fitted by two sub-peaks.Figure 4(b)exhibits the PL curve measured at 70 K as a representative.
The possible PL mechanisms are discussed in the following part.Firstly,the dramatic change of PL peaks in this low temperature region especially between 10 K and 70 K conforms to the characteristic of structural phase transition induced PL.For example,organic halide perovskite MAPbI3has a significant shift of the PL peak at∼160 K due to the structure changes from orthorhombic to tetragonal.[49]However,the reported structural transition temperatures of CsSnBr3are∼270 K from orthorhombic to tetragonal and∼300 K to cubic, which are far beyond this low-temperature region.[52–54]Recently, Gaoet al.have reported the appearance of several new peaks and some changes in the existing modes of Raman spectrum of CsSnBr3at below 80 K, which may be induced by the instability of orthorhombic phase.[55]They claim that there may exist a phase transition to a lower symmetry (possibly monoclinic) phase at around 60 K.This phenomenon is consistent with our result, indicating that the phase transition could be a possible explanation for the peak splitting at low temperatures below 70 K.However, before the report of more direct evidence,we cannot rule out other possible mechanisms.

Secondly,we try to understand the PL mechanism beyond the phase transition by analyzing the temperature-dependent sub-peak properties obtained in Fig.4.Take the 10 K condition as an example(Fig.4(a)),the positions of sub-peaks are at 2.01 eV(peak 3),1.90 eV(peak 1),and 1.82 eV(peak 2),corresponding to different FWHM values of 17.5 meV,46.7 meV,and 66.2 meV, respectively.Note that peaks 1 and 2 merge into a wide peak which cannot be fitted with a single Gauss function well, while peak 3 is separated and sharp.Because the characteristic thermal energy is much lower than the exciton binding energy, these sub-peaks could be induced by the radiative recombination of free excitons and bound excitons.Compared with free exciton emission,the peaks of bound exciton emission are usually broadened by the numerous binding sites to defects.[56]Therefore, it can be speculated that peaks 1 and 2 may be largely contributed by the bound exciton emission.This assumption is confirmed by the excitation powerdependent PL measurements.Figure 4(c) shows the power dependence of the PL spectra at 40 K as a representative.The PL intensity is normalized by the maximum value of peak 3.When the excitation power increases from 1 µW to 10 µW,the PL intensity ratio of the wide peak decreases and becomes saturated, which is a typical characteristic of bound exciton emission.[43,49]Therefore, peaks 1 and 2 at below 40 K are proved to be related to the bound exciton emission, and peak 3 is not induced by bound excitons.
Figures 4(d)–4(f) show the temperature-dependent peak position, FWHM, and integrated intensity extracted from the PL sub-peaks, respectively.From Fig.4(d), redshift is observed for all three sub-peaks,and the trend is more significant at below 70 K.Then,the separated peak 3 merges into peaks 1 and 2 at∼70 K.However,the total peak is still asymmetric,so at least two sub-peaks are needed to fit the experiment at above 70 K.Here,the redshift of peak energies could be induced by the exciton–phonon interaction,[46]which is a common reason for the PL peak position shift to lower energy.However,since the redshift trend is more significant at below 70 K,where the phonon effects may be suppressed, we believe the peak shift could also be induced by the transition of bound exciton emission with a wide energy range to free exciton emission.As supported by Fig.4(e), the FWHM of peaks 1 and 2, which are attributed to bound excitons with different energies, narrows dramatically at below 70 K and become stable at higher temperatures.From Fig.4(f), the sum of integrated PL intensity of peaks 1 and 2 is much larger than that of peak 3 at 10 K, indicating that the PL is governed by bound exciton emission at very low temperatures.These results suggest that the dominant PL mechanism of CsSnBr3changes from bound exciton emission to free exciton emission as temperature increases from 10 K to 70 K.
3.2.2.Splitting of the PL peaks of CsSnBr3 and CsSnI3
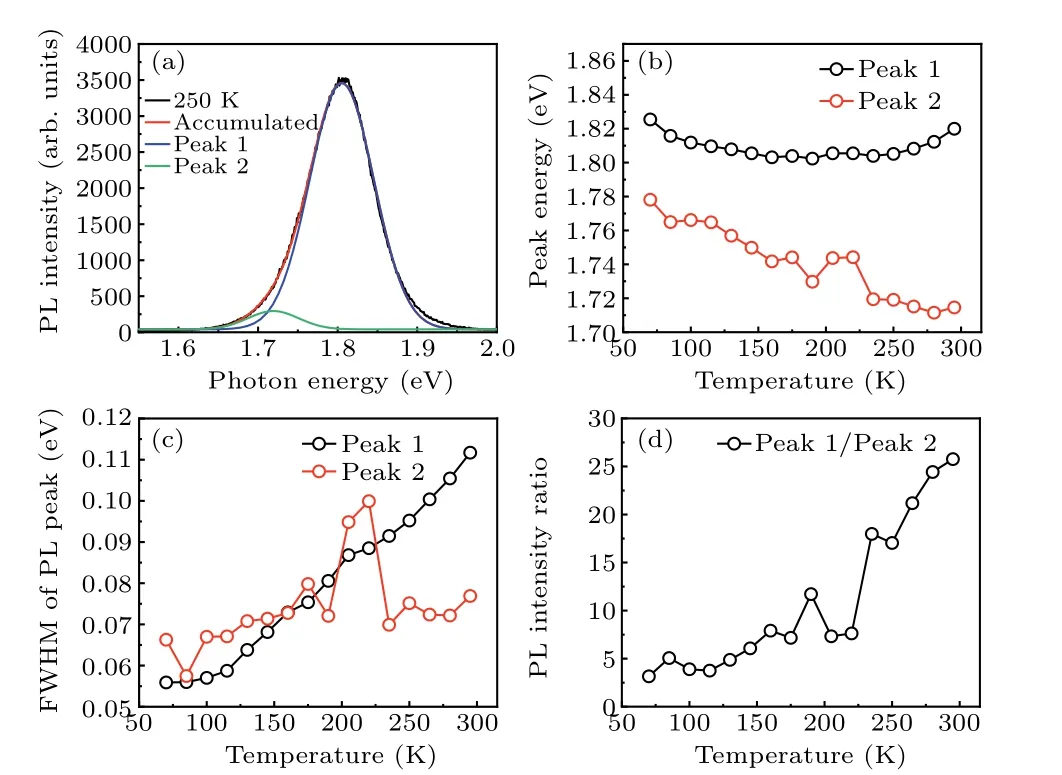
In the range from 70 K to 295 K,temperature-dependent PL properties of the CsSnBr3microplate are analyzed, as shown in Fig.5.Splitting the PL peaks is performed by fitting with two Gaussian peaks.Compared with the low-temperature condition of 70 K(Fig.4(b)),the side peak(peak 2)exhibits a greatly reduced influence on the main peak(peak 1)at 250 K,as shown in Fig.5(a).The evolution of the PL peak positions as temperature rises is given in Fig.5(b).Peak 2 exhibits a redshift trend in the whole range.However,a remarkable transition from redshift to blueshift of peak 1 is observed,indicating a complex PL mechanism.Figure 5(c)shows the temperaturedependent FWHM of peaks 1 and 2.The former appears to have an obviously broadening tendency,while the latter is relatively stable.The integrated PL intensity of peak 1 relative to that of peak 2 is shown in Fig.5(d).The largely enhanced intensity ratio implies that the contribution from peak 2 is gradually weakened with the increase of temperature.Here, the main and the side peaks are attributed to the band-edge and defect states, respectively.The dominant PL mechanisms for the change of the main peak are discussed in the last part with curve fitting.


In comparison, the temperature-dependent PL peaks of the CsSnI3microplate in the range from 10 K to 295 K are given in Fig.6.Because the PL spectra of CsSnI3also exhibit asymmetry, especially at near room temperatures, the experiments are fitted by the sum of two Gaussian peaks.For example, the splitting of the PL peak at 10 K is given in Fig.6(a).Moreover, the temperature-dependent PL peak position, FWHM of peaks, and integrated PL intensity ratio of peak 1/peak 2 are shown in Figs.6(b)–6(d), respectively.Here, the CsSnI3microplate shows quite different temperature-dependence of the PL properties.(i) In the lowtemperature region between 10 K to 100 K, the side peak is extremely weak and no obvious broadening of peak 1 is observed, indicating no significant bound exciton emission like in CsSnBr3.(ii) The peak energy of peak 2 is larger than that of the main peak, which is opposite to the condition of CsSnBr3.Moreover, only blueshift of peak 1 is obtained for CsSnI3as the rise of temperature,suggesting a different dominant mechanism.(iii) The broaden tendency of the FWHM of peak 1 is much weaker than that of CsSnBr3, implying a reduced electron–phonon coupling.(iv)The PL intensity ratio of peak 1/peak 2 reduces gradually, resulting in an enhanced asymmetry at near-room temperatures.Similar phenomena have also been covered in other reports.[45,57,58]Therefore,the PL mechanism of the side peak of CsSnI3should be different from that of CsSnBr3.According to Yu’s report,this asymmetric broadening may be caused by factors such as composition fluctuations and granular boundaries.[45]The changing mechanism of the main PL peak is discussed in the following part.
3.2.3.Fitting of temperature-dependent PL peaks
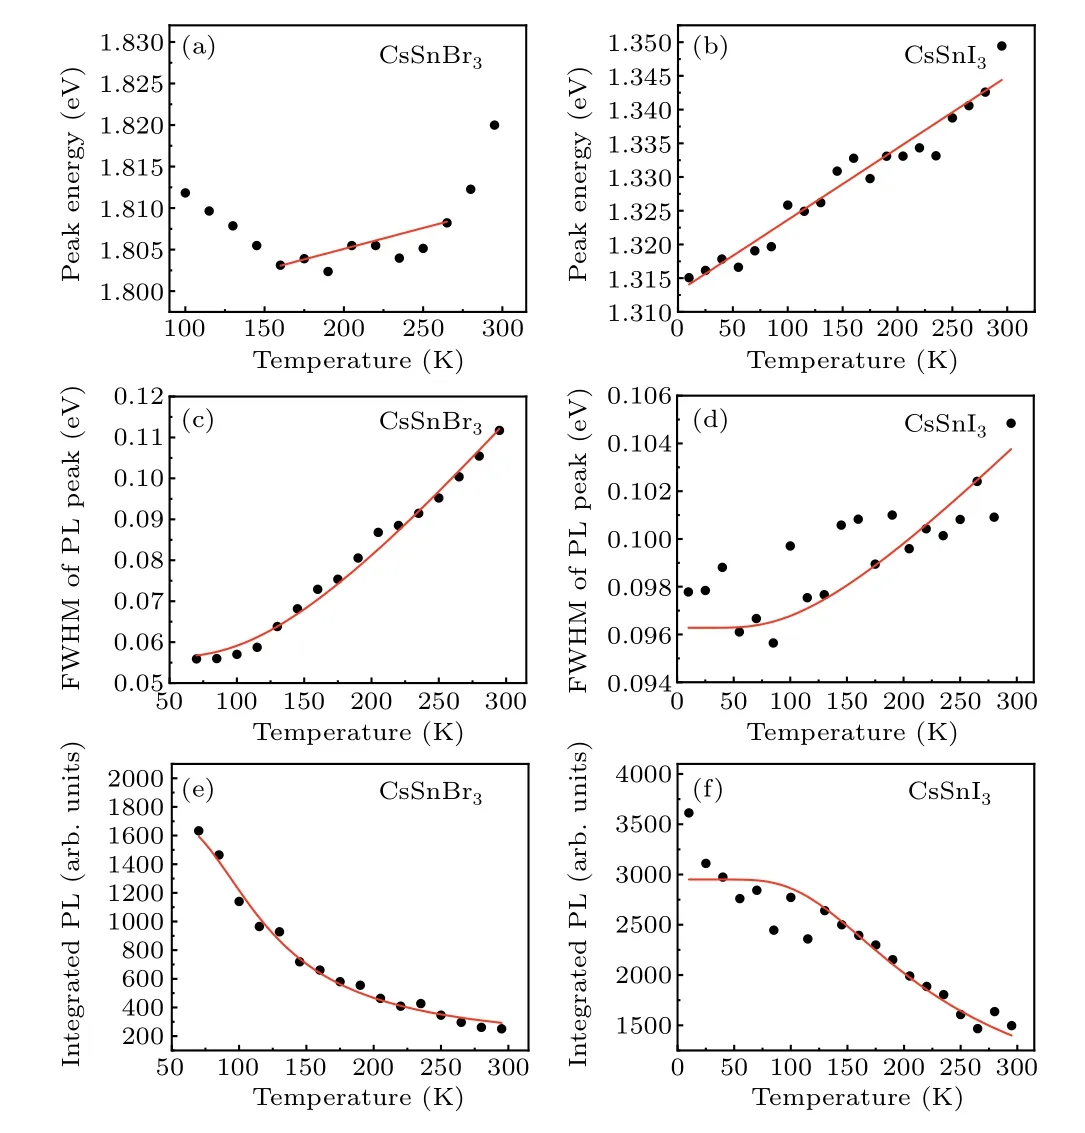
As shown in Fig.7, the temperature dependence of the PL peak energy,FWHM,and integrated intensity of the main peaks of CsSnBr3and CsSnI3microplates are studied by curve fitting based on some widely acknowledged theory models.As a result, many critical physical parameters are calculated, as given in Table 1.The detailed fitting processes and mechanism discussions are as follows.

Sample Eb (meV) E0 (eV) Γ0 (meV) γLO (meV) ELO (meV)CsSnBr3 32.0 1.79 56.2 166.0 35.1 CsSnI3 46.9 1.31 96.3 18.0 31.2
Firstly, the temperature-dependent shift of the PL peak position is discussed.Figure 7(a) shows that redshift and blueshift tendencies of the CsSnBr3microplate can be observed in temperature regions below and above 160 K,respectively.For the CsSnI3microplate, a consistent blueshift tendency of the PL peak position can be observed in Fig.7(b).For conventional semiconductors, the PL peak energyEgis usually described by an empirical relation asEg(T)=E0-αT2/(T+β),[40]whereE0is the unrenormalized bandgap,αandβare fitting parameters.This relation reveals a decrease in bandgap as temperature increases, which is usually influenced by electron–phonon interactions.However, this tendency is inconsistent with the blueshift of our perovskite samples.Meanwhile,the blueshift phenomena have been reported by many other lead-based perovskites,[42,45,48,51]in which the temperature-dependent bandgap is attributed to the following two factors: change of the lattice constant induced by thermal expansion;renormalization of the bandgap energies driven by electron–phonon interactions.[38,59–61]The former arises from the anharmonicity of the inter-atomic potentials.The latter consists of Fan[39]and Debye–Waller[62,63]terms, describing the virtual phonon emission/absorption processes and the interactions of an electron with two phonons with opposite wave vectors at the branchj, respectively.Therefore, the temperature dependence of the bandgap can be estimated by two terms[45]
wherenj,qis the phonon mode number at the branchjwith wave vectorqand follows the Bose–Einstein distribution.This equation can be further simplified based on the oneoscillator model as[45,46,51]

Secondly,the temperature dependence of the FWHM and the underlying mechanism is discussed.From Figs.7(c) and 7(d),the FWHM of CsSnBr3and CsSnI3microplates broadens with increasing temperature.Generally, this PL broadening is related to the electron–phonon coupling in inorganic semiconductors,such as the different scattering processes between charge carriers and phonons (or impurities), which have different dependencies on temperature.[38,41,64,65]According to the report by Wrightet al.,[42]the temperature-dependent PL linewidthΓcan be given as
whereΓ0is a temperature-independent inhomogeneous broadening term induced by scattering of disorder and imperfections;γacis defined as the coupling strength between charge carriers and acoustic phonons;γLOis the coupling strength between charge carriers and longitudinal optical phonons;ELOis the energy of longitudinal optical phonons;γimpis attributed to the scattering of impurities;Eimpis the average binding energy of impurities.In the fitting of both CsSnBr3and CsSnI3,theγacandγimpterms are set as zero according to the citation,[42]and the calculated lines agree well with the experiments, as shown in Figs.7(c) and 7(d).This result suggests that the electron–phonon coupling in CsSnX3microplates is dominated by the interaction between charge carriers and longitudinal optical phonons,which is consistent with the conclusion obtained in MAPbX3and FAPbX3perovskites.[42]Moreover, the fitting parameters of the CsSnBr3microplate areΓ0=56.2 meV,γLO=166.0 meV,andELO=35.1 meV,and of the CsSnI3microplate areΓ0=96.3 meV,γLO=18.0 meV,andELO=31.2 meV.Compared with CsSnI3, the coupling strength in the CsSnBr3microplate appears much more robust,which could be induced by the smaller high-frequency value of the dielectric function in CsSnBr3than in CsSnI3.[42]
Lastly, the temperature dependence of the integrated PL intensity of CsSnBr3and CsSnI3microplates are discussed according to the experimental data plotted in Figs.7(e) and 7(f), respectively.Here, a continuous decreasing trend is observed for both CsSnBr3and CsSnI3as the temperature rises.According to the literature, the relationship between the integrated PL intensityIand temperatureTcan be described by the Arrhenius equation as[44,47,48,51,66–69]
whereI0is the integrated PL intensity at 0 K,Ais the preexponential coefficient,Ebis the exciton binding energy, andkis the Boltzmann constant.From Figs.7(a)and 7(b),the red fitting lines agree well with the experiments, indicating that theEbvalues are estimated to be 32.0 meV and 46.9 meV for CsSnBr3and CsSnI3microplates, respectively.The continuous decrease of the PL intensity suggests that the radiative recombination is gradually suppressed by the thermal activation of exciton dissociation or non-radiative relaxation.The exciton binding energy of the CsSnBr3microplate is lower than that of the CsSnI3microplate.
4.Conclusion
High-quality CsSnX3(X= Br, I) microplates are prepared by CVD and characterized by XRD,SEM,and absorption spectroscopy.The temperature-dependent steady-state PL spectra of the samples are investigated in the range of 10 K–295 K.At the low-temperature region,the remarkable splitting of PL peaks of the CsSnBr3microplate is speculated to be induced by structural phase transition or the coexistence of free exciton emission and bound exciton emission with different energies.The temperature-dependent characteristics of PL intensity decline, peak position shift, and linewidth broadening are analyzed by curve fitting using several theoretical models.Moreover, several important physical parameters, such as exciton binding energy, unrenormalized bandgap, and coupling strength of longitudinal optical phonons,have been estimated from the fitting.Compared with the obvious linear blueshift of the PL peak energy of CsSnI3,the slight blueshift takes the leading role at above∼160 K in the PL of CsSnBr3, indicating that the thermal expansion weight is much stronger in CsSnI3than in CsSnBr3.The scattering of longitudinal optical phonons is proved to dominate the electron–phonon coupling in CsSnBr3and CsSnI3,but the coupling strength in CsSnBr3is more significant than that in CsSnI3.This research provides an insight into the photophysical properties of CsSnX3microplates, which is essential for tin perovskite-based optoelectronic applications,especially for developing micro-lasers.
Acknowledgment
Project supported by the National Natural Science Foundation of China(Grant Nos.11974279,12074311,12004310,and 12261141662).
猜你喜欢
杂志排行
Chinese Physics B的其它文章
- Optimal zero-crossing group selection method of the absolute gravimeter based on improved auto-regressive moving average model
- Deterministic remote preparation of multi-qubit equatorial states through dissipative channels
- Direct measurement of nonlocal quantum states without approximation
- Fast and perfect state transfer in superconducting circuit with tunable coupler
- A discrete Boltzmann model with symmetric velocity discretization for compressible flow
- Dynamic modelling and chaos control for a thin plate oscillator using Bubnov–Galerkin integral method
