Changes in Persistent Precipitation in Northwest China and Related Large-Scale Circulation Features
2023-11-10JingjingGAO,BaiquanZHOU,PanmaoZHAI
ABSTRACT Based on China’s daily precipitation data of 2415 stations and ERA5 hourly reanalysis data from 1961 to 2019, the station-based and regional precipitation events over Northwest China (NWC) are identified and sorted into persistent precipitation (PP, duration ≥ 2 days) events and non-persistent precipitation (NPP, duration = 1 day) events; and then changes in the persistence structure of the PP and NPP events over NWC and the long-term mean adjustment of the related large-scale circulation configuration are analyzed.The results show that PP and NPP both witness an increasing trend over most parts of NWC.In terms of the total precipitation at most stations and the regional mean, contributions from PP have been increasing, while those from NPP have been decreasing.This demonstrates that the wetting trend in NWC is mainly caused by the increase in PP.Through analyzing the large-scale circulation corresponding to regional PP events at several representative levels, we found that the westerly jet at 200 hPa, the ridge/trough systems at 500 hPa, and the Mongolian low at sea level are the key circulation systems responsible for regional PP events over NWC.As for long-term mean changes after and before 1990 (a shifting point recognized by previous studies), it is found that the extent of the South Asian high becomes larger and the westerly jet shifts northward by approximately 1.5 degrees in the upper troposphere.The ridge near the Ural Mountains and the ridge downstream of NWC strengthen by approximately 10-30 hPa at 500 hPa.Furthermore, the difference between the Mongolian low trough and its surrounding high pressure increases by approximately 2 hPa at the sea level.The combinations of circulation changes from upper to lower levels facilitate the strengthening of ascending motions.These adjustments in circulations create more favorable conditions for PP to occur over NWC in the last three decades.
Key words: persistent precipitation, large-scale circulation, westerly jet, South Asian high
1.Introduction
The Sixth Assessment Report of the Intergovernmental Panel on Climate Change (IPCC) stated that globally averaged land precipitation has likely increased since the mid 20th century, with a faster increase since the 1980s(IPCC, 2021).As the surface temperature rises, surface evaporation enhances and the atmosphere’s capacity to retain water also becomes greater (Trenberth, 1998).Some studies reported that uneven global warming may exacerbate precipitation imbalances around the world,which is often referred to as “wet regions getting wetter and dry regions getting drier” (Dore, 2005; Held and Soden, 2006; Hsu et al., 2011; Trenberth, 2011).However, the hydroclimatic changes are in fact more complex, especially at the regional scale (Li et al., 2019;Christidis and Stott, 2021).As a typical arid/semiarid region where the climate conditions are more sensitive to climate change, Northwest China (NWC) has attracted considerable attention due to its warming and wetting trend.In as early as the turn of the 21st century, Zhai et al.(1999) revealed an increase in precipitation over NWC since 1961, and Shi et al.(2003) pointed out that the climate in NWC shifted from warm-dry to warm-wet in the mid-1980s.Multiple studies further confirmed the gradually wetting climate over NWC in the context of climate warming (Zhai et al., 1999; Shi et al., 2007; Peng and Zhou, 2017).In terms of spatial distribution, western NWC that is relatively more arid has received increasing precipitation since 1961, while a small part of eastern NWC has been drying (He and Zhai, 2018; Wang et al., 2020, 2021; Yao et al., 2022).
Causal and mechanistic studies on this interesting“warming-wetting” phenomenon in NWC have been emerging.From the perspective of thermodynamical influence induced by global warming, several studies attribute the precipitation increase in NWC to the increased evaporation and enhanced water vapor convergence (Xu et al., 2016a, b).In addition, climate change also alters large-scale circulation, thereby indirectly affecting the precipitation and temperature over a region(Vautard et al., 2016).Favorable circulation is a requisite for precipitation to occur (Chen and Zhai, 2014; Zhou and Zhai, 2016), and its frequent occurrence tends to bring more precipitation (Mattingly et al., 2016).Increase in precipitation over the past 50 years in western NWC, especially Xinjiang, is significantly related to the increase in geopotential height over Siberia and the decrease in geopotential height over the Iranian Plateau(Chen and Dai, 2009).The midlatitude westerly wind in summer and the plateau summer monsoon are also claimed to have important impact on the precipitation in NWC (Yang et al., 2019; Zhang et al., 2022).Through exploring the annual shift direction of precipitation in NWC and circulation indices, Zhang et al.(2021) suggested that the precipitation increase in NWC is probably related to the strengthening of westerly circulation and upward movement.Lu et al.(2021) reported that upper-to-low level circulations as well as summer water vapor and atmospheric instability all become favorable for the increased occurrences of summer extreme precipitation in the westerly zone and plateau zone in NWC.
However, these previous studies on precipitation changes over NWC mainly concentrate on precipitation sums at seasonal or annual scale while omitting the property of persistence for precipitation events.The number of consecutive wet days cannot be overlooked as prolonged rainfall leads to flooding and secondary disasters(Zolina et al., 2010).The persistence structure change of precipitation has been found in Europe and middle-lower reaches of the Yangtze River (Zolina et al., 2010; Yu and Zhai, 2021).Wet periods become longer and bring more abundant precipitation to these places.Therefore, besides frequency and intensity, the persistence structure change is also an unneglectable factor that accounts for the long-term changes in precipitation over NWC.Furthermore, the annual mean or even decadal mean shift in circulation systems are usually examined to seek the causes for the precipitation change over NWC.This may obscure the critical signals since days with no precipitation are also mixed up in the mean circulations.In other words, circulation systems which really matter for precipitation changes are those occurring on days with precipitation events.It is also noteworthy that the causes for precipitation vary with the duration.Persistent precipitation is reported to be more susceptible to circulation (Zuo et al., 2013; Ding and Gao, 2020).
In light of the above points, this study categorizes precipitation events in NWC into events with short or long persistence.Changes in the occurrence frequency and contribution to total precipitation are then uncovered.Based on the identified precipitation events, long-term changes in the corresponding circulation configuration at various levels are further diagnosed, aiming to deepen our understanding on the structure change and increment of precipitation over NWC.The remainder of the paper is organized as follows.Data employed and the definition of precipitation events with short or long persistence, as well as the diagnostic methods, are described in Section 2.Changes in the characteristics of precipitation structure and the associated large-scale circulation systems are presented in Sections 3 and 4, respectively.This paper ends with discussion and conclusions in Section 5.
2.Data and methods
2.1 Data
The daily precipitation data used in this study from 2415 meteorological stations in China over 1961-2019 are obtained from the National Meteorological Information Centre of the China Meteorological Administration.This dataset has been subject to strict quality control, including recovering some missing historical records, correcting suspicious and incorrect observations, reconciling inhomogeneities caused by site relocation, and upgrading observation instruments.Stations are retained when they meet the following criteria: (1) missing daily data accounts for less than 5% in any year over 1961-2019; and (2) between 1961 and 2019, the relocation of a station is no more than 20 km horizontally and 50 m vertically.These criteria are to ensure the continuity of data and avoid inhomogeneity caused by station displacement.After the above rigorous quality control,1277 sites are retained nationwide in this study, among which 132 are in NWC (Fig.1).
In addition, the ERA5 hourly reanalysis data (Hersbach et al., 2020) with a horizontal resolution of 1° × 1°from 1961 to 2019, provided by the ECWMF, are used to diagnose the circulation systems related to persistent precipitation (PP).
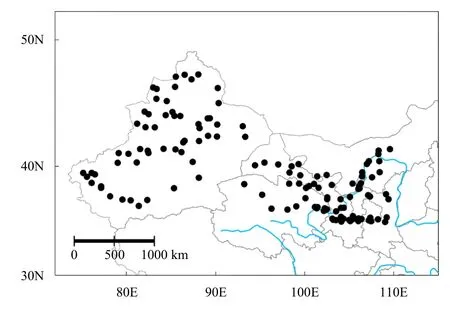
Fig.1.Distribution of meteorological stations in Northwest China.
2.2 Methods
First, the daily precipitation at a station greater than 1.0 mm is identified as a precipitation day for that station.This threshold (> 1 mm day-1) accounts for the limited accuracy of rain gauges and is utilized to exclude days with very little precipitation (Tank and Können,2003; Zolina et al., 2010).PP is identified as a process with significant precipitation lasting for at least 2 consecutive days, while non-persistent precipitation (NPP) is defined as a precipitation day with precipitation not exceeding 1.0 mm before and after this day.
For the identification of regional precipitation events,a factor that must be considered is spatial extent (Zhang et al., 2001; Tang et al., 2006; Tu et al., 2011; Ren et al.,2012; Chen and Zhai, 2013).Tu et al.(2011) used cluster analysis to identify heavy precipitation events and minimum Euclidean distance greater than 200 km (approximately equivalent to the distance between two adjacent latitudes) between any two clusters to discriminate two regional events.Niu et al.(2018) defined regional heavy precipitation as at least 15 neighboring grids with daily precipitation exceeding 50 mm at a 0.5° × 0.5° grid.Given the complex terrain and relatively sparse stations in NWC, the criteria of spatial extent that we use in this study to identify regional PP events is that at least 3 stations undergo PP in a 2° × 2° area.
Besides spatial extent, temporal persistence is also considered when defining regional PP events (at least 2 days defined in this paper).This means that days adjacent to each other with duration more than 2 days constitute a regional PP event over NWC, if precipitation on these days meets the above criteria of spatial extent.All the days included in regional PP events are referred to as regional PP event days.A total of 695 days of regional PP events and 910 days of regional NPP events are identified (detailed information of these PP and NPP events is provided in the supplementary document).Days with no regional PP events are referred to as non-event days.
Composite analysis (Shi et al., 1997) is used to study the key circulation configuration that led to regional PP.By comparing the large-scale circulation on regional PP event days with that on non-event days, we disentangle the key large-scale circulation systems responsible for the regional PP.
In addition, we further explored the decadal shift of the large-scale circulations corresponding to the regional PP events to explain the changes in precipitation structure.Previous studies have revealed that precipitation in NWC changed significantly in approximately the year 1990 (Song and Zhang, 2003; Zhang et al., 2021).Given that PP is closely governed by large-scale circulation, in this study, we explored the changes in the large-scale circulation on regional PP event days by comparing the long-term mean circulations during 1961-1990 with those during 1991-2019.
3.Changes in precipitation structure over NWC
Previous studies have shown a general increase in precipitation over NWC (Zhai et al., 1999; Wu et al., 2019;Wang et al., 2020).The updated observation records covering 1961-2019 show the same result (Fig.2a).Same as total precipitation, PP and NPP also exhibit increasing trends (Figs.2b, c), and these trends pass the 0.01 significance test.Noteworthily, the magnitude of the increase in PP is significantly greater than that of NPP.Similar to previous studies, a dipole pattern is found from the longterm mean changes in total precipitation with an extensive increase over central and western NWC and a decrease over a small part of eastern NWC (figure omitted).Changes in PP and NPP show similar spatial patterns but with different magnitudes (Figs.3a, b).The amplitudes of changes in PP are prominently greater than those of NPP at most stations.In northwestern Xinjiang Region,Gansu Province, and northern Qinghai Province, the increase in PP is more remarkable (Fig.3c).Therefore, it could be inferred that the contribution of the changes in PP has a more significant contribution to the change in total precipitation over NWC.

Fig.2.Time series of the area-averaged anomalies of (a) total precipitation, (b) PP, and (c) NPP in NWC in warm season (May-September) and the linear trends over 1961-2019.The symbol * indicates that the trend is statistically significant at 90% confidence level based on Student’s t test.

Fig.3.Changes in (a) total precipitation, (b) PP, and (c) NPP in NWC in warm season (May-September) between 1991-2019 and 1961-1990.The black dots indicate the stations that are statistically significant at 90% confidence level based on Student’s t test.
To demonstrate the increasing contribution from PP to total precipitation, contribution of PP and NPP to total precipitation during 1961-2019 and their trends were examined.The results show that the contributions of PP to total precipitation at stations show similar spatial distribution to that of the total precipitation (Fig.4a).The stations with large contributions from PP are concentrated in eastern Gansu, Ningxia, and western Inner Mongolia.Comparatively, contributions from NPP show opposite spatial distribution.In more arid regions, such as Xinjiang, Qinghai, western Gansu, and western Inner Mongolia, the contributions of NPP appear to be larger,reaching 50%-70% (Fig.4b).It can be found that the contributions of PP to total precipitation show an increasing trend at most stations in NWC (Fig.4c).In contrast,only a very small number of stations see the increasing contribution from NPP (Fig.4d).The time series of the area-averaged anomaly of contributions to total precipitation reflect an increasing contribution from PP (Fig.4e),but a decreasing contribution from NPP (Fig.4f).These results indicate that precipitation in NWC tends to appear in the form of PP, and the increase in PP is the main reason leading to the rising precipitation.
In addition, this study further identified and explored the changes in regional PP events in NWC.The results show that the number of regional PP event days in NWC has also increased (figure omitted).In the following sections, the circulation configurations corresponding to the regional PP events are diagnosed and the circulation changes responsible for the increasing regional PP events over NWC are further explored.
4.Large-scale circulation associated with PP and their changes
4.1 Contrast between regional PP event days and non-event days
To obtain the key systems that influence PP in NWC,we composited and analyzed the differences in the circulation at 200 hPa, 500 hPa, and sea level on days with and without regional PP events.At regional PP event days, the main active circulation system at 200 hPa is the westerly jet stream and South Asian high.The center of the westerly jet stream is located over NWC, and the South Asian high has a larger extent compared to that during non-event days.The southern part of NWC is located on the right side of the entrance area of westerly jet,where divergence often prevails (Fig.5a).
At 500 hPa, negative anomalies over NWC accompanied by positive anomalies near the Ural Mountains and downstream of NWC form a typical circulation system characterized by double high ridges and a trough between them.This circulation configuration is conducive to the maintenance of the system and the interaction between cold and warm air.NWC is located in front of the deep trough and behind a ridge, which favors ascending motion over NWC (Fig.6a).The Mongolian low prevails in PP event days, as indicated by the composited sea level pressure (SLP) anomalies, which facilitates the convergence of low-level water vapor to NWC (Fig.7a).The above-mentioned key systems at 500 hPa and sea level are statistically significant at the 99% confidence level in the composited fields.
Contrastingly, at non-event days, the above-mentioned circulation systems behave in a different way.The westerly jet stream center at 200 hPa is located at the east of NWC.The anomalies at 500 hPa and sea level are very weak, which means that circulations at these layers are very close to climatological states (Figs.5b, 6b, 7b)(the difference between two periods passes the 0.01 sig-nificance test).Considering the circulation systems from the upper to lower levels at PP event days, it is found that the upper-level divergence at 200 hPa is intertwined with a favorable spatial distribution of ridge/trough systems,as well as a convergent wind field at sea level.This configuration facilitates ascending motion over NWC, thus contributing to regional PP events in NWC.On this basis, this study further explored the long-term mean changes in these circulation systems that play a role at PP event days, attempting to explain the increasingly frequent regional PP events over NWC.
4.2 Changes in key influential circulations related to PP
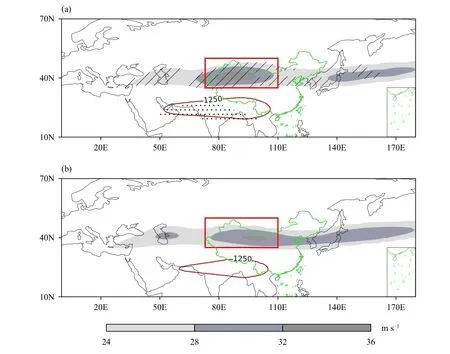
Fig.5.The composited zonal wind speed (shadings) and geopotential height (characterized by 1250-dagpm contour) at 200 hPa (a) at regional PP event days and (b) at non-event days during 1961-2019.The black dots and diagonal lines indicate the areas where the composites and differences are statistically significant at 99% confidence level based on Student’s t test.

Fig.6.The composited potential height (contours; dagpm) and its anomaly (shadings; gpm) at 500 hPa (a) at regional PP event days and (b) at non-event days during 1961-2019.The black dots indicate the areas where the composites and differences are statistically significant at 99% confidence level based on Student’s t test.
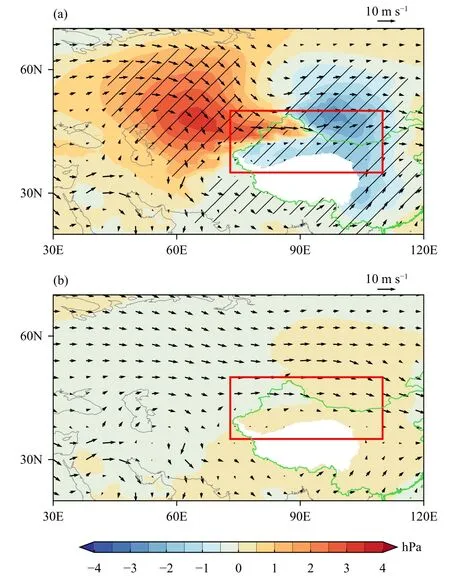
Fig.7.The composite of sea level pressure anomaly (shadings) and wind (vectors) at 700 hPa (a) at regional PP event days and (b) at nonevent days during 1961-2019.Diagonal lines indicate the areas where the composites and differences are significant at the 99% confidence level based on Student’s t test.
The differences of the large-scale circulations responsible for PP between 1991-2019 and 1961-1990 were explored to uncover the long-term evolution of the largescale circulations.A detailed description of the main circulation system at 200 hPa has been given previously.When we divided the study period into two parts, the key systems could also be found to be active at PP event days(Figs.8a, b).We further explored their changes before and after 1990 (Fig.8c).Compared with early period, the westerly over north of NWC is stronger, while over south of NWC, it is weaker.Such changing feature is in associated with a northward shift of the core of the jet stream.Our estimation is that the core of the subtropical jet stream shifted northward by about 1.5 degrees during these two periods.The zonal wind strengthened over western NWC but weakened over eastern NWC.Such changes are more favorable to upward movement over western NWC and thus be more favorable to precipitation.In the late period, as the South Asian high at 200 hPa expanded remarkably, NWC were highly influenced by such circulation changes.Some previous studies have shown that the eastward and northward shifts of South Asian high favor precipitation in NWC (Wang et al.,2016; Luo et al., 2023).The wider South Asian high squeezes westerly jet, causing the westerly jet to move northward, indirectly affecting the upward movement over NWC.
At 500 hPa, the key circulation configuration is also characterized by a double high ridge and a trough sandwiched between them in the early and late periods.It is clear that these high ridge and low trough centers all pass the 0.01 significance test (Figs.9a, b).Under the background of global warming, the difference of potential height at 500 hPa between the two periods shows positive anomalies over most parts of the study region.Most of the positive difference is statistically significant at 99% confidence level.However, the positive difference shows various magnitudes in different regions (Fig.9c).Compared to the early period, both the ridge near Ural Mountains and the ridge downstream of NWC have been strengthened by about 10-30 hPa in the late period,which is conducive to the maintenance of the double high ridges.In addition, the Indian Ocean subtropical high exhibits a northeastward shift (Figs.9a, b), which leads to more advection of moisture to NWC.
In the two separated periods, the key systems at sea level are also akin to that in the whole period.The Mongolian low trough prevails, inducing water vapor convergence to NWC (Figs.10a, b).In the north near 50°N,there is a large area dominated by significant positive anomalies.The north wind in the northeastern edge of the positive anomalies transports cold and dry air to NWC.The changes in sea-level pressure on PP event days also show widespread positive anomalies.The positive anomalies of the high pressure located in the northwest of NWC are enhanced in the late period (the difference between two periods passes the 0.01 significance test).The greater pressure difference between the high-pressure anomalies and the Mongolian low (about 2 hPa) creates more favorable conditions for convergence at the low layer (Fig.10c).
5.Conclusions and discussion
In the context of global warming, the global and regional water cycle and humidity have undergone significant changes, which have a huge impact on the socioeconomic and ecological environment (Editing Commission of the Third Assessment Report of the Chinese Climate Change, 2015).The humidity in NWC has also undergone significant changes (Zhao et al., 2003; Wang et al.,2012).On the shoulders of previous studies that tried to elucidate the wetting trend over NWC, this study moves a step forward to figure out the changes in persistence structure of precipitation and the underlying causes.Station-based and regional precipitation events with short (1 day) and long (≥ 2 days) durations were identified over NWC.Meanwhile, characteristics of typical circulation patterns on days when PP events were observed and their long-term changes were further explored.The main conclusions and associated discussion are as follows.

Fig.8.The composited subtropical westerly jet (shadings) and South Asian high (characterized by 1250-dagpm contour) at 200 hPa for regional PP event days (a) over 1961-1990, (b) over 1991-2019, and (c) the differences between the two periods.The shadings are the difference of zonal wind speed; the brown dotted and solid lines indicate the South Asian high before and after 1990.The black dots and diagonal lines indicate the areas where the composites and differences are statistically significant at 99% confidence level based on Student’s t test.
For station precipitation events, it is found that PP and NPP both exhibit a widespread increase over NWC during 1961-2019, except a small part of eastern NWC undergoing a decrease of PP and NPP.The contributions from PP to total precipitation have been increasing, while those from NPP have been decreasing.This indicates that precipitation in NWC tends to appear in the form of PP,and the increase in PP accounts for a large part of the total precipitation increment over NWC.
For regional-scale events, a total of 695 days of regional PP events and 910 days of regional NPP events over NWC were identified.The frequency of regional PP events also shows an increasing trend during 1961-2019.The subsequent diagnostic and causal analyses were all based on the identified event days, which helps sort out the circulation systems that really matter for PP events.
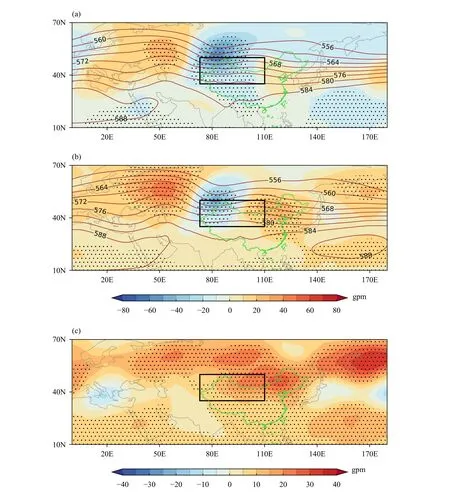
Fig.9.The composited potential height (contours) and its anomaly (shadings) at 500 hPa for regional PP event days (a) over 1961-1990, (b)over 1991-2019, and (c) the differences between the two periods.The black dots indicate the areas where the composites and differences are statistically significant at 99% confidence level based on Student’s t test.
PP events are often caused by large-scale circulation anomalies that last several consecutive days (Dole and Gorden, 1983; Higgins and Mo, 1997; Samel and Liang,2003; Zhai et al., 2016).Through synoptic diagnoses on specific PP cases, this paper reveals that PP events in NWC are closely connected with the persistence of blocking high in middle and high latitudes and South Asian high, as well as strong low-level convergence(Zhang et al., 1986; Feng et al., 2021).To enhance the representativeness of the key circulation systems, we conducted the composite analysis on all the identified PP event days and non-event days.Composite differences in circulation at various levels between PP event days and non-event days were investigated.It is found that the main systems responsible for regional PP over NWC are the westerly jet stream and South Asian high at 200 hPa,the ridge/trough systems over the upstream and downstream of NWC at 500 hPa, and the Mongolian low at sea level.
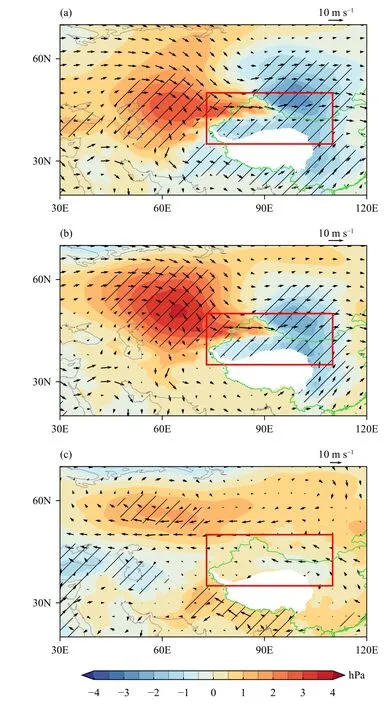
Fig.10.The composite of sea level pressure anomaly (shadings) and wind (vectors) at 700 hPa for regional PP event days (a) over 1961-1990, (b) over 1991-2019, and (c) the differences between the two periods.Diagonal lines indicate the areas where the composites and differences are significant at the 99% confidence level based on Student’s t test.
Changes in the large-scale circulation before and after 1990 were further analyzed.As synthesized in the conceptual diagram (Fig.11), the westerly jet stream has shifted northward by about 1.5 degrees and became strengthened.The extent of the South Asian high has become larger in recent three decades.Such concurrent combinations of changes in circulation systems result in upper-layer divergence at higher levels.At 500 hPa, the ridge over the Ural Mountains and the ridge downstream of NWC were strengthened by about 10-30 hPa.This is favorable for the maintenance of the ridge/trough systems, and NWC is located downstream of the trough.The downstream of the trough is characterized by divergent conditions that favor ascending motion.At sea level, the high pressure in the northwest of NWC enhances, which leads to the increase of the pressure gradient between the high pressure and the Mongolian low, further resulting in stronger convergence at the lower layer.Under this configuration of circulation anomalies from upper to lower levels, ascending motion is strengthened.These adjustments in circulations create favorable conditions for regional PP events to occur over NWC in the last three decades.
Admittedly, considering that precipitation is an extremely complex weather process and climate change has caused widespread and rapid changes in the climate system (IPCC, 2021), the analyses on the influencing factors of regional precipitation change would never be exhaustive.For example, shifts in atmospheric instability, ascending motion, and frequency of favorable daily circulation patterns would also affect and cause changes in precipitation (Zhou et al., 2020; Lu et al., 2021; Zhang et al., 2021).In this work, we give a picture of circulation configuration at several representative levels responsible for persistent precipitation over NWC.We find that the long-term mean circulation configuration has adjusted to be more favorable for the occurrence of PP events over NWC.More efforts need to be made on comprehensively depicting the continuum of daily circulations closely related to precipitation process over NWC.In addition, the frequency changes of the key circulation systems also need to be addressed.Further studies are on the way.
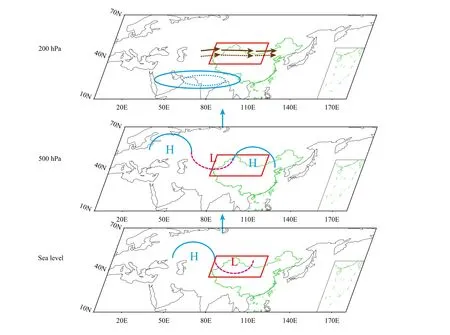
Fig.11.Conceptual diagram for the configuration of the key influential circulation systems responsible for PP in NWC from the upper to lower layers.At 200 hPa, the dashed lines represent the early period, and solid lines represent the late period; at 500 hPa and the sea level, the solid lines indicate system strengthening, and the dashed lines indicate system weakening.The upward arrow represents the ascending motion.
Feng, Y., A.Niyazi, and R.Yunusi, 2021: Cause analysis of an extreme heavy rainstorm process on July 31 of 2018 in Hami of Xinjiang.J.Arid Meteor., 39, 426-435, 456.(in Chinese)
He, B.R., and P.M.Zhai, 2018: Characteristics of the persistent and non-persistent extreme precipitation in China from 1961 to 2016.Climate Change Res., 14, 437-444, doi: 10.12006/j.issn.1673-1719.2018.016.(in Chinese)
Held, I.M., and B.J.Soden, 2006: Robust responses of the hydrological cycle to global warming.J.Climate, 19, 5686-5699,doi: 10.1175/JCLI3990.1.
Hersbach, H., B.Bell, P.Berrisford, et al., 2020: The ERA5 global reanalysis.Quart.J.Roy.Meteor.Soc., 146, 1999-2049,doi: 10.1002/qj.3803.
Higgins, R.W., and K.C.Mo, 1997: Persistent North Pacific circulation anomalies and the tropical intraseasonal oscillation.J.Climate, 10, 223-244, doi: 10.1175/1520-0442(1997)010<0223:PNPCAA>2.0.CO;2.
Hsu, P.-C., T.Li, and B.Wang, 2011: Trends in global monsoon area and precipitation over the past 30 years.Geophys.Res.Lett., 38, L08701, doi: 10.1029/2011GL046893.
IPCC, 2021: Summary for Policymakers.In:Climate Change 2021:The Physical Science Basis.Contribution of Working Group I to the Sixth Assessment Report of the Intergovernmental Panel on Climate Change, Masson-Delmotte, V., P.Zhai, A.Pirani, et al., Eds., Cambridge University Press,Cambridge, United Kingdom and New York, NY, USA,3-32, doi: 10.1017/9781009157896.001.
Li, Y.P., Y.N.Chen, and Z.Li, 2019: Dry/wet pattern changes in global dryland areas over the past six decades.Glob.Planet.Change, 178, 184-192, doi: 10.1016/j.gloplacha.2019.04.017.
Lu, S., Z.Y.Hu, H.P.Yu, et al., 2021: Changes of extreme precipitation and its associated mechanisms in Northwest China.Adv.Atmos.Sci., 38, 1665-1681, doi: 10.1007/s00376-021-0409-3.
Luo, H.Y., H.P.Yu, Z.Y.Hu, et al., 2023: Progress of the impact of the Qinghai-Xizang Plateau heat sources on climate anomalies in drylands of China.Plateau Meteor.,42, 257-271, doi: 10.7522/j.issn.1000-0534.2022.00070.(in Chinese)
Mattingly, K.S., C.A.Ramseyer, J.J.Rosen, et al., 2016: Increasing water vapor transport to the Greenland Ice Sheet revealed using self-organizing maps.Geophys.Res.Lett., 43, 9250-9258, doi: 10.1002/2016GL070424.
Niu, R.Y., C.H.Liu, W.Y.Liu, et al., 2018: Characteristics of temporal and spatial distribution of regional rainstorm processes to the east of 95°E in China during 1981-2015.Acta Meteor.Sinica, 76, 182-195, doi: 10.11676/qxxb2017.092.(in Chinese)
Peng, D.D., and T.J.Zhou, 2017: Why was the arid and semiarid northwest China getting wetter in the recent decades?J.Geophys.Res.Atmos., 122, 9060-9075, doi: 10.1002/2016JD026 424.
Ren, F.M., D.L.Cui, Z.Q.Gong, et al., 2012: An objective identification technique for regional extreme events.J.Climate,25, 7015-7027, doi: 10.1175/JCLI-D-11-00489.1.
Samel, A.N., and X.Z.Liang, 2003: Understanding relationships between the 1998 Yangtze River flood and northeast Eurasian blocking.Climate Res., 23, 149-158, doi: 10.3354/cr02 3149.
Shi, N., F.Y.Wei, G.L.Feng, et al., 1997: Monte Carlo test used in correlation and composite analysis of meteorological fields.J.Nanjing Inst.Meteor., 20, 355-359.(in Chinese)
Shi, Y.F., Y.P.Shen, D.L.Li, et al., 2003: Discussion on the present climate change from warm-dry to warm-wet in Northwest China.Quat.Sci., 23, 152-164, doi: 10.3321/j.issn:100 1-7410.2003.02.005.(in Chinese)
Shi, Y.F., Y.P.Shen, E.S.Kang, et al., 2007: Recent and future climate change in Northwest China.Climatic Change, 80,379-393, doi: 10.1007/s10584-006-9121-7.
Song, L.C., and C.J.Zhang, 2003: Changing features of precipitation over Nothwest China during the 20th century.J.Glaciol.Geocryol., 25, 143-148, doi: 10.3969/j.issn.1000-0240.2003.02.005.(in Chinese)
Tang, Y.B., J.J.Gan, L.Zhao, et al., 2006: On the climatology of persistent heavy rainfall events in China.Adv.Atmos.Sci., 23,678-692, doi: 10.1007/s00376-006-0678-x.
Tank, A.M.G.K., and G.P.Können, 2003: Trends in indices of daily temperature and precipitation extremes in Europe,1946-99.J.Climate, 16, 3665-3680, doi: 10.1175/1520-0442(2003)016<3665:TIIODT>2.0.CO;2.
Trenberth, K.E., 1998: Atmospheric moisture residence times and cycling: Implications for rainfall rates and climate change.Climatic Change, 39, 667-694, doi: 10.1023/A:1005319109110.
Trenberth, K.E., 2011: Changes in precipitation with climate change.Climate Res., 47, 123-138, doi: 10.3354/cr00953.
Tu, K., Z.W.Yan, and Y.Wang, 2011: A spatial cluster analysis of heavy rains in China.Atoms.Oceanic Sci.Lett., 4, 36-40,doi: 10.1080/16742834.2011.11446897.
Vautard, R., P.Yiou, F.Otto, et al., 2016: Attribution of human-induced dynamical and thermodynamical contributions in extreme weather events.Environ.Res.Lett., 11, 114009, doi:10.1088/1748-9326/11/11/114009.
Wang, C.H., J.Li, and X.G.Xu, 2012: Universality of quasi-3-year period of temperature in last 50 years and change in next 20 years in China.Plateau Meteor., 31, 126-136.(in Chinese)
Wang, C.H., S.N.Zhang, K.C.Li, et al., 2021: Change characteristics of precipitation in Northwest China from 1961 to 2018.Chinese J.Atmos.Sci., 45, 713-724, doi: 10.3878/j.issn.1006-9895.2101.20216.(in Chinese)
Wang, Q., Y.Zhao, F.Chen., et al., 2016: Characteristics of different patterns of South Asia high and their relationships with summer precipitation in Xinjiang.Plateau Meteor., 36,1209-1220.(in Chinese)
Wang, Q., P.-M.Zhai, and D.-H.Qin, 2020: New perspectives on‘warming-wetting’ trend in Xinjiang, China.Adv.Climate Change Res., 11, 252-260, doi: 10.1016/j.accre.2020.09.004.
Wu, P., Y.H.Ding, Y.J.Liu, et al., 2019: The characteristics of moisture recycling and its impact on regional precipitation against the background of climate warming over Northwest China.Int.J.Climatol., 39, 5241-5255, doi: 10.1002/joc.6136.
Xu, D., R.L.Li, and C.H.Wang, 2016a: Characteristics of precipitation changes and relationships with water vapor transport in typical arid regions of Asia and Africa under global warming.Climatic Environ.Res., 21, 737-748.(in Chinese)
Xu, D., Y.Kong, and C.H.Wang, 2016b: Changes of water vapor budget in arid area of Northwest China and its relationship with precipitation.J.Arid Meteor., 34, 431-439.(in Chinese)
Yang, J.H., Q.Zhang, X.Y.Liu, et al., 2019: Spatial-temporal characteristics and causes of summer precipitation anomalies in the transitional zone of typical summer monsoon, China.Chinese J.Geophys., 62, 4120-4128, doi: 10.6038/cjg2019M 0639.(in Chinese)
Yao, J.Q., M.Y.Li, D.Tuoliewubieke, et al., 2022: The assessment on “warming-wetting” trend in Xinjiang at multi-scale during 1961-2019.Arid Zone Res., 39, 333-346, doi: 10.138 66/j.azr.2022.02.01.(in Chinese)
Yu, R., and P.M.Zhai, 2021: Changes in summer persistent precipitation over the middle-lower reaches of the Yangtze River and associated atmospheric circulation patterns.J.Meteor.Res., 35, 393-401, doi: 10.1007/s13351-021-0186-z.
Zhai, P.M., F.M.Ren, and Q.Zhang, 1999: Detection of trends in China’s precipitation extremes.Acta Meteor.Sinica, 57,208-216, doi: 10.11676/qxxb1999.019.(in Chinese)
Zhai, P.M., L.Li, B.Q.Zhou, et al., 2016: Progress on mechanism and prediction methods for persistent extreme precipitation in the Yangtze-Huai River valley.J.Appl.Meteor.Sci., 27, 631-640, doi: 10.11898/1001-7313.20160511.(in Chinese)
Zhang, J.B., Y.Q.Su, S.Q.Sun, et al., 1986:Xinjiang Short-term Weather Forecast Guidebook.Xinjiang People’s Publishing House, Urumqi, 457 pp.(in Chinese)
Zhang, Q., J.H.Yang, W.Wang, et al., 2021: Climatic warming and humidification in the arid region of Northwest China:Multi-scale characteristics and impacts on ecological vegetation.J.Meteor.Res., 35, 113-127, doi: 10.1007/s13351-021-0105-3.
Zhang, Q., J.H.Yang, X.Y.Duan, et al., 2022: The eastward expansion of the climate humidification trend in northwest China and the synergistic influences on the circulation mechanism.Climate Dyn., 59, 2481-2497, doi: 10.1007/s00382-022-06221-4.
Zhang, X.B., W.D.Hogg, and É.Mekis, 2001: Spatial and temporal characteristics of heavy precipitation events over Canada.J.Climate, 14, 1923-1936, doi: 10.1175/1520-0442(20 01)014<1923:SATCOH>2.0.CO;2.
Zhao, Z.C., Y.H.Ding, Y.Xu, et al., 2003: Detection and prediction of climate change for the 20th and 21st century due to human activity in Northwest China.Climatic Environ.Res.,8, 26-34, doi: 10.3969/j.issn.1006-9585.2003.01.004.(in Chinese)
Zhou, B.Q., and P.M.Zhai, 2016: A new forecast model based on the analog method for persistent extreme precipitation.Wea.Forecasting, 31, 1325-1341, doi: 10.1175/WAF-D-15-0174.1.
Zhou, B.Q., P.M.Zhai, and Y.Chen, 2020: Contribution of changes in synoptic-scale circulation patterns to the past summer precipitation regime shift in eastern China.Geophys.Res.Lett., 47, e2020GL087728, doi: 10.1029/2020GL087728.
Zolina, O., C.Simmer, S.K.Gulev, et al., 2010: Changing structure of European precipitation: Longer wet periods leading to more abundant rainfalls.Geophys.Res.Lett., 37, L06704, doi:10.1029/2010GL042468.
Zuo, J.Q., W.J.Li, C.H.Sun, et al., 2013: Impact of the North Atlantic sea surface temperature tripole on the East Asian summer monsoon.Adv.Atmos.Sci., 30, 1173-1186, doi: 10.1007/s00376-012-2125-5.
杂志排行
Journal of Meteorological Research的其它文章
- Changes in Atmospheric Circulation during the Winter Regional Extreme Cold Events over China since 1960
- Variation of Dust in Northern China and Its Reproduction in BCC-ESM1 since 1980
- Predictability and Risk of Extreme Winter PM2.5 Concentration in Beijing
- Operational Plan, Effect Verification, and Key Technical Settings for a Stadium-Scale Artificial Rain Reduction Experiment
- Random Forest-Based Snow Cover Mapping in China Using Fengyun-3B VIRR Data
- Refined Spatialization of 10-Day Precipitation in China Based on GPM IMERG Data and Terrain Decomposition Using the BEMD Algorithm
