Changes in Atmospheric Circulation during the Winter Regional Extreme Cold Events over China since 1960
2023-11-10DongxueFUandYihuiDING
Dongxue FU and Yihui DING
1 School of Atmospheric Sciences, Nanjing University of Information Science & Technology, Nanjing 210044
2 Chinese Academy of Meteorological Sciences, China Meteorological Administration, Beijing 100081
3 Jilin Climate Center, Changchun 130062
4 National Climate Centre, China Meteorological Administration, Beijing 100081
ABSTRACT The number of days with occurrence of winter regional extreme cold events (RECEs) in China was found more during 1960/1961-1985/1986 (period 1), less during 1986/1987-2005/2006 (period 2), but more again during 2006/2007-2017/2018 (period 3).So far, the differences in the atmospheric circulation favoring RECEs among these three periods are unclear.In this paper, changes in atmospheric circulation during the RECEs over China are examined by using composite analysis based on the station observed temperature data and NCEP-NCAR reanalysis data in winters of 1960/1961-2017/2018.The results show: (1) the stratospheric polar vortex was more active and tended to split before the outbreak of RECEs in period 3 than that in other two periods.The shift of the stratospheric polar vortex to Eurasia helped the upper Arctic cold air to affect the lower latitudes.(2) The troposphere was characterized by a typical or significant three-wave pattern before the outbreak of RECEs in period 2, in contrast to a weakened three-wave pattern in period 1.Compared to periods 1 and 2, the Okhotsk blocking high was stronger in period 3, contributing to the inverted omega-shaped circulation pattern in East Asia-North Pacific section and a shift of global pattern from three-wave to two-wave.The weakened three-wave or two-wave circulation pattern was manifested by the stronger Ural/Okhotsk blocking high, conducive to the strengthening of the meridional circulation and the occurrence of RECEs in East Asia.(3) The Siberian high was the strongest in period 3, followed by period 1, and it was the weakest in period 2.Before the outbreak of RECEs, the Siberian high in period 3 began to intensify one week earlier than that in periods 1 and 2.Thus, the accumulation time of cold air mass in period 3 was the longest.In summary, the synergism of atmospheric circulation at high and low levels in periods 1 and 3 was more conducive to more and strong RECEs than that in period 2.Moreover, the split of the stratospheric polar vortex may have played an important role on the formation of tropospheric two-wave pattern in period 3.The results obtained herein may provide a better understanding of the mechanisms for occurrences of RECEs in China.
Key words: regional extreme cold events, interdecadal variation, polar vortex, blocking high, East Asian trough
1.Introduction
The global climate has shown a warming trend over the last 100 years (Ding and Dai, 1994; Easterling and Wehner, 2009).Moreover, winter temperatures in China have shown significant interdecadal fluctuations superimposed on this upward trend (Ding et al., 2008; Ding et al., 2014), as evidenced by the frequent occurrence of extreme low temperature events since the beginning of the 21st century (Fu and Ding, 2021; Zhang and Wang,2022).Extreme cold events in the context of a warming climate have led to social and environmental damage,such as the rare disaster of low temperatures, freezing rain, and blizzards in January 2008 (Ding et al., 2008)and the unprecedented cold wave in January 2016 (Si et al., 2021).It is therefore important to study extreme low temperature events in a warmer world.
A number of analyses have been conducted on the causes and subseasonal predictability of extreme cold events in winter (Alexander et al., 2006; Ding et al.,2014; Li et al., 2017; Bueh et al., 2018; Peng and Sun,2019).The direct cause of extreme cold events is the abnormalities and synergies of circulation systems at different altitudes, such as the polar vortex, blocking highs, the Siberian high, the East Asian trough, and so on (Bueh et al., 2011a; Song et al., 2016; Song and Wu, 2017; Li et al., 2019; Lü et al., 2019; He et al., 2020).Changes in the area and intensity of the polar vortex, which is a mass of cold air in the polar region, are significantly correlated with extreme low temperature events in China (Bueh et al., 2011b; Huang and Tian, 2019).
Blocking highs are considered to be the key system leading to outbreaks of cold waves in Eurasia and China(Buehler et al., 2011; Cheung and Zhou, 2015) because they can enhance the atmospheric meridional circulation,favor the accumulation of cold air from the polar region in front of the ridge, and then induce the occurrence of cold waves after their collapse (Wen et al., 2009; Zhou et al., 2009; Gong et al., 2013).In addition to the Ural blocking high, oceanic ridges over the North Atlantic and North Pacific are also closely associated with the outbreak of cold waves in China.The extension of these ridges to the polar region might lead to splitting of the polar vortex, and a shift of this split polar vortex to East Asia might, in turn, lead to the outbreak of cold waves(Han et al., 2018).
The Siberian high is the main system affecting the near-surface circulation in Asia in winter and is an important part of the East Asian winter monsoon.Its intensity directly reflects the strength and thickness of the cold air mass at ground level in high latitudes.A stronger Siberian high leads to lower winter temperatures in most parts of East Asia (Wang and Ding, 2006; Lan and Li,2016; Ma and Zhu, 2019).
It has been suggested that global warming does not always persist because the global average surface air temperature has not shown a significant increase since 1998(IPCC, 2013).This hiatus has been discussed previously(Xu et al., 2020).Similar to the changes in global temperature, the winter temperature in China has not increased continuously.Our previous study showed that both the winter mean temperature and the frequency of regional extreme cold events (RECEs) in China exhibit a clear interdecadal variation (Fu and Ding, 2021).Two abrupt changes in winter temperatures (i.e., the winters of 1985/1986 and 2005/2006) have been observed in China in the last 60 years (Liang et al., 2014).Winter temperatures in China were relatively low from the 1960s to the mid-1980s and then the temperature increased significantly from the mid-1980s.However, the overall trend of winter temperatures in China has been flat since winter 2006/2007, with no obvious upward trend.Therefore,based on the variation in winter temperatures in China since 1960, three stages are divided: period 1 (1960/1961 to 1985/1986), period 2 (1986/1987 to 2005/2006), and period 3 (2006/2007 to 2017/2018) (Liang et al., 2014;Fu and Ding, 2021).The attributes of RECEs show a clear decadal variation in these three periods, with significantly fewer RECEs in period 2 than in period 1, but an increase in the number and intensity of RECEs in period 3 (Fu and Ding, 2021; Zhang and Wang, 2022).
Although regional characteristics of the changes in winter temperatures and RECEs in China have been investigated in Fu and Ding (2021), the differences in RECE-related atmospheric circulation during different climatic periods have not been studied.In particular, the potentially unique features of the atmospheric circulation system that contribute to the increase in RECEs in period 3 are not yet fully understood.As a follow-up to the previous work, we have collected data for 101 RECEs and carried out a comprehensive examination of the tropospheric and stratospheric circulation systems during RECEs in the three time periods (period 1, period 2,and period 3), aiming to provide a deeper understanding of the causes and mechanisms for the RECEs in China.
2.Data and method
2.1 Data
We employed temperature observations derived from the dataset of basic meteorological elements at 2479 Chinese national surface meteorological stations, compiled by the National Meteorological Information Centre of the China Meteorological Administration.Daily minimum temperature data in winter from 1960/1961 to 2017/2018 were selected.Stations with more than five days of missing data were excluded.Observations from large cities with a population of more than one million were also excluded to reduce the impact of the heat island effect.A total of 1629 stations were finally designated (Zhai and Pan, 2003).We used the NCEP-NCAR reanalysis daily data on a 2.5° × 2.5° resolution for the same time period to analyze the atmospheric circulation(Kalnay et al., 1996; https://psl.noaa.gov/data/gridded/data.ncep.reanalysis.htm).Winter refers to December to next February.
2.2 Method
2.2.1Definition of RECEs
We adopted the definition of RECEs from the work of Fu and Ding (2021).The percentile method was used to judge whether an extreme low temperature occurred at a single station.The fifth percentile value of all the daily minimum temperatures in 58 winters was defined as the extreme low temperature threshold.For one single station, if the minimum temperature on one given day was lower than the threshold, an extreme low temperature was identified.If at least 10% of all national stations(i.e., 162 stations) experienced extreme low temperatures and at least 50% of these stations also observed extreme low temperatures on the previous day, one RECE was identified and events with a duration of more than three days were retained (Fu and Ding, 2021).The date with the largest number of stations recording extreme low temperatures was regarded as the outbreak day of the RECE.Based on this definition of RECEs, 101 RECEs(Table 1) were identified in China, of which 69 occurred in period 1, 18 in period 2, and 14 in period 3.
2.2.2Blocking high index
The blocking high index, originally proposed by Lejenäs and Økland (1983) and improved by Tibaldi and Molteni (1990), is used in the daily monitoring of blocking highs by the National Climate Centre of the China Meteorological Administration.First, the 5-day moving average of the 500-hPa geopotential height is calculated and then the geopotential height gradient of each longitude at three different latitudes is defined as:
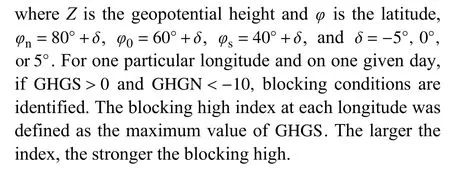
2.2.3Stratospheric polar vortex index
Following Kolstad and Charlton-Perez (2011), the stratospheric polar vortex index at 50 hPa was defined as:
where ZP is the polar vortex index,Zis the monthly geopotential height,Zis the climatology of monthly geopotential height, andφis the latitude.
2.2.4Siberian high index and Arctic Oscillation
The Siberian high index is defined as the average sealevel pressure over the region 40°-60°N, 80°-120°E,which is used by the Chinese National Climate Centre to monitor the Siberian high.The higher the value, the stronger the Siberian high.The Arctic Oscillation index was obtained from the National Oceanic and Atmospheric Administration Climate Prediction Center (https://www.cpc.ncep.noaa.gov/products/precip/CWlink/daily_ao_index/ao.shtml).
3.Results
3.1 Changes in winter RECEs
A total of 101 RECEs in China were identified based on our definition.On average, 2.7, 0.9, and 1.2 events per winter occurred in periods 1, 2, and 3, respectively (Fig.1).The number of days with RECEs in periods 1 and 3(19.8 and 8.3 days per winter, respectively) was more than that in period 2 (6.1 days per winter).Similar results were also found for long-lasting RECEs with a duration > 10 days.This analysis therefore indicates that the number of days with winter RECEs in China decreased significantly from period 1 to period 2, but increased in period 3.
3.2 Changes in the stratospheric circulation
The stratospheric polar vortex, in coordination with circulation systems at low levels, has important impacts on changes in the winter climate in mid- and high latitudes.Specifically, the stratospheric polar vortex contributes to the occurrence of winter RECEs in Eurasia through a synergism, with blocking highs at lower levels and the Siberian high at the surface (Huang and Tian,2019; Zhang Y.X.et al., 2022).Figure 2 shows the variation in the winter stratospheric polar vortex index during the last 60 years.The intensity of the winter stratospheric polar vortex has fluctuated dramatically in recent decades and is characterized by remarkable differences in the three time periods.The stratospheric polar vortex was strongest in period 2, followed by period 1 and was weakest in period 3.This indicates that the stratospheric polar vortex was easily split or displaced in period 3.Cold air at upper levels was generally concentrated in the Arctic Circle during period 2, but invaded lower latitudes during period 3.
Figure 3 shows the evolution of the 10-hPa geopotential height anomaly before the outbreak of RECEs in the three time periods.The evolution of the stratospheric circulation before the outbreak of RECEs was remarkably different during the three time periods.The stratospheric circulation was more active in period 3 than during the other two periods.The 10-hPa geopotential height of the RECEs hardly changed during period 1 and was consist-ent with the climatology.The stratospheric polar vortex remained stable without any tendency to shift or deform before the outbreak of RECEs during period 2.
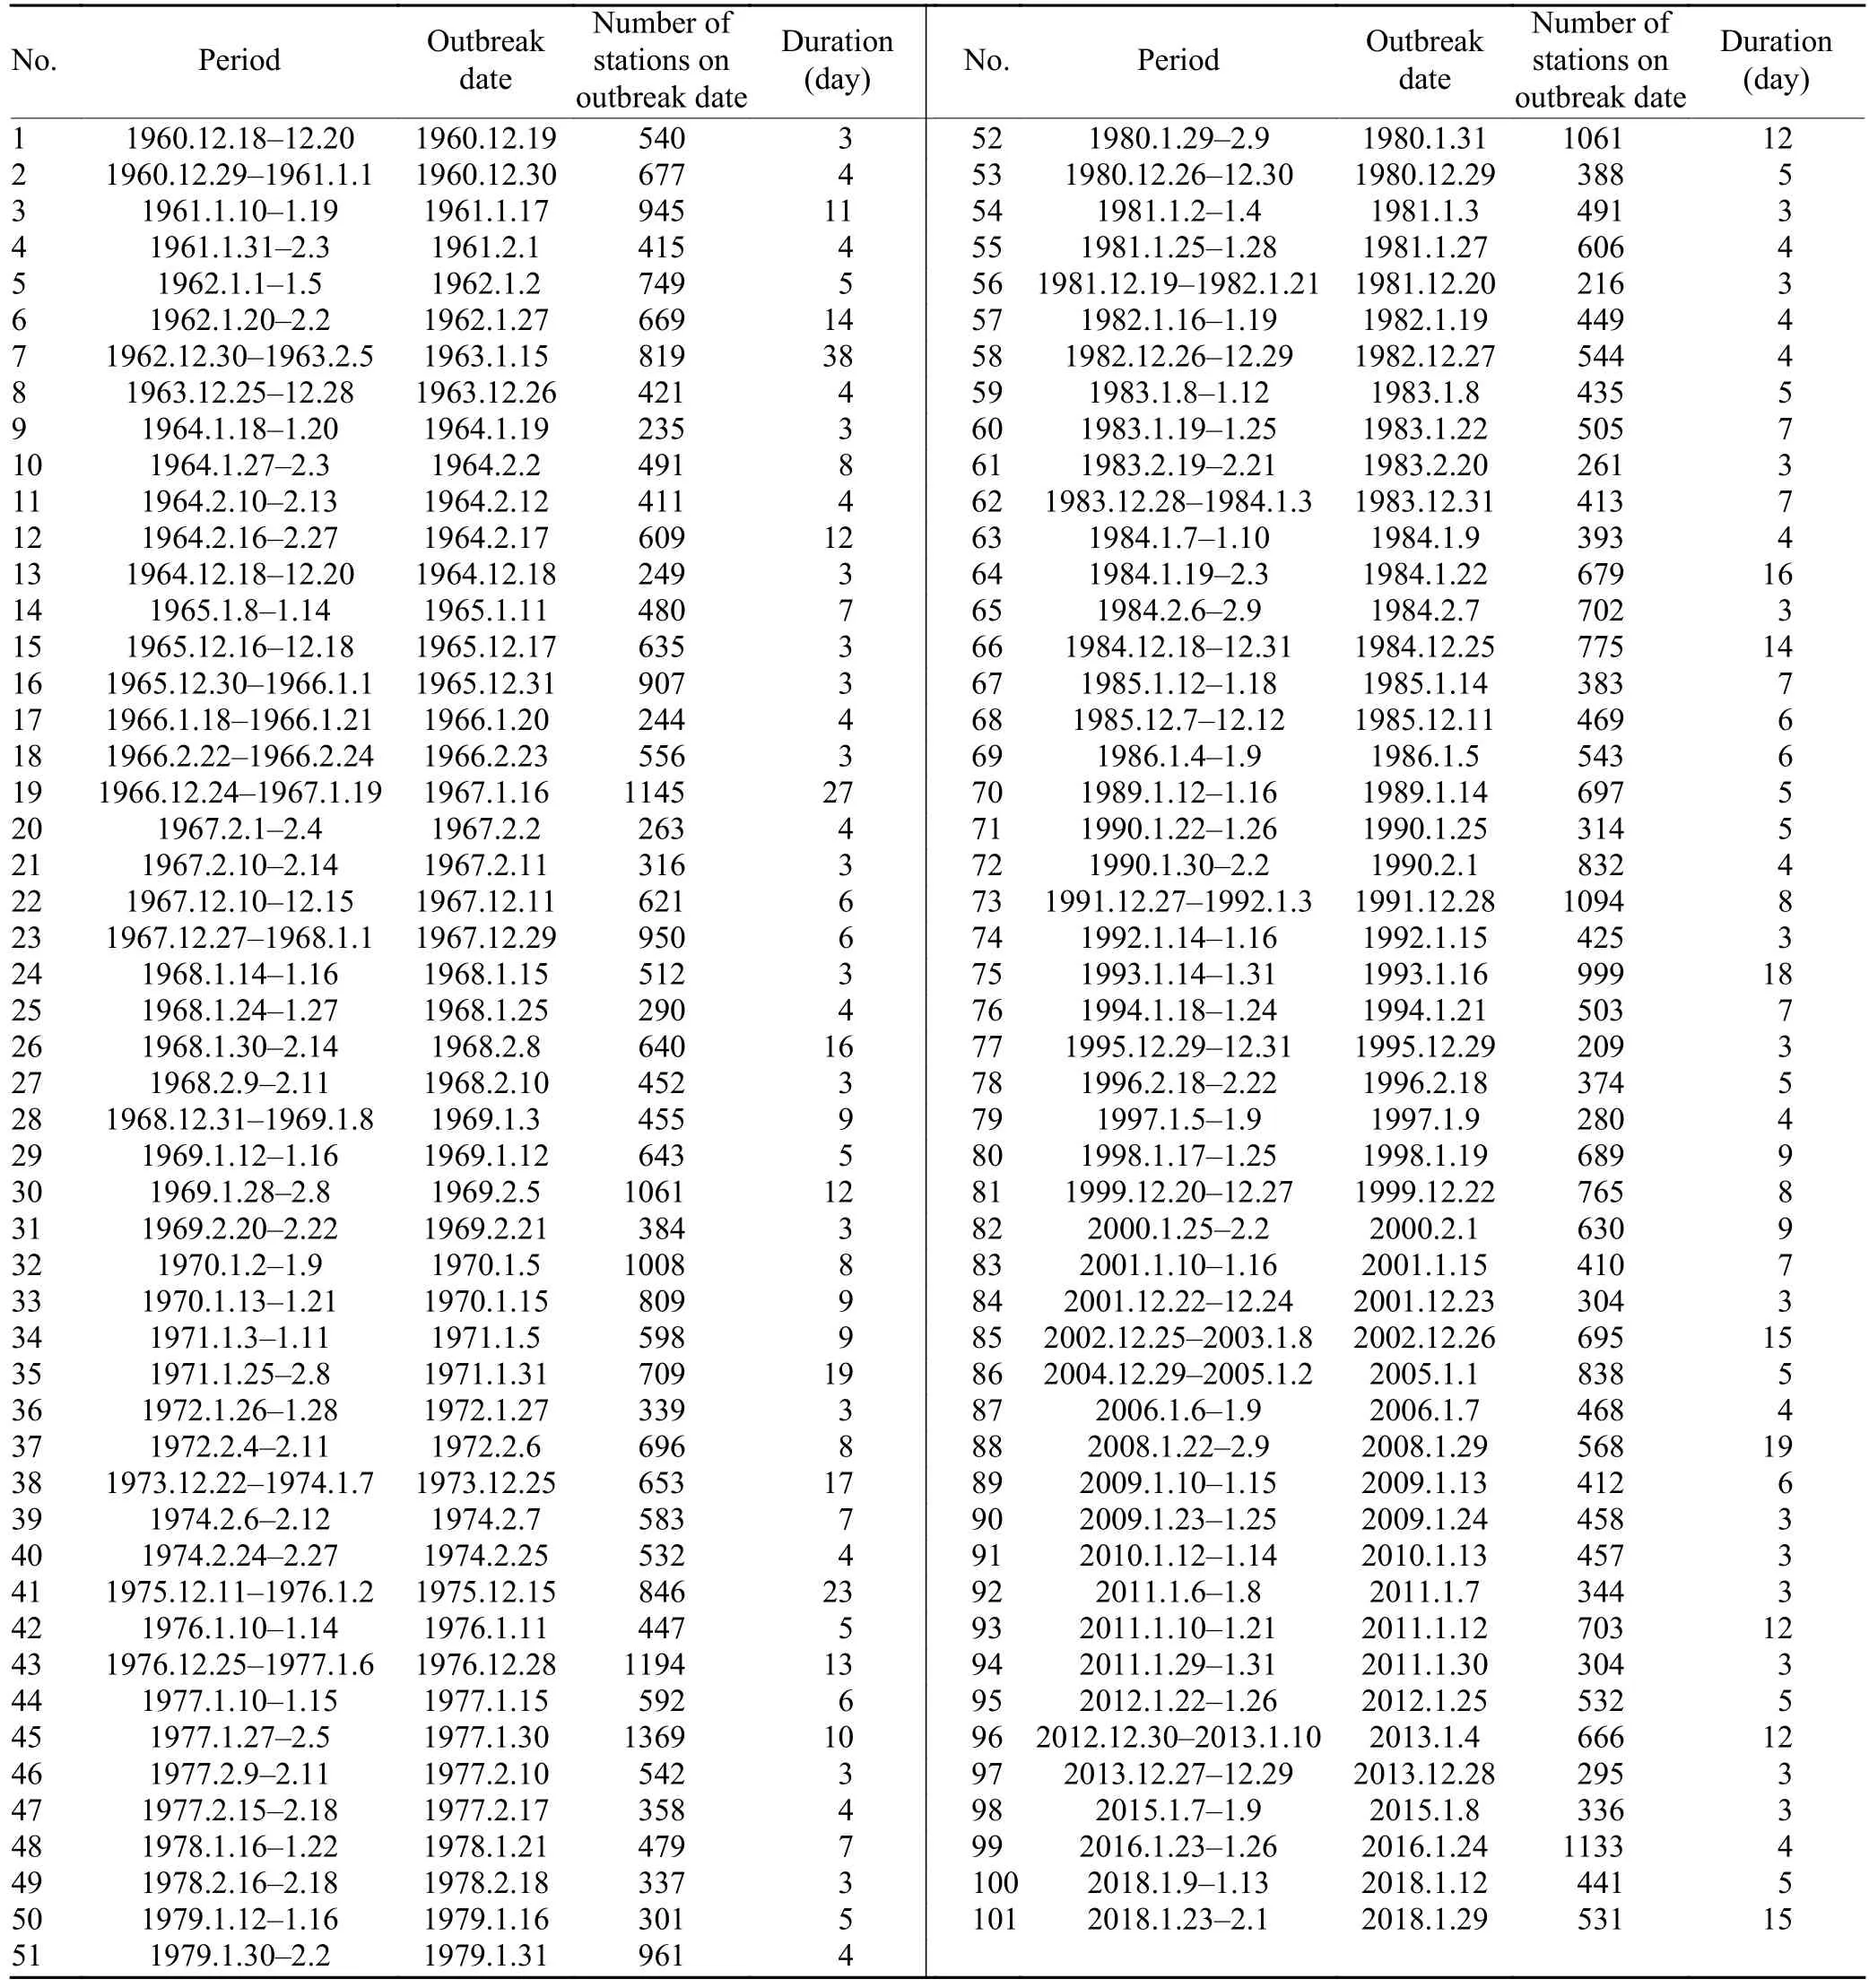
Table 1.The 101 RECEs over China from 1960/1961 to 2017/2018 winter
By contrast, the performance of the stratospheric polar vortex was completely different in period 3.The stratospheric polar vortex remained in the polar region during the seven days before the outbreak of RECEs (Fig.3c).A positive geopotential height anomaly then developed rapidly over the North Pacific (Figs.3f, i).One day before the outbreak of the RECEs, two negative anomaly centers appeared in the high latitudes of Eurasia and North America, indicating a split in the stratospheric polar vortex (Fig.3l).The split negative anomaly center on the Eurasian side caused the cold air flow with a high potential vorticity to move south from the Arctic toward the lower latitudes of Eurasia and China.This split in the stratospheric polar vortex helped to transport a high potential vorticity air flow from the stratosphere to the troposphere.As a result of the low stability of the troposphere and the conservation of potential vorticity, this descent of airflow with high potential vorticity into the troposphere enhanced the negative geopotential perturbations and cyclonic vorticity, deepening the East Asian trough in the troposphere and contributing to the outbreak of cold waves (Zhang C.Y.et al., 2022; Zhang Y.X.et al., 2022).
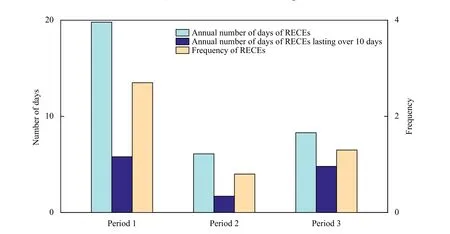
Fig.1.The average frequency and number of days of winter regional extreme cold events (RECEs) in China during different periods.Period 1 refers to 1960/1961-1985/1986, period 2 refers to 1986/1987-2005/2006, and period 3 refers to 2006/2007-2017/2018.
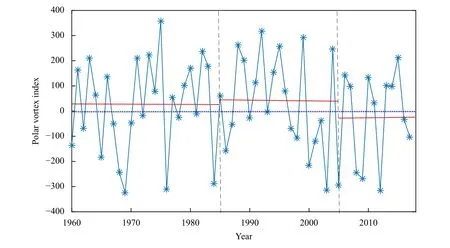
Fig.2.Variation of the polar vortex index at 50 hPa in winter from 1960/1961 to 2017/2018.The red line represents the average value for each period.The blue dashed line represents the 0 value.
3.3 Changes in the tropospheric circulation
The shift in the positive-negative phase of the Arctic Oscillation index can reflect the change in the tropospheric circulation in winter.Figure 4 shows that the variation in the Arctic Oscillation index before RECEs was not consistent during the three periods.During period 2, the Arctic Oscillation index changed from a positive to a negative phase 13 days before the RECEs broke out,with the lowest value at day -7.The Arctic Oscillation index then began to increase gradually and changed from a negative to a positive phase on day -3.By contrast,during periods 1 and 3, the Arctic Oscillation index was in the negative phase from day -21 until the outbreak of RECEs.
The boreal circulation systems in the mid- and high latitudes of the troposphere (e.g., the tropospheric polar vortex, blocking highs, and the East Asia trough) were the key factors contributing to the occurrence of RECEs in China.Figure 5 shows the composite of the geopotential height and its anomalies in the midtroposphere (500 hPa) during the seven days before the outbreak of RECEs in the three time periods.

Fig.3.Composites of the geopotential height anomalies (gpm) relative to the winter climatology from 1960/1961 to 2017/2018 at 10 hPa seven days before the outbreak of RECEs in China during (left-hand panel) period 1, (central panel) period 2, and (right-hand panel) period 3, where-7, -5, -3, and -1 indicate seven, five, three, and one day ahead of the outbreak day, respectively.The dots represent grid points with statistical significance exceeding the 95% confidence level.

Fig.4.Daily evolution of the Arctic Oscillation (AO) index during the three weeks before the outbreak of RECEs in China during the three periods.
The changes in the tropospheric circulation before the outbreak of RECEs were different during the three time periods.On day -7, the high-pressure ridge upstream of the East Asian trough strengthened during all three periods, but the largest positive anomaly, indicating the strongest development of the high-pressure ridge, occurred in period 3, when the ridge extended from the Ural Mountains to the North Pole, indicating a weak tropospheric polar vortex.There was a dramatic positive anomaly over the North Pacific during period 3, which led to the continuous enhancement of the Alaskan high-pressure ridge and its expansion toward the polar region.On day -5, the intensified Ural and Okhotsk blocking highs and the East Asian trough formed an inverted omegashaped circulation pattern.This pattern was maintained and strengthened three days before the outbreak of RECEs as a northeast-southwest high-pressure ridge upstream of East Asia, while a horizontal trough appeared to the east of the ridge.The Ural blocking high collapsed on day -1 and the trough changed from horizontal to vertical, causing the southward intrusion of cold air toward China.The trough in eastern Europe became shallower when RECEs occurred, whereas the trough in East Asia deepened, indicating that the atmospheric circulation in the troposphere changed from a three-wave pattern to a two-wave pattern (Fig.5l).
The circulation pattern before the outbreak of RECEs during period 1 was almost the same as that during period 3, but the positive anomaly of the two high-pressure ridges upstream and downstream of the East Asian trough was weaker than that during period 3 and the eastern European trough did not become shallower.The circulation was therefore a weakened three-wave pattern.By contrast, the conditions in the midtroposphere before the outbreak of RECEs were different during period 2 from those during the other two periods.Specifically,there was a negative anomaly of geopotential height in the North Pacific, a weak high-pressure ridge in Alaska,and no Okhotsk blocking high.As a result, the typical inverted omega-shaped pattern in the East Asia-North Pacific region was not established and the midtropospheric circulation was a typical or significant three-wave pattern.A negative anomaly of geopotential height was observed in the Arctic region during period 2, indicating a weak polar vortex in the midtroposphere.This did not favor the southward movement of cold air from the Arctic and therefore the number of RECEs in China decreased rapidly during period 2.
The establishment and collapse of blocking highs in mid- and high latitudes therefore have a crucial impact on RECEs in China.The troposphere was most active during period 3 and was modulated by the dramatic enhancement of the Ural and Okhotsk blocking highs(Fig.5).
Figure 6 shows the variation in the blocking high index within the three weeks before the outbreak of RECEs during the three time periods.The Ural and Okhotsk blocking highs showed very different changes before the outbreak of RECEs in the three different time periods.In period 1, the Ural blocking high developed strongly 10-15 days before the outbreak of RECEs and began to weaken about seven days before the outbreak(Fig.6a).The Ural blocking high was weak during period 2 (Fig.6b).In period 3, the Ural blocking high only developed strongly seven days before the outbreak of RECEs, but with a slightly greater intensity than during period 1 (Fig.6c).
The performance of the Okhotsk blocking high before the outbreak of RECEs was clearly different in period 3 from that during the other two periods.The Okhotsk blocking high started to develop strongly about two weeks before the outbreak of RECEs and reached a peak one week before the outbreak, with a much stronger intensity than in the other two time periods.The Okhotsk blocking high collapsed two days before the outbreak of RECEs with a clear pattern of establishment-development-collapse.During period 1, although the Okhotsk blocking high was present before the outbreak of RECEs,it was clearly weaker than during period 3.The Okhotsk blocking high was weakest during period 2.The stronger blocking circulation in the early stages of period 3 favored an increase in temperature in the Arctic region,leading to splitting of the tropospheric polar vortex and the subsequent intrusion of cold waves into China.
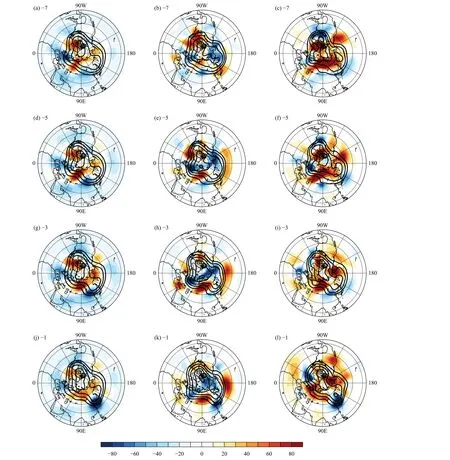
Fig.5.Composites of the geopotential height (black contour; interval 100 gpm) and anomalies (shading; gpm) relative to the winter climatology from 1960/1961 to 2017/2018 at 500 hPa seven days before the outbreak of RECEs in China during (left-hand panel) period 1, (central panel)period 2, and (right-hand panel) period 3, where -7, -5, -3, and -1 indicate seven, five, three, and one day ahead of the outbreak day, respectively.
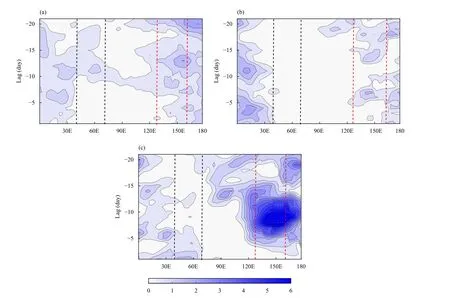
Fig.6.Time-longitude cross-section of the blocking high index (gpm degree latitude-1) during the three weeks before the outbreak of RECEs in China during (a) period 1, (b) period 2, and (c) period 3.The areas of black and red dotted lines indicate the Ural and Okhotsk blocking highs, respectively.
Figure 7 shows the changes in cold air in the troposphere before the outbreak of RECEs in China during periods 1, 2, and 3.Before the outbreak of RECEs in all three time periods, cold air accumulated and strengthened in the area between Lake Balkhash and Lake Baikal and then gradually invaded southeastward into China.However, the accumulation time, intensity, and range of influence of cold air were not consistent.Cold air began to accumulate and strengthen significantly on day -3 before the outbreak of RECEs during period 1, whereas during periods 2 and 3 cold air began to accumulate and strengthen significantly on day -5 before the outbreak of RECEs.
On day -5 before the outbreak of RECEs, the accumulation of cold air in period 3 was further west, close to Lake Balkhash; by contrast, the accumulation of cold air in period 2 was further east than in period 3.The range of influence of cold air in periods 1 and 3 was significantly greater than that in period 2 from day -3 before the outbreak of RECEs.Before the outbreak of RECEs, cold air was strongest in period 3 and weakest in period 2.
3.4 Changes in the sea-level pressure field
We investigated the changes in the sea-level pressure to study the changes in the Siberian high that affected the RECEs during the three time periods.
Figure 8c shows that the sea-level pressure in the key area of the Siberia high that affects the winter temperature in China presented a strong positive anomaly during period 3.This indicates a strong Siberian high and strengthened East Asian winter monsoon, which favored the occurrence of RECEs in China.Positive anomalies in the sea-level pressure were also observed in the key area of the Siberian high during period 1, but the anomaly was no smaller than the anomaly during period 3 (Fig.8a).There were negative anomalies in the region south of the key area of the Siberian high during both periods 1 and 3.This increased the north-south pressure gradient and contributed to the southward movement of cold air from high latitudes toward China.By contrast, negative sealevel pressure anomalies during period 2 led to a weak Siberian high, which, in turn, weakened the East Asian winter monsoon.As a result, RECEs were less likely to occur in China (Fig.8b).

Fig.7.Composites of the temperature anomalies (°C) relative to the winter climatology from 1960/1961 to 2017/2018 at 500 hPa seven days before the outbreak of RECEs in China during (left-hand panel) period 1, (central panel) period 2, and (right-hand panel) period 3, where -7, -5,-3, and -1 indicate seven, five, three, and one day ahead of the outbreak day, respectively.
Figure 9 shows that the daily evolution of the Siberian high before the occurrence of RECEs was significantly different during the three time periods.During period 3,the Siberian high began to strengthen two weeks before the outbreak of RECEs and its intensity was much stronger than that in periods 1 and 2.The Siberian high then strengthened rapidly around one week before the outbreak of RECEs and reached a peak three days before the outbreak.By contrast, in periods 1 and 2, the Siberian high began to strengthen about a week before the outbreak of RECEs and its intensity was lower than during period 3.The Siberian high in period 3 began to strengthen one week earlier than in the other two periods and remained stronger during the two weeks before the outbreak of RECEs.This suggests that more cold air accumulated in Siberia, favoring the occurrence of RECEs.
Figure 10 shows the proposed atmospheric circulation pattern of RECEs from the stratosphere to the surface during the three time periods based on our analyses.The synergism between the atmospheric circulation at high and low levels in periods 1 and 3 favored more and stronger RECEs than in period 2 because a weakened three- or two-wave pattern was manifested by the stronger Ural/Okhotsk blocking high that favored the occurrence of RECEs.The split in the stratospheric polar vortex and the long-lasting strong Siberian high also had an important role in the increase in the number of RECEs in period 3.

Fig.8.Sea-level pressure (black contour; hPa) and anomalies (shading; hPa) relative to the winter climatology from 1960-1961 to 2017-2018 during (a) period 1, (b) period 2, and (c) period 3, where the green box indicates the key area of the Siberian high.
Both observational studies and model simulations have provided robust evidence that the state of the stratosphere can influence the atmospheric circulation in the troposphere (Gillett and Thompson, 2003; Charlton et al.,2004; Yu et al., 2018).It has been shown that cold events over East Asia in winter can be attributed to the occurrence of stratospheric sudden warming (Zhang Y.X.et al., 2022).Stratospheric sudden warming and the splitting of the polar vortex may induce the stratospheric warming signal to propagate downward to the troposphere.This not only enhances Ural-Siberia blocking and the negative phase of the Arctic Oscillation, but also shifts the tropospheric polar vortex off the pole (Zhang and Wang, 2022).The displaced tropospheric polar vortex, Ural blocking, and another downstream blocking ridge over western North America can then form a distinct inverted omega-shaped circulation pattern in the East Asia-North Pacific sector (Zhang Y.X.et al.,2022).This inverted omega-shaped circulation pattern was seen in period 3 (Fig.10c).The two-wave pattern and inverted omega-shaped circulation pattern in the troposphere in period 3 might therefore be closely related to the split in the stratospheric polar vortex.
4.Summary and discussion
We analyzed the characteristics of the winter atmospheric circulation related to RECEs in China during three time periods using observational temperature data and NCEP-NCAR reanalysis data in winter from 1960/1961 to 2017/2018.Our findings are as follows.

Fig.9.The daily evolution of the Siberian high index anomaly within three weeks before the outbreak of RECEs in China during the three periods.The circles represent data with statistical significance exceeding the 95% confidence level.

Fig.10.Schematic diagram showing atmospheric circulation patterns of RECEs from the stratosphere to the surface during (a) period 1, (b)period 2, and (c) period 3.PV, polar vortex; NAT, North American trough; EET, East European trough; EAT, East Asian trough; UBH, Ural blocking high; OBH, Okhotsk blocking high; SH, Siberian high.
(1) In the stratosphere, the polar vortex was strongest in period 2, followed by period 1, and weakest in period 3.The height field of the stratosphere hardly changed during the week before the outbreak of RECEs in period 1 and the polar vortex was slightly shifted toward the Western Hemisphere.In period 2, the polar vortex was strong before the outbreak of RECEs and its position remained stable in the polar region.By contrast, during period 3, the polar vortex was active and deformed significantly one day before the outbreak of RECEs, showing a tendency to split into a dipole with two negative anomaly centers located at higher latitudes in Eurasia and northeastern North America.
(2) In the troposphere, an inverted omega-shaped pattern consisting of the Ural blocking high, the East Asian trough, and the Okhotsk blocking high was formed during the week before the outbreak of RECEs during both period 1 and period 3.But the Okhotsk blocking high was weak during period 2 and a typical inverted omegashaped pattern was not formed in the East Asia-North Pacific region.The Okhotsk blocking high was stronger in period 3 than in period 1 and extended toward the Arctic region, together with the Ural blocking high, leading to a weaker polar vortex in the troposphere.When RECEs occurred, the tropospheric circulation in the Northern Hemisphere showed a typical or significant threewave pattern in period 2, but a weakened three-wave pattern in period 1.Most notably, the circulation in period 3 shifted from a three-wave to a two-wave pattern when the RECEs broke out.
(3) At the sea level, the Siberian high was strongest during period 3 and weakest during period 2.The Siberian high began to strengthen earlier in period 3 than in the other two periods and remained stronger during the two weeks before the outbreak of RECEs, favoring the accumulation of cold air at the surface.
This analysis shows that the frequency of RECEs in China has not consistently decreased but, in fact, increased during period 3.Although there were more RECEs in China in both periods 1 and 3, characteristics of the atmospheric circulation supporting the outbreak of RECEs were different during the two time periods.
The troposphere presented a weakened three-wave pattern in period 1, indicating an increase in the amplitude of atmospheric waves and a decrease in the wave number.This provided a favorable background for the frequent occurrence of RECEs.In period 3, the shift from a three-wave to a two-wave pattern clearly suggests that the stronger trough and ridge in the troposphere contributed to the outbreak of stronger RECEs.
The stratospheric polar vortex was stronger and inactive before the outbreak of RECEs during period 1, but was active and tended to split during period 3.Previous studies have reported that an active stratospheric polar vortex (e.g., stratospheric sudden warming or a displacement or split of the polar vortex) may cause the stratospheric circulation signal to be transmitted downward to the troposphere.This would cause changes in construction of the tropospheric circulation (e.g., the shift in circulation from a three- to a two-wave pattern, a shift in the Arctic Oscillation phase, and the formation of an inverted omega-shaped pattern), which would contribute to the outbreak of RECEs in China (Charlton and Polvani,2007; Mitchell et al., 2013; Davini et al., 2014; Yu et al.,2022; Zhang Y.X.et al., 2022).Song and Wu (2019)showed that the stratospheric anomalies associated with planetary wave activity can propagate downward to the troposphere and influence the development of the East Asian trough and winter cold anomalies over East Asia.
We therefore suggest that the frequent occurrence of RECEs in China during period 3 was not only affected by key factors in the troposphere—such as the Ural blocking high, the Siberian high, and the East Asian trough—but was also associated with the instability of the stratospheric circulation and a change in the state of the polar vortex.The characteristics of the interaction between the stratosphere and the troposphere during period 3 and its impact on winter RECEs in East Asia, as well as the reasons for the instability of the stratosphere circulation and the state of the polar vortex, require further study.
Acknowledgments.We are grateful to the three anonymous reviewers for their valuable comments and helpful advice.
杂志排行
Journal of Meteorological Research的其它文章
- Changes in Persistent Precipitation in Northwest China and Related Large-Scale Circulation Features
- Variation of Dust in Northern China and Its Reproduction in BCC-ESM1 since 1980
- Predictability and Risk of Extreme Winter PM2.5 Concentration in Beijing
- Operational Plan, Effect Verification, and Key Technical Settings for a Stadium-Scale Artificial Rain Reduction Experiment
- Random Forest-Based Snow Cover Mapping in China Using Fengyun-3B VIRR Data
- Refined Spatialization of 10-Day Precipitation in China Based on GPM IMERG Data and Terrain Decomposition Using the BEMD Algorithm
